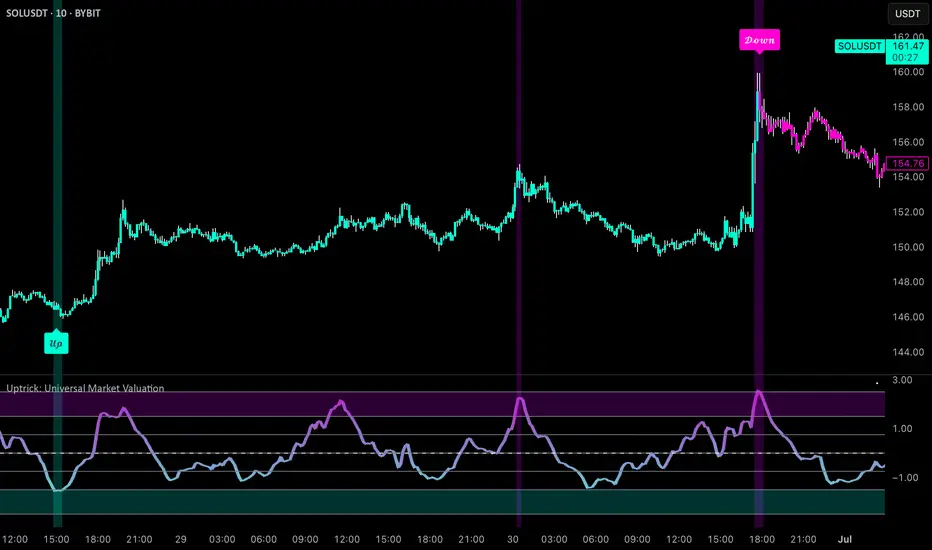
Uptrick: Universal Market ValuationIntroduction
Uptrick: Universal Market Valuation is created for traders who seek an analytical tool that brings together multiple signals in one place. Whether you focus on intraday scalping or long-term portfolio management, the indicator merges various well-known technical indicators to help gauge potential overvaluation, undervaluation, and trend direction. It is engineered to highlight different market dimensions, from immediate price momentum to extended cyclical trends.
Overview
The indicator categorizes market conditions into short-term, long-term, or a classic Z-Score style reading. Additionally, it draws on a unified trend line for directional bias. By fusing elements from traditionally separate indicators, the indicator aims to reduce “false positives” while giving a multidimensional view of price behavior. The indicator works best on cryptocurrency markets while remaining a universal valuation indicator that performs well across all timeframes. However, on lower timeframes, the Long-Term Combo input may be too long-term, so it's recommended to select the Short-Term Combo in the inputs for better adaptability.
Originality and Value
The Uptrick: Universal Market Valuation indicator is not just a simple combination of existing technical indicators—it introduces a multi-layered, adaptive valuation model that enhances signal clarity, reduces false positives, and provides traders with a more refined assessment of market conditions.
Rather than treating each included indicator as an independent signal, this script normalizes and synthesizes multiple indicators into a unified composite score, ensuring that short-term and long-term momentum, mean reversion, and trend strength are all dynamically weighted based on market behavior. It employs a proprietary weighting system that adjusts how each component contributes to the final valuation output. Instead of static threshold-based signals, the indicator integrates adaptive filtering mechanisms that account for volatility fluctuations, drawdowns, and momentum shifts, ensuring more reliable overbought/oversold readings.
Additionally, the script applies Z-Score-based deviation modeling, which refines price valuation by filtering out extreme readings that are statistically insignificant. This enhances the detection of true overvaluation and undervaluation points by comparing price behavior against a dynamically calculated standard deviation threshold rather than relying solely on traditional fixed oscillator bands. The MVRV-inspired ratio provides a unique valuation layer by incorporating historical fair-value estimations, offering deeper insight into market overextension.
The Universal Trend Line within the indicator is designed to smooth trend direction while maintaining responsiveness to market shifts. Unlike conventional trend indicators that may lag significantly or produce excessive false signals, this trend-following mechanism dynamically adjusts to changing price structures, helping traders confirm directional bias with reduced noise. This approach enables clearer trend recognition and assists in distinguishing between short-lived pullbacks and sustained market movements.
By merging momentum oscillators, trend strength indicators, volume-driven metrics, statistical deviation models, and long-term valuation principles into a single framework, this indicator eliminates the need for juggling multiple individual indicators, helping traders achieve a holistic market perspective while maintaining customization flexibility. The combination of real-time alerts, dynamic color-based valuation visualization, and customizable trend-following modes further enhances usability, making it a comprehensive tool for traders across different timeframes and asset classes.
Inputs and Features
• Calculation Window (Short-Term and Long-Term)
Defines how much historical data the indicator uses to evaluate the market. A smaller window makes the indicator more reactive, benefiting high-frequency traders. A larger window provides a steadier perspective for longer-term holders.
• Smoothing Period (Short-Term and Long-Term)
Controls how much the raw indicator outputs are “smoothed out.” Lower values reveal subtle intraday fluctuations, while higher values aim to present more robust, stable signals.
• Valuation Mechanism (Short Term Combo, Long Term Combo, Classic Z-Score)
Allows you to pick how the indicator evaluates overvaluation or undervaluation. Short Term Combo focuses on rapid oscillations, Long Term Combo assesses market health over more extended periods, and the Classic Z-Score approach highlights statistically unusual price levels.
Short-Term
• Determination Mechanism (Strict or Loose)
Governs the tolerance for labeling a market as overvalued or undervalued. Strict requires stronger confirmation; Loose begins labeling sooner, potentially catching moves earlier but risking more false signals.
Strict
Loose
• Select Color Scheme
Lets you choose the aesthetic style for your charts. Visual clarity can significantly improve reaction time, especially when multiple indicators are combined.
• Z-Score Coloring Mode (Heat or Slope)
Determines how the Classic Z-Score line and bars are colored. In Heat mode, the indicator intensifies color as readings move further from a baseline average. Slope mode changes color based on the direction of movement, making turning points more evident.
Classic Z-Score - Heat
Classic Z-Score - Slope
• Trend Following Mode (Short, Long, Extra Long, Filtered Long)
Offers various ways to compute and smooth the universal trend line. Short is more sensitive, Long and Extra Long are meant for extended time horizons, and Filtered Long applies an extra smoothing layer to help you see overarching trends rather than smaller fluctuations.
Short Term
Long Term
Extra Long Term
Filtered Long Term
• Table Display
An optional feature that places a concise summary table on the chart. It shows valuation states, trend direction, volatility condition, and other metrics, letting you observe multi-angle readings at a glance.
• Alerts
Multiple alert triggers can be set up—for crossing into overvaluation zones, for abrupt changes in trend, or for high volatility detection. Traders can stay informed without needing to watch charts continuously.
Why These Indicators Were Merged
• RSI (Relative Strength Index)
RSI is a cornerstone momentum oscillator that interprets speed and change of price movements. It has widespread recognition among traders for detecting potential overbought or oversold conditions. Including RSI provides a tried-and-tested layer of momentum insight.
• Stochastic Oscillator
This oscillator evaluates the closing price relative to its recent price range. Its responsiveness makes it valuable for pinpointing near-term price fluctuations. Where RSI offers a broader momentum picture, Stochastic adds fine-tuned detection of short-lived rallies or pullbacks.
• MFI (Money Flow Index)
MFI assesses buying and selling pressure by incorporating volume data. Many technical tools are purely price-based, but MFI’s volume component helps address questions of liquidity and actual money flow, offering a glimpse of how robust or weak a current move might be.
• CCI (Commodity Channel Index)
CCI shows how far price lies from its statistically “typical” trend. It can spot emerging trends or warn of overextension. Using CCI alongside RSI and Stochastic further refines the valuation layer by capturing price deviation from its underlying trajectory.
• ADX (Average Directional Index)
ADX reveals the strength of a trend but does not specify its direction. This is especially useful in combination with other oscillators that focus on bullish or bearish momentum. ADX can clarify whether a market is truly trending or just moving sideways, lending deeper context to the indicator's broader signals.
• MACD (Moving Average Convergence Divergence)
MACD is known for detecting momentum shifts via the interaction of two moving averages. Its inclusion ensures the indicator can capture transitional phases in market momentum. Where RSI and Stochastic concentrate on shorter-term changes, MACD has a slightly longer horizon for identifying robust directional changes.
• Momentum and ROC (Rate of Change)
Momentum and ROC specifically measure the velocity of price moves. By indicating how quickly (or slowly) price is changing compared to previous bars, they help confirm whether a trend is gathering steam, losing it, or is in a transitional stage.
• MVRV-Inspired Ratio
Drawn loosely from the concept of comparing market value to some underlying historical or fair-value metric, an MVRV-style ratio can help identify if an asset is trading above or below a considered norm. This additional viewpoint on valuation goes beyond simple price-based oscillations.
• Z-Score
Z-Score interprets how many standard deviations current prices deviate from a central mean. This statistical measure is often used to identify extreme conditions—either overly high or abnormally low. Z-Score helps highlight potential mean reversion setups by showing when price strays far from typical levels.
By merging these distinct viewpoints—momentum oscillators, trend strength gauges, volume flow, standard deviation extremes, and fundamental-style valuation measures—the indicator aims to create a well-rounded, carefully balanced final readout. Each component serves a specialized function, and together they can mitigate the weaknesses of a single metric acting alone.
Summary
This indicator simplifies multi-indicator analysis by fusing numerous popular technical signals into one tool. You can switch between short-term and long-term valuation perspectives or adopt a classic Z-Score approach for spotting price extremes. The universal trend line clarifies direction, while user-friendly color schemes, optional tabular summaries, and customizable alerts empower traders to maintain awareness without constantly monitoring every market tick.
Disclaimer
The indicator is made for educational and informational use only, with no claims of guaranteed profitability. Past data patterns, regardless of the indicators used, never ensure future results. Always maintain diligent risk management and consider the broader market context when making trading decisions. This indicator is not personal financial advice, and Uptrick disclaims responsibility for any trading outcomes arising from its use.
Medium-term
Improved RSI Trend Sniper | JeffreyTimmermansImproved RSI Trend Sniper
This indicator, the "Improved RSI Trend Sniper" is a sophisticated tool designed to enhance market trend analysis by integrating customizable RSI thresholds with advanced moving average options and refined visual enhancements.
Key Features
Advanced Moving Average Options:
The indicator now supports multiple moving average types: SMA, EMA, SMMA, WMA, VWMA, LSMA, HMA, and ALMA, offering greater flexibility in trend analysis.
Users can customize the moving average length for precise momentum detection.
Enhanced Momentum Detection:
Upgraded to allow dynamic calculation of momentum based on user-selected moving averages.
Conditions for bullish or bearish momentum now consider changes in the chosen moving average rather than a fixed EMA, improving accuracy.
Visual Upgrades:
A gradient-based trend fill with multiple opacity layers provides a visually appealing representation of bullish and bearish trends.
New dashboard integration displays key market information, including the ticker, timeframe, and current trend (bullish or bearish).
Improved Signal Customization:
Customizable colors and labels for bullish and bearish signals ensure easy identification on the chart.
Enhanced settings for showing or hiding labels and trend fills
Refined Alerts System:
Alerts are now generated for bullish and bearish conditions with customized messages for better responsiveness.
Alerts can be triggered once per bar close, making them more reliable.
What's New:
RSI and MA Customization: Users can define thresholds and moving average settings, providing more control over trend analysis.
Dashboard Integration: Displays real-time updates directly on the chart for improved situational awareness.
Visual Enhancements: Introduced gradient fills for trend regions, making trends more distinct.
Expanded Moving Average Options: Allows for tailored strategies using various MA calculation methods.
Alert Messaging: Streamlined notifications for actionable insights.
How It Works
Momentum Analysis:
Bullish momentum is detected when the RSI crosses above the bullish threshold and the moving average is increasing.
Bearish momentum is flagged when the RSI falls below the bearish threshold, and the moving average is decreasing.
Trend Visualization:
Bullish trends are highlighted with gradient shades of green, while bearish trends use shades of red.
Labels appear on the chart to mark key turning points.
Tailored for Different Trading Styles
The Improved RSI Trend Sniper is versatile and adaptable, catering to traders with various time horizons:
Long-Term Adjustments: For traders focusing on long-term trends, increasing the RSI length and moving average period allows the indicator to smooth out minor price fluctuations and highlight sustained momentum. Selecting slower-moving averages like the SMA or LSMA further filters out short-term noise, ensuring signals align with broader market trends.
Medium-Term Adjustments: Swing traders can use a balanced RSI length (e.g., 14–20) and a medium moving average period (e.g., 20–50) to capture actionable signals within the mid-range market cycles. The inclusion of options like EMA or SMMA ensures quicker reactions to price changes while maintaining moderate sensitivity to reversals.
Short-Term Adjustments: For day traders or scalpers, using a shorter RSI period (e.g., 7–10) alongside faster moving averages such as the HMA or ALMA can provide quicker signals for high-frequency trading. These adjustments enhance the ability to react swiftly to immediate market shifts, ideal for fast-paced trading environments.
By customizing the indicator’s settings to align with your trading timeframe, the Improved RSI Trend Sniper ensures accurate and relevant insights, empowering traders to optimize their strategies across any market condition.
Dashboard Details
Provides an at-a-glance view of market data for the current ticker and timeframe.
The Improved RSI Trend Sniper takes the original tool to the next level, offering a more comprehensive, customizable, and visually intuitive approach to market trend analysis. Perfect for traders looking to refine their strategies with actionable insights.
-Jeffrey

Pivot Highs&lows: Short/Medium/Long-term + Spikeyness FilterShows Pivot Highs & Lows defined or 'Graded' on a fractal basis: Short-term, medium-term and long-term. Also applies 'Spikeyness' condition by default to filter-out weak/rounded pivots
ES1! 4hr chart (CME) shown above, with lookback = 15; clearly identifying the major highs & lows on the basis of how they are fractally 'nested' within lesser Pivots.
-- in the above chart Short term pivot highs (STH) are simply represented by green 'ʌ', and short-term pivot lows (STL) are simply represented by orange 'v'.
//Basics: (as applying to pivot highs, the following is reversed for pivot lows)
-Short term highs (STH) are simple pivot highs, albeit refined from standard with the 'spikeyness' filter.
-Medium-term highs (MTH) are defined as having a lower STH on either side of them.
-Long-term highs (LTH) are defined as having a lower MTH on either side of them.
//Purpose:
-Education: Quick and easy visualization of the strength or importance of a pivot high or low; a way of grading them based on their larger context.
-Backtesting: use in combination with other trading methods when backtesting to see the relative significance and price sensitivity of LTHs/LTLs compared to lower grade highs and lows.
//Settings:
-Choose Pivot lookback/lookforward bars: One setting, the basis from which all further pivot calculations are done.
-Toggle on/off 'Spikeyness' condition to filter-out weak/rounded/unimpressive pivot highs or lows (default is ON).
-Toggle on/off each of STH, MTH, LTH, STL, MTL, LTL; and choose label text-styles/colors/sizes independently.
-Set text Vertically, horizonally, or simply use 'ʌ' or 'v' symbols if you want to declutter your chart.
//Usage notes:
-Pivots take time to print (lookback bars must have elapsed before confirmation). Fractally nested pivots as here (i.e. a LTH), take even longer to print/confirm, so please be patient.
-Works across timeframes & Assets. Different timeframes may require slightly tweaked lookback/forward settings for optimal use; default is 15 bars.
Example usage with just symbolic labels short-term, med-term, long-term with 1x, 2x and 3x ʌ/v respectively:

Revistochmanic StrategyRevistochmanic Wave is a stock tracking trends indicator & strategy for medium & long term investing.
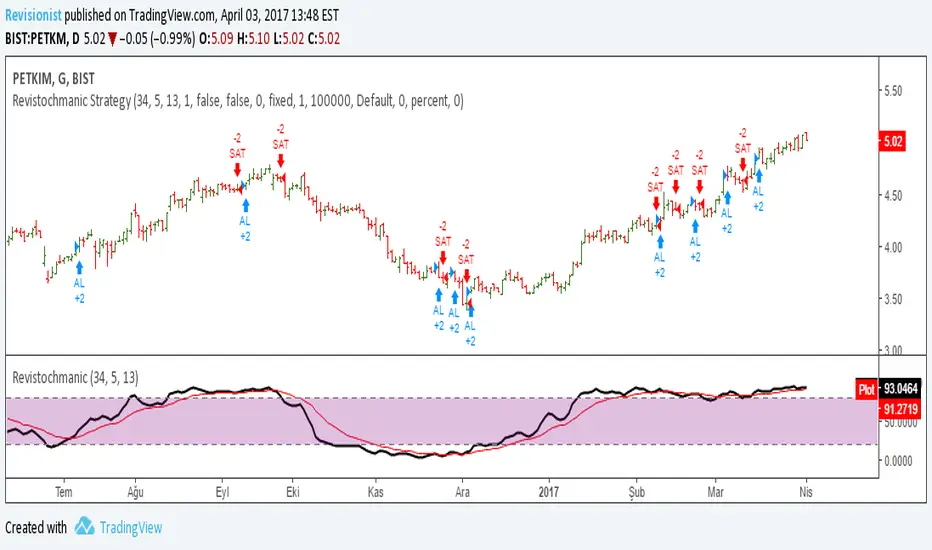
Revistochmanic Wave İndicator Revistochmanic Wave is a stock tracking trends indicator & strategy for medium & long term investing.
Stochastic 34 period
smoothK 5 period (ema/red line)
smoothD 13 period (stochastic/black line)
