Renko Velocity Meter [Chris Chapman]Here is the comprehensive copy for your Renko Velocity Meter indicator. This is structured to be used in a TradingView description, a manual, or a product listing.
Renko Velocity Meter
What is this Indicator?
The Renko Velocity Meter is a specialized momentum dashboard designed strictly for Renko Charts. Unlike standard oscillators (like RSI or MACD) which often fail on Renko due to the lack of time-based data, this tool uses "Brick Physics" to measure the actual speed and efficiency of price movement.
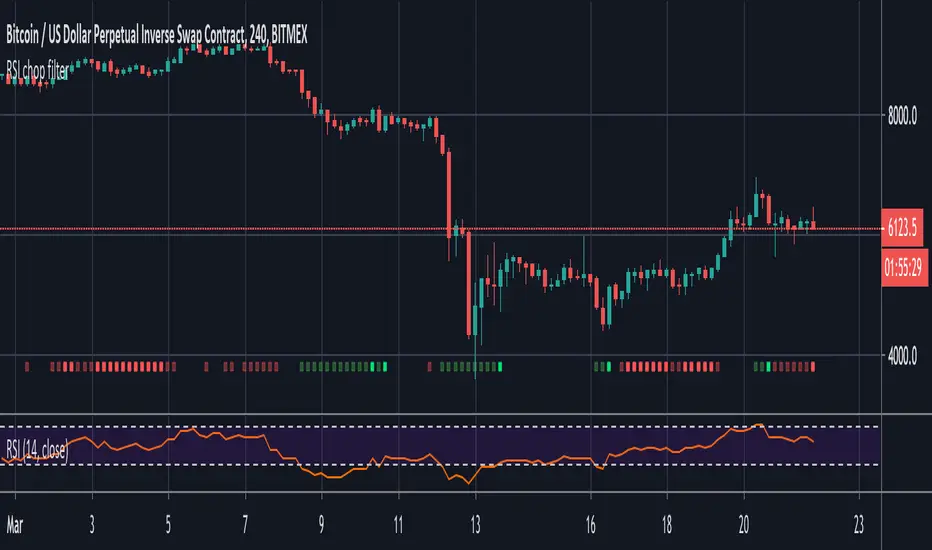
It answers the most critical question in Renko trading: "Is this a real trend, or just a choppy consolidation?"
Instead of giving you lagging signals, it provides a real-time Velocity Score (0-100) displayed on a dashboard directly on your chart. It automatically filters out "fake" moves and highlights high-probability "TURBO" conditions when the market enters a powerful extension phase.
How It Is Calculated
The Velocity Score is derived from a proprietary blend of three distinct mathematical checks:
1. Trend Efficiency ("The Snake Logic") The script calculates the ratio between the Net Price Move and the Total Distance Traveled over a lookback period.
High Efficiency: Price is moving in a straight line (Strong Trend).
Low Efficiency: Price is winding back and forth (Chop/Range).
2. Momentum Deviation (Auto-Brick Detection) The indicator automatically detects your specific Renko brick size (whether 2 pips, 10 points, or custom) without manual input. It then measures how many "Bricks" the price has pulled away from the baseline Moving Average.
If price is 6+ bricks away from the average, it signals a high-momentum extension.
3. HTF Trend Lock (Multi-Timeframe Filter) It internally checks a Higher Timeframe (default: 15-minute) to ensure you are trading with the dominant trend.
HTF LOCK: The Renko trend and the 15m trend are aligned (Green).
HTF MIX: The trends are conflicting. The score is automatically capped at 60 to prevent false signals.
4. The "Counter-Trend" Penalty To prevent buying tops or selling bottoms, the script instantly penalizes the score if a "Retracement Brick" forms.
Example: If the trend is UP, but a RED brick forms, the score is forced down to the "Yellow/Neutral" zone until the trend resumes.
Requirements
To use this indicator effectively, you must meet the following chart conditions:
Chart Type: Renko (This is mandatory. The math relies on fixed-size bricks).
Timeframe: Works on all timeframes, but optimized for standard scalping setups (e.g., 2-pip fixed bricks on EURUSD/Gold).
Data Feed: High-quality data is recommended. For maximum precision, use a 1-second (1s) interval setting for your Renko box generation if your TradingView plan allows it.
The Inputs (Settings)
You can customize the sensitivity of the meter to fit your specific asset class:
Trend Efficiency Period (Default: 14):
The number of bricks used to calculate how "straight" the trend is. Lower numbers make the score faster; higher numbers make it smoother.
Momentum Baseline (Default: 20):
The length of the internal Moving Average used as the "mean" price.
Max Momentum in Bricks (Default: 6):
How many bricks of extension are required to hit a "100% Score"? Increase this for volatile assets like Gold or Bitcoin.
HTF Support (Default: 15):
The Higher Timeframe used for the Trend Lock filter.
Meter Position:
Choose where the dashboard appears on your screen (Top Right, Bottom Left, etc.).
Dashboard Legend
GREEN (Score > 70): TURBO – Strong trend alignment. High probability of continuation.
YELLOW (Score 50-70): TREND – Active trend, but potentially stalling or retracing.
RED (Score < 50): CHOP – No clear direction or conflicting signals. Stay flat.
POSITION: Shows the current logic state (LONG/SHORT/FLAT).
Penunjuk Pine Script®