MFI Nexus Pro [trade_lexx]📈 MFI Nexus Pro is your reliable trading assistant!
📊 What is MFI Nexus Pro ?
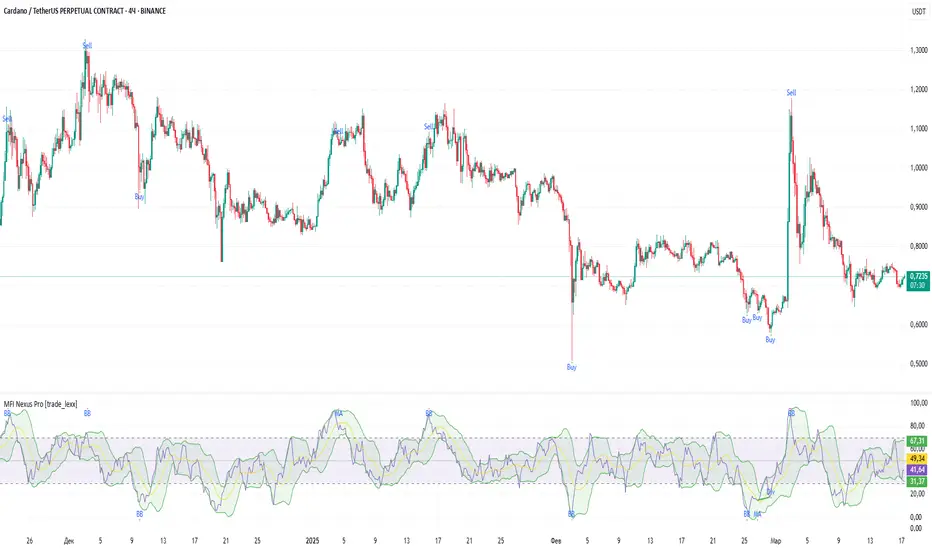
MFI Nexus Pro is a trading indicator that analyzes cash flows in the market. It shows where money is moving — into or out of an asset, and based on this, generates buy or sell signals.
💡 The main components of the indicator
📊 The MFI Cash Flow Index (MFI)
shows the strength of cash flow into an asset. Values above 70 indicate overbought (an early sale is possible), and values below 30 indicate oversold (an early purchase is possible).
📈 Moving Averages (MA)
The indicator uses 10 different types of moving averages to smooth the MFI line.:
- SMA: Simple moving average
- EMA: Exponential moving average
- WMA: Weighted moving average
And other more complex types (HMA, KAMA, VWMA, ALMA, TEMA, ZLEMA, DEMA)
The choice of the type of moving average affects the speed of the indicator's response to market changes.
🎯 Bollinger Bands (BB)
Bands around the moving average that widen and narrow depending on volatility. They help determine when the MFI is out of the normal range.
🔄 Divergences
Divergences show discrepancies between price and MFI:
- Bullish divergence: the price is falling and the MFI is rising — an upward reversal is possible
- Bearish divergence: the price is rising and the MFI is falling — a downward reversal is possible
🔍 Indicator signals
1️⃣ Moving average signals (MA)
Buy signal
- What happens: MFI crosses its moving average from bottom to top
- What does it look like: the green triangle labeled "MA" under the chart
- What does it mean: money begins to actively flow into the asset, price growth is possible
Sell signal
- What happens: the MFI crosses the moving average from top to bottom
- What does it look like: a red triangle with the label "MA" above the chart
- What does it mean: money starts to leave the asset, the price may fall
2️⃣ Bollinger Band Signals (BB)
Buy signal
- What's happening: The MFI crosses the lower Bollinger band from bottom to top
- What it looks like: the green triangle marked "BB"
- What it means: The MFI was too low and is now starting to recover
Sell Signal
- What's going on: MFI crosses the upper Bollinger band from top to bottom
- What it looks like: a red triangle marked "BB"
- What it means: The MFI was too high and is now starting to decline
3️⃣ Divergence Signals (Div)
Buy Signal (Bullish Divergence)
- What's going on: the price is falling more than the MFI
- What it looks like: a green triangle marked "Div"
- What it means: despite the fall in price, money is already starting to return to the asset
Sell signal (bearish divergence)
- What is happening: the price is rising more strongly than the MFI
- What does it look like: the red triangle with the label "Div"
- What does it mean: despite the price increase, money is already starting to leave the asset
🛠️ Filters to filter out false signals
1️⃣ Minimum distance between the signals
- What it does: sets the minimum number of candles between signals
- Why it is needed: prevents signals from being too frequent during strong market fluctuations
- How to set it up: Set the number from 0 and above (default: 5)
2️⃣ "Waiting for the opposite signal" mode
- What it does: waits for a signal in the opposite direction before generating a new signal
- Why you need it: it helps you not to miss important trend reversals
- How to set up: just turn the function on or off
3️⃣ Filter by MFI levels
- What it does: generates signals only when the MFI is in the specified ranges
- Why it is needed: it helps to catch the moments when the market is oversold or overbought
- How to set up:
- For buy signals: set a range for oversold (e.g. 1-30)
- For sell signals: set a range for overbought (e.g. 70-100)
4️⃣ The RSI filter
- What it does: additionally checks the RSI values to confirm the signals
- Why it is needed: adds additional confirmation from another popular indicator
- How to set up: Similar to the MFI filter, set ranges for buying and selling
🔄 Signal combination modes
1️⃣ Normal mode ("None")
- How it works: all signals (MA, BB, Div) work independently of each other
- When to use it: for general market analysis or when learning how to work with the indicator
2️⃣ "And" mode ("MA and BB and Div")
- How it works: the alarm appears only when several conditions are triggered simultaneously
- Combination options:
- MA+BB: signals from the moving average and Bollinger bands
- MA+Div: signals from the moving average and divergence
- BB+Div: signals from the Bollinger bands and divergence
- MA+BB+Div: all three signals simultaneously
- When to use: for more reliable but rare signals
3️⃣ "OR" mode ("MA or BB or Div")
- How it works: the alarm appears when any of the conditions are triggered
- When to use: for frequent signals when you don't want to miss any opportunity.
🔌 Connecting to trading strategies
The indicator can be connected to your trading strategies using 5 different channels.:
1. Channel for MA signals: connects only signals from moving averages
2. BB signal channel: connects only the signals from the Bollinger bands
3. Channel for divergence signals: connects only divergence signals
4. Channel for "And" mode: connects only combined signals
5. Channel for "OR" mode: connects signals from any source
🔔 Setting up alerts
The indicator can send alerts when alarms appear.:
- Alerts for MA: when the MFI crosses the moving average
- Alerts for BB: when the MFI crosses the Bollinger bands
- Divergence alerts: when a divergence is detected
- Combined alerts: for "AND" and "OR" modes
🎭 What does the indicator look like on the chart ?
- MFI main line: purple line
- Overbought/oversold levels: horizontal lines at levels 30 and 70
- Middle line: dotted line at level 50
- MFI Moving Average: yellow line
- Bollinger bands: green lines around the moving average
- Signals: green and red triangles with corresponding labels
📚 How to start using MFI Nexus Pro
1️⃣ Initial setup
- Add an indicator to your chart
- Select the type of moving average and the period (you can leave it as the default)
- Activate the desired signal types (MA, BB, Div)
2️⃣ Filter settings
- Set the distance between the signals to get rid of unnecessary noise
- Adjust the MFI and RSI levels depending on how volatile your asset is
- If you need more reliable signals, turn on the "Waiting for the opposite signal" mode.
3️⃣ Operation mode selection
- First, use the standard mode to see all possible signals.
- When you get comfortable, try the "And" mode for more reliable signals.
- For active trading, you can use the "OR" mode
4️⃣ Setting up Alerts
- Select the types of signals you want to be notified about
- Set up alerts for "AND" or "OR" modes if you use them
5️⃣ Verification and adaptation
- Check the operation of the indicator on historical data
- Adjust the parameters for a specific asset
- Adapt the settings to your trading style
🌟 Usage examples
For trend trading
- Use MA signals in the direction of the main trend
- Turn on the "Waiting for the opposite signal" mode
- Set stricter levels for filters
For trading in a sideways range
- Use BB signals to detect bounces from the range boundaries
- Use the MFI level filter to confirm overbought/oversold conditions
- Adjust the Bollinger bands according to the width of the range
To determine the pivot points
- Pay attention to the divergence signals
- Use the "And" mode by combining divergences with other signals
- Check the RSI filter for additional confirmation
Mfi_divergence
RSI/MFI Divergence Finder [idahodev]Monitoring RSI (Relative Strength Index) and MFI (Money Flow Index) divergences on a stock or index chart offers several benefits to traders and analysts. Let's break down the advantages:
Comprehensive Market View: Combining both indicators provides a more complete picture of market conditions, as they measure different aspects of price movement. RSI focuses on recent gains/losses relative to price change, while MFI incorporates volume data to assess money flow in and out of a security.
Enhanced Signal Accuracy: When divergences occur simultaneously in both RSI and MFI, it may be considered a stronger signal than if only one indicator showed divergence. This can potentially lead to more reliable trading decisions.
Identification of False Breakouts: Divergences between these indicators and price action can help identify false breakouts or misleading price movements that are not supported by underlying market strength or volume.
More Nuanced Market Understanding: By examining divergent behavior between money flow (MFI) and momentum (RSI), traders gain a more detailed comprehension of the interplay between these factors in shaping market trends.
Early Warning Signs: These divergences can act as early warning signs for potential trend reversals or changes in market sentiment, allowing traders to adjust their strategies proactively.
It's important to note that RSI/MFI divergences should be used as part of a broader trading strategy rather than solely relying on them for buy/sell signals. They can serve as valuable tools for confirming trends, identifying potential turning points, or warning against overbought/oversold conditions.
When using these indicators together, traders must be cautious of false signals, especially in choppy markets or during periods of high volatility. It's crucial to combine this analysis with other technical and fundamental factors before making trading decisions.
In summary, monitoring RSI/MFI divergences may offer a way to gain insights into the underlying strengths and weaknesses of market movements.
This utility differs from other in that it allows for a choke/threshold/sensitivity setting to help weed out noisy signals. This needs to be carefully adjusted per chart.
It also allows for tuning of the MFI smoothing length (number of bars on the current chart) as well as how many previous bars it will take into consideration when calculating RSI and MFI divergences. It will signal when it sees alignment forming between RSI and MFI divergences in a direction. You will likely need to tune this script's settings every few days or at least anytime there is a change in overall market behavior or sustained volatility.
Ultimately, the goal with this script is to provide an additional level of confirmation of weakness or strength. It should be combined with other indicators such as exhaustion, pivots, supply/demand, trendline breaks or tests, and structure changes, to name a few complementary tools or strategies. It's not meant to be a standalone buy/sell signal indicator!
Here are some settings for futures that may help you get started:
ES (4m chart)
RSI Length: 26
MFI Length: 8
MFI Smoothing Length: 32
Divergence Sensitivity: 124
Left Bars for Pivot: 10
Right Bars for Pivot: 1
NQ (4m chart)
RSI Length: 14
MFI Length: 14
MFI Smoothing Length: 21
Divergence Sensitivity: 400
Left Bars for Pivot: 21
Right Bars for Pivot: 1
YM (4m chart)
RSI Length: 14
MFI Length: 14
MFI Smoothing Length: 21
Divergence Sensitivity: 810
Left Bars for Pivot: 33
Right Bars for Pivot: 1

EWO Breaking Bands & XTLElliott Wave Principle, developed by Ralph Nelson Elliott , proposes that the seemingly chaotic behaviour of the different financial markets isn’t actually chaotic. In fact the markets moves in predictable, repetitive cycles or waves and can be measured and forecast using Fibonacci numbers. These waves are a result of influence on investors from outside sources primarily the current psychology of the masses at that given time. Elliott wave predicts that the prices of the a traded currency pair will evolve in waves: five impulsive waves and three corrective waves. Impulsive waves give the main direction of the market expansion and the corrective waves are in the opposite direction (corrective wave occurrences and combination corrective wave occurrences are much higher comparing to impulsive waves)
The Elliott Wave Oscillator ( EWO ) helps identifying where you are in the 5 / 3 Elliott Waves , mainly the highest/lowest values of the oscillator might indicate a potential bullish / bearish Wave 3. Mathematically expressed, EWO is the difference between a 5 period and 35 period moving average. In this study instead 35-period, Fibonacci number 34 is implemented for the slow moving average and formula becomes ewo = sma (HL2, 5) - sma (HL2, 34)
The Elliott Wave Oscillator enables traders to track Elliott Wave counts and divergences. It allows traders to observe when an existing wave ends and when a new one begins. Included with the EWO are the breakout bands that help identify strong impulses.
The Expert Trend Locator ( XTL ) was developed by Tom Joseph (in his book Applying Technical Analysis) to identify major trends, similar to Elliott Wave 3 type swings.
Blue bars are bullish and indicate a potential upwards impulse.
Red bars are bearish and indicate a potential downwards impulse.
White bars indicate no trend is detected at the moment.
Added "TSI Arrows". The arrows is intended to help the viewer identify potential turning points. The presence of arrows indicates that the TSI indicator is either "curling" up under the signal line, or "curling" down over the signal line. This can help to anticipate reversals, or moves in favor of trend direction.

Kifier's MFI/STOCH Hidden Divergence/Trend BeaterMFI/STOCH Hidden Divergence/Trend Beater
General Idea:
My premise around this strategy was to make a general strategy for crypto that would help out with finding entry positions for when you’re bullish on a crypto and want to hold on for a while, and at the same time avoiding massive drops. Essentially a way to mix long term/ swing trading; I somewhat achieved my goal however it still requires a lot of logic tuning of the trend averages.
I’m a huge proponent of volume indicators and coupled with average closing price, I think this gives a really good idea of what is happening with the market. It gives an idea on the market and retail investor sentiment. This generally gives you logical entry positions (Although I don’t know how amazing that will work with all cryptos, there’s a fine line between a good strategy and one that just rides bubble market conditions, some would argue that’s still a success and others not)
How it works:
There are many components to the strategy that try to do different things:
First of all there are two types of entries, a MFI hidden divergence with a STOCH check, essentially it will only fire when a divergence is detected while STOCH is above 50%, however this might be changed in the future as due to the volatile nature of cryptos, the STOCH is not too effective. The second entry is a simple MFI/STOCH trend, if STOCH is above 50% and the trend is detected to be in a trending long, once a MFI crossover over the 50% line is detected an entry is placed, this is designed to get out profit where the divergence would otherwise be less accurate during strongly trending conditions.
-MFI is a great indicator, as a volume weighted momentum indicator I find it the most accurate of all, the STOCH however is a great indicator to get a general picture of simple market conditions and can filter out the emotional noise of retail investors.
-VWMA and an SMA (The bottom oscillator) gives an idea of the trend tacking into account of the volume, this serves as a more short term filter of the trend for filters.
-OBV checks are done between the OBV and an EMA of the OBV, to get the idea of a volume weighted long trend, which is important for crypto as there are massive rallies to go up due to retail greed, it’s great to jump onto it at the beginning, and get off before the stack of cards fall apart.
-ATR is used to detect when the market is relatively just ranging or moving sideways, which is where the hidden divergence entries are done, during predictable and profitable market conditions.
- Stop loss is based on the closest support of the entry, this is a nice medium of room to breath but also an actual stop loss.
Future plans and improvements:
Currently there’s a lot I want to improve, mostly the divergence detection and the overall sharpe ratio could be much better, but the current value of 0.5 gives me hope that the strategy is onto something. I also want to change TP from a percentage stop to something more dynamic but that might be too optimistic. The current plan is to paper trade test this either by manual or by a python bot, to see how it performs with some user input as well.

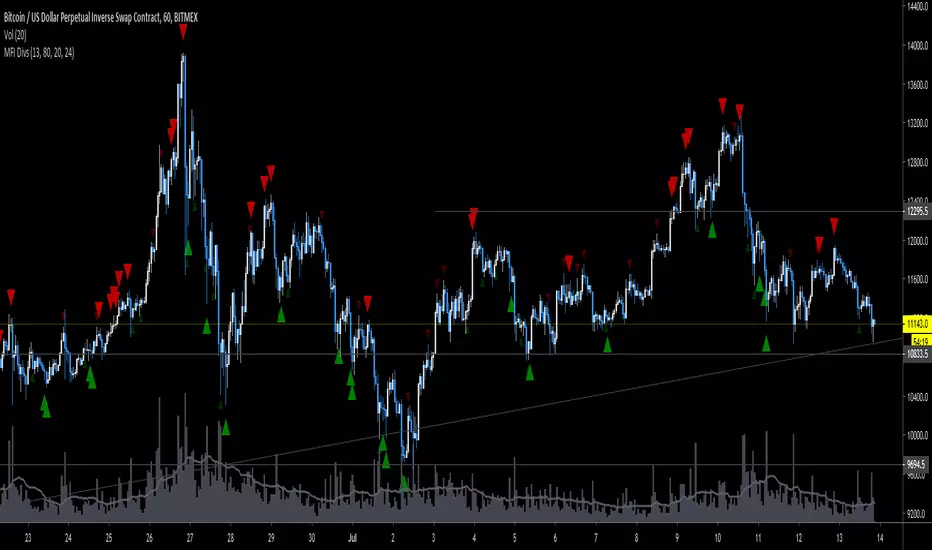
MFI Divergence v2Edited the RSI div indicator by Libertus to use MFI & show on candles. V2 update filters the divs using stochastic oversold & overbought & removes the lagging signals (they were offset back by 1 bar).
Default settings were tuned for xbtusd 1hr; works well if after a signal you wait for a stochastic indicator to stop being oversold or overbought, so if eg. you see a cluster of sell signals at a top, wait for the stoch to cross below 80 before entry. Please backtest before trading with this, DYOR NFA GLHF!

MFI DivergenceThis is an edit of the RSI divergence indicator by Libertus (thanks!). Play around with the settings, you'll want to tweak length & lookback per market & timeframe.
RSI/MFI - MTF - Entry signals/Trend colored bars - JD@version=2
This indicator is designed to give early entry signals as well as to follow trend moves, according to different settings.
The indicator shows a histogram of the RSI ro MFI in relation to an ema of the RSI or MFI.
The histogram is then smoothed to give early reversal/entry signals.
The actual RSI/MFI line with oversold/overbought indication can be displayed or omitted, as preferred.
in addition to the RSI/MFI line or as an alternative to it, the background colour can be set to change folowing the RSI/MFI signals.
The timeframe can be chosen. Higher timeframes (eg. 3h) tend to give less false signals.
version 5.
added support for custom Multiple Time Frame selection.
added option for choice of RSI or MFI as base indicator.
added option for price bar coloring according to the indicator. (deselecting "borders" in the "style" tab is recommended)
price bar coloring can be adjusted for different strategies:
1. following the slope of the histogram (for faster entry/exit signals)
2. according to positive or negative histogram (for longer moves)
3. according to pos. or neg. RSI/MFI (for longer term trend holds)
4. uptrend: biased towards faster buy signals and slower sell signals to stay in the uptrend
5. downtrend: biased towards faster sell signals and slower buy signals to stay in the downtrend
A longer timeframe (eg. 3x) is recommended for following trend moves.
try different strategies to see what works better for RSI or MFI.
JD.

Money Flow Index + AlertsThis study is based on the work of TV user Beasley Savage ( ) and all credit goes to them.
Changes I've made:
1. Added a visual symbol of an overbought/oversold threshold cross in the form of a red/green circle, respectively. Sometimes it can be hard to see when a cross actually occurs, and if your scaling isn't set up properly you can get misleading visuals. This way removes all doubt. Bear in mind they aren't meant as trading signals, so DO NOT use them as such. Research the MFI if you're unsure, but I use them as an early warning and that particular market/stock is added to my watchlist.
2. Added 60/40 lines as the MFI respects these incredibly well in trends. E.g. in a solid uptrend the MFI won't go below 40, and vice versa. Use the idea of support and resistance levels on the indicator and it'll be a great help. I've coloured the zones. Strong uptrends should stay above 60, strong downtrends should stay below 40. The zone in between 40-60 I've called the transition zone. MFI often stays here in consolidation periods, and in the last leg of a cycle/trend the MFI will often drop into this zone after being above 60 or below 40. This is a great sign that you should get out and start looking to reverse your position. Hopefully it helps to spot divergences as well.
3. Added alerts based on an overbought/oversold cross. Also added an alert for when either condition is triggered, so hopefully that's useful for those struggling with low alert limits. Feel free to change the overbought/oversold levels, the alerts + crossover visual are set to adapt.
Like any indicator, don't use this one alone. It works best paired with indicators/techniques that contradict it. You'll often see a OB/OS cross, and price will continue on it's way for many weeks more. But MFI is a great tool for identifying upcoming trend changes.
Any queries please comment or PM me.
Cheers,
RJR
