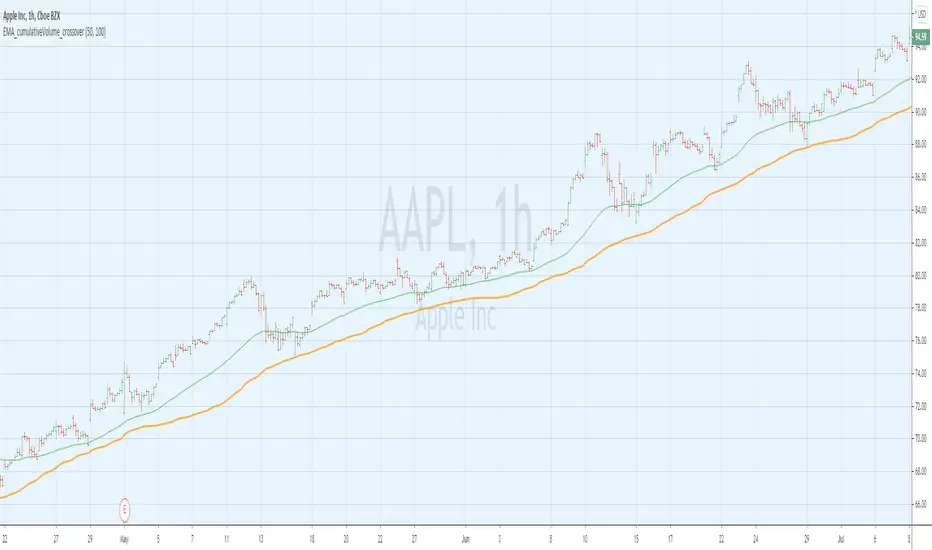
EMA_cumulativeVolume_crossover [indicator]while I was doing some research with exp MA crossovers and volume indicator , I have noticed that when ema 50 is above cumulative volume of 100 period , shows to capture nice profits in that trend. Shorting also (ema50 cross down volume of 100 period) also shows nice results.
BUY
When ema50 crossover cumulative volume of 100 period
Exit
When ema50 cross down cumulative volume of 100 period
Short Selling
Reverse above BUY conditions
Back ground color shows blue when ema50 is above cumulative volume of 100 period, shows purple when ema50 is below cumulative volume of 100 period
I will publish the strategy for back testing later today
Warning
For the use of educational purpose only
Mohanee
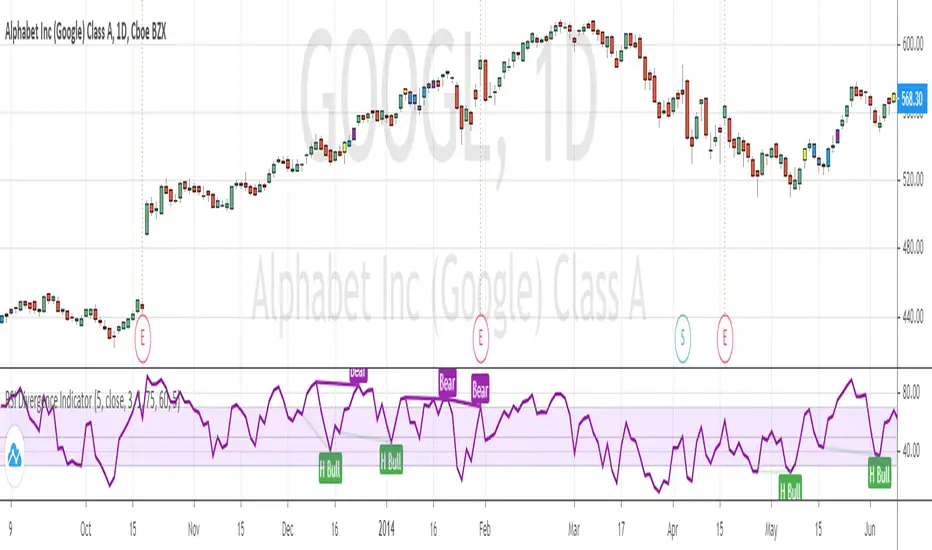
RSI Divergence Indicator (with alerts)Many have requested me for indicator version with alerts for the RSI Divergence strategy. Here is the one ...
Please note alert triggers in delay by number of bars defined in the settings. (same as strategy) ...
Bar color also changes when alert triggers ...
Yellow Bar shows BUY
Purple Bar shows EXIT ( Exit the Long position ... NO SHORTing )
On each Yellow Bar can be added to existing position
On each Purple Bar , exit partial position OR exit the whole position
Appreciate your feedback.
Warning
Use for education purpose only ...
RSI V Pattern IndicatorThis is the indicator version of RSI V Pattern strategy
alertconditions added.
Note: This beta version , I still need to fix the color for the Exit when trade is not in Long ...
