Rahul Prakash's BUY/SELL signal for momentum tradeBuy or Sell signal with just on one confirmation candle.
Show a Buy singal then wait for the confirmation candle, is a strong Buy signal.
Show a Sell singal then wait for the confirmation candle, is a strong Sell signal.
You can use as a free version and earn money. Please are taking lots of price for this type of indicator.
Momentumtrade

TriTrend Nexus[BullByte]TriTrend Nexus is a comprehensive market analysis tool that consolidates three well-established signals into a single, easy-to-read interface. It is designed to help traders quickly assess the market’s current condition and make more informed decisions about potential trend shifts.
Key Features and Functionality
Composite Signal System
Multi-Faceted Approach :
The indicator combines insights from three distinct market signals into one composite score. This approach provides a more holistic view of market conditions compared to relying on a single indicator.
Clear Classification :
Based on the composite score, TriTrend Nexus categorizes the market into:
Strong Signals : When all three underlying conditions are met, indicating a robust and established trend.
Early Signals : When two out of the three conditions are met, offering an early hint of a potential trend.
Neutral/Choppy : When conditions are ambiguous or conflicting, suggesting a lack of clear market direction.
Trend Qualifiers :
In addition to the composite score, the indicator subtly refines its signal by noting whether a trend is “Rising” or “Fading.” This further aids traders in understanding the momentum behind the signal.
Dynamic Signal Identification
Timely Alerts :
By analyzing the composite data in real time, the indicator quickly identifies when market conditions shift, offering early warning signals that help traders stay ahead of the market.
Adaptive Analysis :
The built-in signal assessment continuously monitors market changes. Whether the market is in the early stages of a move or firmly committed to a trend, TriTrend Nexus adapts its messaging to reflect the evolving conditions.
User-Friendly Dashboard
Integrated Display :
A customizable dashboard provides an at-a-glance summary of key metrics. Users can choose between a detailed view for comprehensive insights or a compact version for a streamlined experience.
Key Metrics Displayed :
Primary Signal : The overall market status, such as “Bullish Strong” or “Bearish Early.”
Composite Nexus Score : A numerical value representing the strength of the current market conditions.
Supporting Data : Essential values that help explain the current signal without overwhelming the trader.
Easy Interpretation :
The dashboard is designed with clarity in mind. Clear labeling and a consistent layout ensure that even traders new to composite indicators can quickly interpret the displayed information.
Visual Clarity and Aesthetic
Color-Coded Signals :
The indicator uses a vibrant color scheme to highlight market conditions:
Bright Green : Signifies a strong bullish trend.
Light Green : Indicates an emerging bullish trend.
Red : Represents a strong bearish trend.
Light Red/Pink : Denotes an early bearish signal.
Gray : Used when market conditions are neutral or choppy.
Graphical Enhancements :
The plotted oscillator visually reinforces the signal classifications with dynamic color transitions. Horizontal markers provide reference points to help traders easily compare the current readings against standard levels.
Customization Options
Adjustable Settings :
Traders can personalize the indicator by modifying input settings such as sensitivity thresholds and period lengths. This flexibility allows the tool to adapt to different market environments and trading styles.
Dashboard Flexibility :
The option to toggle between a full dashboard and a shorter version means that both novice and experienced traders can configure the display to best suit their needs. A more detailed dashboard offers extensive insights, while the compact mode provides a minimalist view for those who prefer simplicity.
Tailored User Experience :
With multiple adjustable parameters, users can fine-tune the indicator to respond precisely to their preferred timeframes and market conditions. This adaptability makes TriTrend Nexus a versatile tool for various trading strategies.
Benefits for Traders
Quick and Informed Decision-Making :
With a single glance at the dashboard and visual cues from the oscillator, traders can quickly gauge whether the market is poised for a strong move, is in the early stages of a trend, or is too volatile for clear signals. This helps in planning timely entries and exits.
Enhanced Market Insight :
By integrating multiple perspectives into one coherent score, the indicator filters out market noise and highlights the prevailing trend more reliably. This can be particularly useful during periods of market uncertainty.
Reduced Analysis Time:
The combination of clear, color-coded signals and an intuitive dashboard reduces the time spent analyzing various individual indicators, allowing traders to focus more on strategy execution.
Customization for Diverse Strategies :
The ability to adjust various input parameters and the dashboard layout ensures that traders can tailor the tool to fit their unique analysis style and market conditions, making it a versatile addition to any trading toolkit.
User-Friendly Interface :
Even for those who are not technically inclined, the clear visual design and straightforward signal descriptions make it easy to understand the current market situation without needing to interpret complex data.

Trend SuggestionsThis brings together a number of variables to produce trend predictions that could be utilized as decision-making tools.
Uses the aforementioned price and volume derivatives
- A moving average and three weighted moving averages (WMA1, WMA2, WMA3)
- Super Trend Line (ST)
- Opening Range Breakout on Five Minutes, Resistance Bands Pocket pivots, support, and price volume
he Direction is determined by the High and Low Bands of WMAs and the Supertrend Line, which are used to determine the Upper and Lower Lines around the Price. When the price passes below the lower boundary of the band, a downtrend is said to have begun.
Similarly, for an uptrend, this continues until the price passes over the upper edge of the band. Teal for an uptrend and fuchsia for a downturn area shared by the band to identify the trend.
The first five minutes of the breakout lines have a tiny buffer augmentation of 11% applied to them.
Based on what has been observed, support and resistance zones have been somewhat changed from the figures that are often utilized (might work other markets as well)
The markings that may be seen are as follows:
- Blue Triangle indicates a pocket pivot with an upward bias;
- Maroon Triangle indicates a pocket pivot with a downward bias;
- Teal colored Diamonds indicate price upthrusts and potential trend confirmation locations, depending on success or failure.
- Similar backdrop color changes that look as vertical shading are also used to identify them.
- Fuchsia-colored diamonds indicate price declines and a potential trend, depending on whether it persists or fails.
- Dark green and maroon square boxes indicate potential price reversals in the support and resistance bands, respectively.
It goes without saying that this work is derived from numerous other open-source community initiatives.
Feel free to adjust anything you'd like, and we appreciate any feedback.

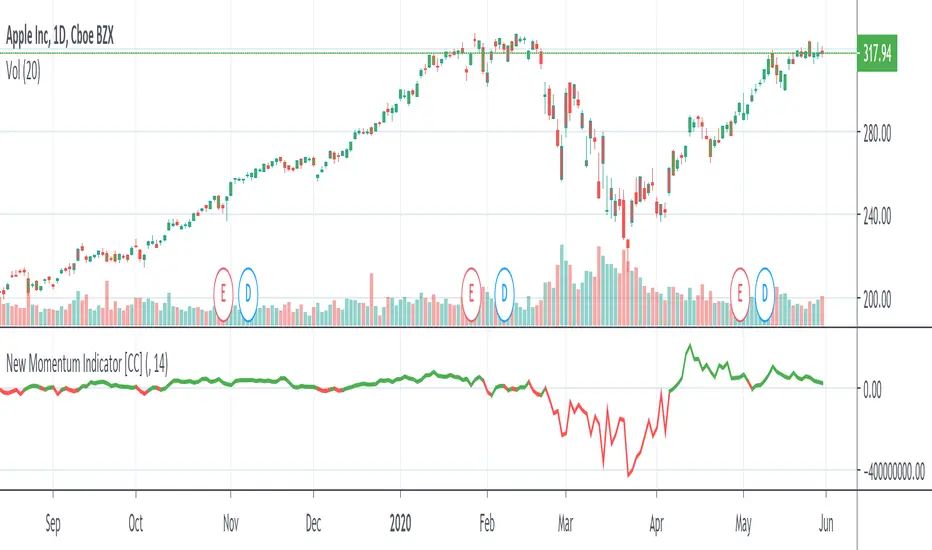
New Momentum IndicatorThe Momentum Indicator was created by Darryl W Maddox (Stocks & Commodities V. 9:4 (158-159)) and it is one of the simplest and most powerful indicators out there. Buy when the indicator goes over 0 and sell when it falls below 0
Let me know what other indicators you would like to see me write a script for!