RSI Value Table – match builtin🧭 Overview
“RSI Value Table – match builtin” displays the exact RSI value (identical to TradingView’s built-in RSI) for any selected timeframe — directly on your chart.
It’s designed for professional traders who need quick RSI confirmation without switching panels or opening multiple indicators.
⚙️ Core Logic
Reads RSI from any timeframe using request.security() with gaps_off and lookahead_off — ensuring a perfect match with the native RSI.
Optional EMA smoothing (non-standard) for visual stability.
Color-coded cell:
🟩 Green → RSI > 50 (bullish momentum)
🟥 Red → RSI < 50 (bearish momentum)
🟨 Yellow → Neutral zone around 50
Adjustable table position: top/bottom, left/right corners.
⚡ Alerts
Built-in alert conditions trigger automatically:
RSI > 50 → bullish momentum confirmation.
RSI < 50 → bearish momentum confirmation.
📈 How to Use
Select your preferred RSI timeframe (e.g., Daily, Weekly, 4H).
Watch the color-coded cell:
Green → trade long bias only.
Red → short bias only.
Ideal as a confirmation module for multi-timeframe systems or smart signal engines.
Mometum

Fibo Normalized RSI & RSI RibbonPlots both standard and Z-score normalized RSI ribbons using Fibonacci-based periods. Supports adjustable normalization, optional 0–100 scaling, and multi-line visualizations for momentum and deviation analysis.
This tool is designed for traders who want to go beyond standard RSI by adding:
Statistical normalization (Z-score)
Multi-period analysis (Fibonacci structure)
Advanced divergence and exhaustion detection
It gives you both classical momentum context and mathematically rigorous deviation insight, making it ideal for:
Swing traders
Quant-inclined discretionary traders
Multi-timeframe analysts
Trend Confirmation
When both RSI and normalized RSI across short and long periods are stacked in the same direction (e.g., above 50 or with high Z-scores), the trend is likely strong.
Disagreement between the two ribbons (e.g., RSI high but normalized RSI flat) may indicate late-stage trend or false strength.
Mean Reversion Trades
Look for normalized RSI values > +2 or < -2 (i.e., ~2 standard deviations).
Cross-check with standard RSI to see if the move aligns with a traditional overbought/oversold level.
Great for fade/reversal setups when Z-score RSI is extreme but classic RSI is just beginning to turn.
Divergence Detection
Compare the slope of RSI vs. normalized RSI over same period:
If RSI is rising but normalized RSI is falling → momentum is fading despite apparent strength.
Excellent for early warnings before reversals.
Multi-Timeframe Confluence
Use short-period ribbons (e.g., 3–13) for tactical entries/exits.
Use long-period ribbons (e.g., 55–233) for macro trend bias.
Alignment across both = high-confidence zone.

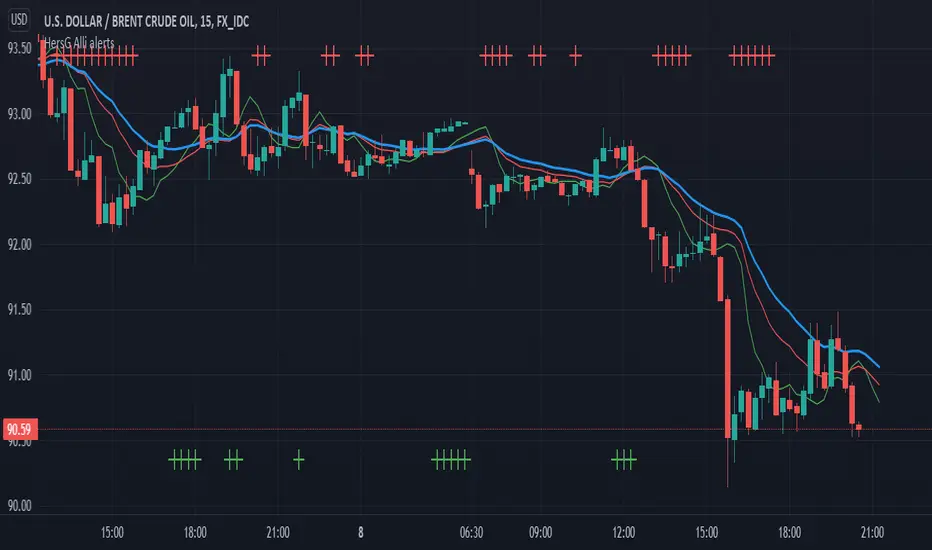
Alligator: Three signals confirmation with AlertsHello Trading Viewers,
The following is the William’s Alligator indicator with alerts indicating strong momentum, it can be used for scalping in lower time-frames or just riding the momentum in 1hr or 4hrs charts.
Input choices are:
1. Source of Data: Open, Low, High, Close, HL2, HLC3 and so on.
2. Simple and Exponential are the two choices of moving averages.
3. Lips, Teeth and Jaws input numbers are Fibonacci numbers with offsets from -4 to +4.
4. Up Momentum and Down Momentum signals will be plotted top and bottom of the charts respectively when conditions are met.
Idea used to confirm strong momentum
When (High + Low / 2) price is greater than Alligator’s Lips, Teeth, and Jaws, it is considered as a good time to go long; however, to strengthen the idea, the up-momentum condition needs to be approved three times consecutively. (Three consecutive candle bars should remain above Lips, Teeth, and Jaws to trigger an alert signal and plot Up- momentum shape on the charts)
The same idea with down-momentum, but the condition (High + Low / 2) price should be less than Alligator’s Lips, Teeth, and Jaws.
There is an alert set-up, once strong momentum is spotted it will send an alert once per bar close. You can relax and run an errand when the alert is not triggered.
Happy Trading!