1M / 3M / 6M / 12M Performance Box─────────────────────────────────────────────────────────────
1M / 3M / 6M / 12M Performance Box
─────────────────────────────────────────────────────────────
A compact on-chart dashboard that shows multi-horizon price performance
(1M / 3M / 6M / 12M) as percentage change, using DAILY data for consistency
across all chart timeframes (intraday, daily, weekly).
What it does
• Calculates % performance over 1, 3, 6, and 12 month horizons.
• Displays results in a clean table overlay on the chart.
• Automatically color-codes performance:
- Green = positive
- Red = negative
- Gray = neutral / not available
Month definition (user selectable)
• Calendar days mode:
1M = 30 days, 3M = 90 days, 6M = 180 days
• Trading days mode:
1M = 21 TD, 3M = 63 TD, 6M = 126 TD
• 12M is calculated as ~365 days in both modes.
Customization
• Table position (top/bottom + left/right)
• Decimal precision
• Fully customizable colors (header, labels, positive/negative/neutral cells)
• Adjustable background opacity
• Optional header with symbol + timeframe
Use cases
• Quick trend/context check before entries
• Relative strength snapshot across time horizons
• Cleaner decision-making without adding clutter
Notes
• Uses daily close/time via request.security() for stable results.
• Displays "n/a" when a reference value is not available.
─────────────────────────────────────────────────────────────
Monitor

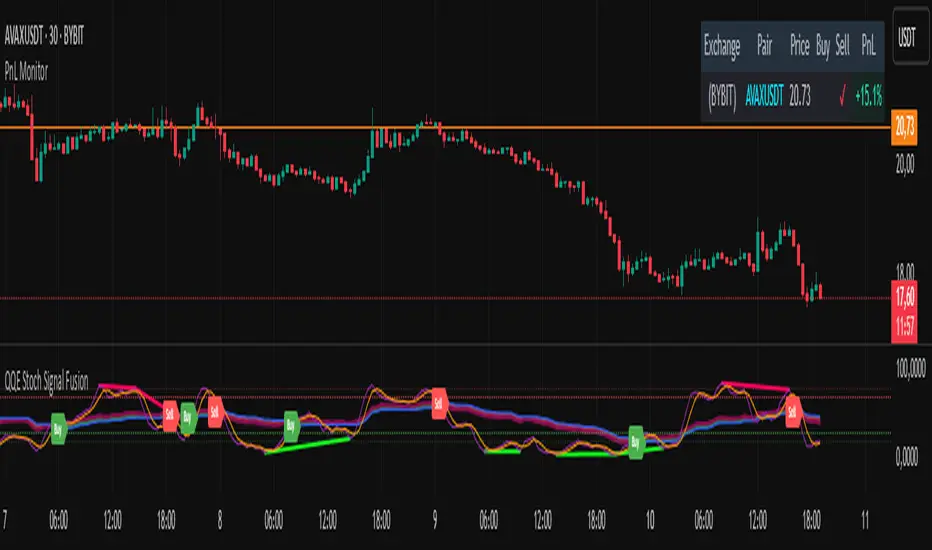
PnL MonitorThe PnL Monitor is a customizable tool designed to help traders track the Profit and Loss (PnL) of up to 20 currency pairs or assets in real-time. This script provides a clear and organized table that displays the entry price, and PnL percentage for each pair, making it an essential tool for monitoring open positions or tracking potential trades.
Key Features:
Multi-Asset Tracking:
Monitor up to 20 currency pairs or assets simultaneously. Simply input the pair symbol and your entry price, and the script will calculate the PnL in real-time.
Dynamic Table Positioning:
Choose where the table appears on your chart with the Table Position input. Options include:
Top Left
Top Right
Bottom Left
Bottom Right
Real-Time PnL Calculation:
The script fetches the current price of each pair and calculates the PnL percentage based on your entry price. Positive PnL is highlighted in green, while negative PnL is highlighted in red.
Exchange and Pair Separation:
The script automatically separates the exchange name (if provided) from the pair symbol, making it easier to identify the source of the data.
Customizable Inputs:
Add or remove pairs as needed.
Leave the price field blank for pairs you don’t want to track.
How to Use:
Input Your Pairs:
In the script settings, input the symbol of the pair (e.g., NASDAQ:AAPL or BTCUSD) and your entry price. Leave the price field blank for pairs you don’t want to track.
Choose Table Position:
Select where you want the table to appear on your chart.
Monitor PnL:
The table will automatically update with the current price and PnL percentage for each pair.
Why Use This Script?
Efficiency: Track multiple pairs in one place without switching charts.
Clarity: Easily identify profitable and losing positions at a glance.
Flexibility: Customize the table to fit your trading style and preferences.
Ideal For:
Forex, crypto, and stock traders managing multiple positions.
VIX Monitor [Zero54]NSE:BANKNIFTY1!
This is a simple but invaluable tool for both day traders and positional traders. VIX is about market expectations of volatility
The VIX is a very good and sound measure of risk in the markets. It gives these stock traders who are in intraday trading and short term traders an idea of whether the volatility is going up or going down in the market. They can calibrate their strategy accordingly. When the volatility is likely to shoot up sharply, the intraday traders run the risk of stop losses getting triggered quickly. Hence they can either reduce their leverage or they can widen their stop losses accordingly.
Also if you notice VIX is a very good and reliable gauge of index movement. If you plot the VIX and the Nifty movement you will see a clear negative correlation in the charts itself. Markets typically tend to peak out when the VIX is bottoming out and the markets tend to bottom out when the VIX is peaking out. This is a useful input for index trades.
You can use this simple indicator to monitor VIX real time. You can use it for short time frame intraday and also multi-hour, multi-day charts. You can also plot a moving average to gauge the VIX trend.
Also is the ability to monitor, Nifty and BankNifty the same way you are able to monitor the VIX (as explained above). The overall market moves in correlation with these main Indexes. So if you are trading a specific counter, you can also keep an eye on the index to get an idea where the counter may be going next.
The source code is open, please feel to modify or re-use as you feel it’s necessary. Any changes, improvements, bugs, please let me know.
Please like/boost this indicator and also add your comments, if you find it useful.

Divergences multi timeframeMT div monitor, add your own input for divs under expressions. Add them to the original bulldivs or beardivs with +. Set div_threshold in inputs.

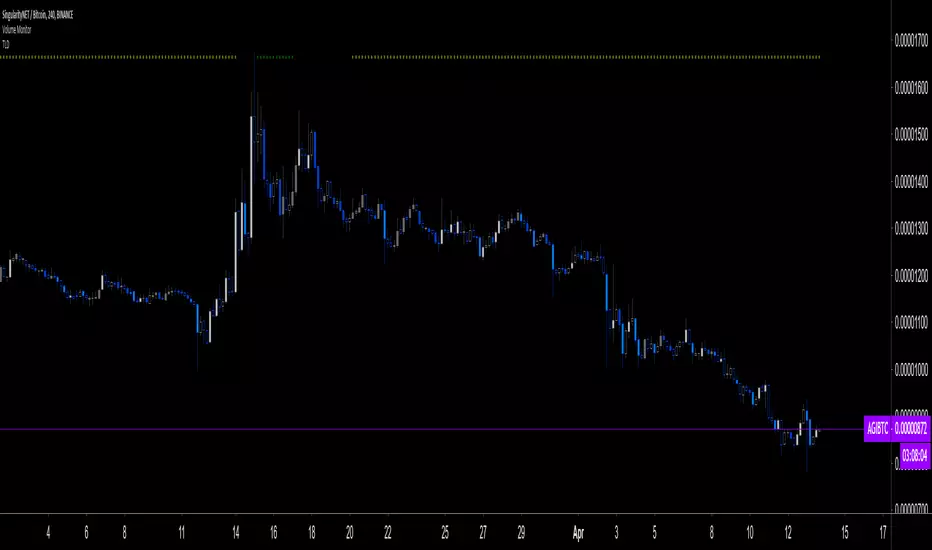
Volume Monitor In Quote Currency [LucF]Volume Monitor calculates the daily volume in the quote currency and displays a warning sign when that volume is below or above user-defined low and high limits.
For those not familiar with the term, quote currency refers to the second part of a trading pair such as EUR/USD or BNB/BTC.
One use for the indicator is for cryptos, where one who does not wish to trade low volume markets can rely on the indicator to flag them. The default values of 300 and 1000 for the low and high limits mean that when looking at XXXBTC charts, a yellow dot will appear on the chart when the daily volume of the market is lower than 300 BTC, and a green dot will appear when it is higher than 1000 BTC.
If your chart settings are configured to show indicator values, the first value shown by the indicator is the daily volume in the quote currency. It will be green or red, depending on the day’s price action. In order to show the value, an invisible plot must be printed on the chart and for it not to wreak havoc on the price, the indicator’s scale should be set to “No scale” (the default) or to a different one than the price’s scale.