day of Month | xilixMonthly Marker (1D Only)
The Monthly Marker indicator automatically highlights a specific day of the month on a daily (1D) chart by drawing a vertical line. Users can select their desired day of the month and customize the line color.
Features:
✅ Marks the chosen day of each month with a vertical line.
✅ Customizable line color (set in the indicator settings).
✅ Helps traders quickly identify key monthly dates.
Note: This indicator will not work on lower timeframes (e.g., 4H, 1H) and will show an error if applied outside the 1D timeframe.
Best Use Cases: Monthly trend tracking, economic event alignment, and custom date-based analysis. 🚀
Pivot Bulanan

Pivot Break [ProjeAdam]OVERVIEW
This indicator provides us great convenience when analyzing the parity by drawing a range at the highest, lowest and middle levels of the previous time period in the time period we choose, and showing where the price is currently in the range it has created in the past.
ALGORITHM - How does the indicator work ?
It draws the highest and lowest values in the time of the parity you selected in the previous ‘’Time Value’’ setting by creating a range.
We can change our ‘’Time Value’’ from the settings.
In the example above, we select our Time Value setting as "Monthly" and it draws the highest and lowest values of the month in the past parity.
In this example above, we select our Time Value setting as "Weekly", it captures the highest and lowest values of the price of the past week.
The algorithm automatically plots the selected Time Value of the price in the past.
When our price falls below its past value by the Time Value we selected, our background color becomes red.
In the example above, our background becomes red for places where the price has fallen below the values of the past week
When our price rises above its historical value by the Time Value we selected, our background color becomes green.
In the example above, our background is green for the places where the price breaks above last week's values.
When breaking up or down, our background color changes only at the first break and an alarm comes here.
The breakdowns in this indicator can also be used as an auxiliary tool in trend analysis.
While the price breaking the previous time frame up and holding there is a positive confirmation for the uptrend in the market, we can consider the price breaking the previous time frame down and holding here as a downtrend in the parity.
SETTINGS PANEL
1-We can change Language of Price Labels
2-We can choose the past time highest or lowest of our price with which we want to create a range
3-Show background of break up and break down
4-If we activeted buttons allow us to receive alarms in case of breakdown in these parities that we activate.
If you have any ideas what to add to my work to add more sources or make calculations cooler, suggest in DM .

Pivot Points with Monthly and Weekly optionsA pivot point indicator that has possibility to see even the monthly or the weekly pivot points .
Pivot points are very powerful if used in correct way.
most of the time the price can be rejected from the pivot point or if the price break it it will be a nice entry if retest the pivot
R2/S2 are a very strong pivots to break but of course you need a certain distance between the pivot

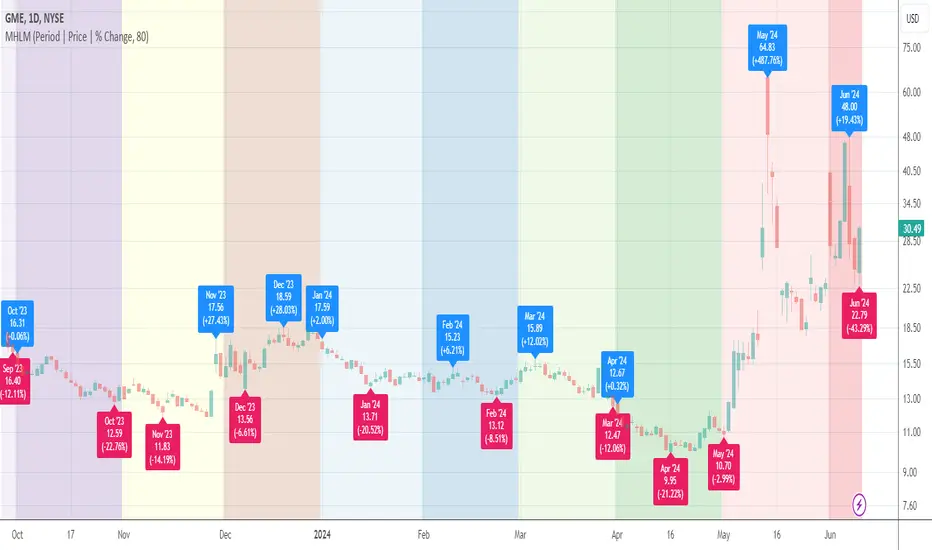
Monthly High/Low MarksThis utility tool marks the highest and the lowest price of each month on the chart. Works everywhere and doesn't use any calls of built-in functions which are used for a data extraction.
Labels provide additional information about closing price and % change for a particular month and allow micro customizations.
(JS) Multi-Time Frame Pivot Point Detector 2.0So here's an updated version of my automatic Pivot Point detector.
If you don't like having a bunch of Pivots on your chart at once, or having to cycle through various resolutions to see different ones, this is for you!
What does this indicator do? It automatically detects the nearest daily, weekly, and monthly pivot points both above and below the current price and automatically plots them for you. It's really just as simple as that.
You select how far back you want it to plot with the "Pivot Point Look Back Period" option.
I also have transparency options for each type of pivot so its easy to find the opacity you prefer and save it as a default setting.
With "Turn Off Each Pivot Point On All Time Frames" turned on, as an example, if you were to uncheck "S1/R1" then it turns S1/R1 plots off across all 3 pivot resolutions. By default however, I have it set where you can pick and choose each one individually.
I also added the default "VWAP Periodic" script from TradingView in there with it (not in prior version). This works identical to the built in indicator (because it is identical).
Trading algorithms like to target pivot points and liquidity, so I figured they would pair together nicely for active trading.

Pivot RSI - A trading strategy using Pivots Rel StrengthThis strategy uses a new concept called Relative Strength of Pivots.
The concept emanates from the fact that the market weakness starts from bottom to top when it comes to pivot as against top to bottom in conventional indicators.
It signals long if the daily pivot shows better strength than monthly pivots and short if the daily pivot shows weaker strength than monthly pivots.
The Strength of pivots is defined better if :
a) if relative strength of lower pivots are higher than higher pivots or crosses higher pivots.
b) if relative strength of lower pivots are sloping upwards and is above mid point (50).
This strength of pivots is combined with pivot shift indicator for additional confirmation which means that if pivot shift indicator is sloping upwards and the strength of pivots satisfies the above definition, then the long is signalled.
How to use this in trading?
The best way is to have this indicator along with the following
a) 50 period ema
b) 200 period ema
c) Daily CPR / Weekly pivot / monthly pivot (MUPS indicator preferred - Please refer to the same in public library)
d) Pivot Shift Indicator (IndianPivotBossPivotShiftIndicator - Please refer to the same in public library)
When a long is signalled, ensure that there are no immediate nearby resistances in the form of EMAs or Pivots. Similarly when a short is signalled, ensure that there are no immediate nearby supports in the form of EMAs or Pivots.
In other words when a long is signalled and if there is a nearby resistance, just wait for the resistance to break convincingly before going long and vice versa for shorts.
In general a blue color indicates that the strength of daily pivot is better alongwith a bullish pivotshift which facilitates a possible long and HENCE STRICTLY SHOULD NOT BE ON THE SHORT SIDE.
In general a red color indicates that the strength of daily pivot is better alongwith a bearish pivotshift which facilitates a possible short and HENCE STRICTLY SHOULD NOT BE ON THE LONG SIDE.
Please ensure that you use this with a proper Risk Management and Money Management guidelines.

Neru_MultiPivots_ForDarkThemeNeru_MultiPivots_ForDarkTheme
________________________________
This script is plotting the classic PivotPoints into the charts, two for each interval.
These Pivots are adjusting automatically when you change the interval.
The following are supported:
1, 3, 5, 15: H4 Pivots R5-S5
5, 15, 30, 60, H2: Daily Pivots R5-S5
30, 60, H2, H3, H4, H6: Weekly Pivots R4-S4
H3, H4, H6, D: Monthly Pivots R3-S3
D, 2D, 3D, W, 2W: Quarterly Pivots R3-S3
2D, 3D, W, 2W, M, 3M: Yearly Pivots R2-S2
You cannot change these settings, but disable them seperately.
This is a universal indicator and appropriate to use in any market, due to the fact classic calculations are used.
Additional: You are able to set alerts onto single Pivots OR an entire interval.
There is also a version for light themes: Neru_MultiPivots_ForLightTheme (simply search in indicator´s library)
_________________________________
Warm regards,
Neru

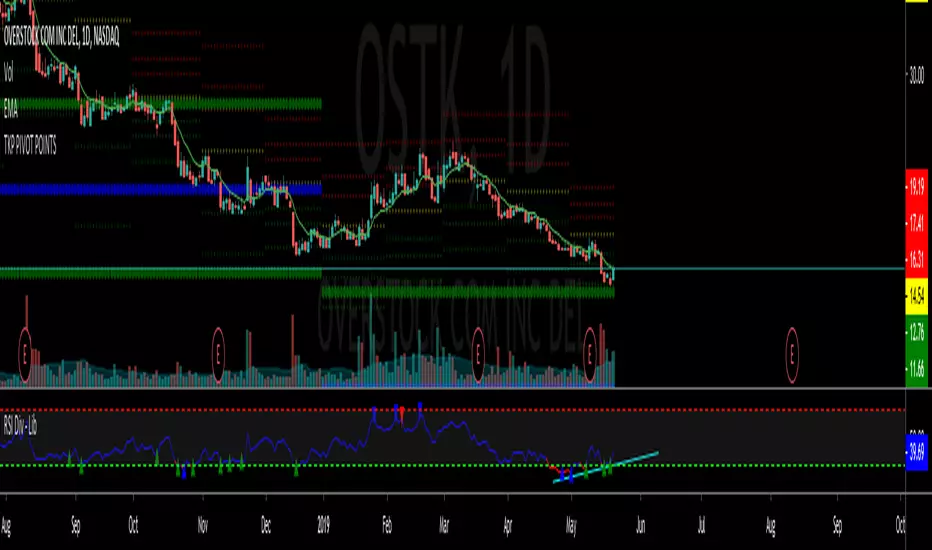
TKP Weekly, Monthly and Yearly Fib Pivot PointsThis script allows you to plot Weekly, Monthly and Yearly Fibonacci Pivot Points. I used templates from others I found on TradingView, special thanks given in the Script. I prefer Longer time frames, especially yearly Pivots, to predict reversals and places to trim risk, so this was tailored to my needs. Hope this helps!
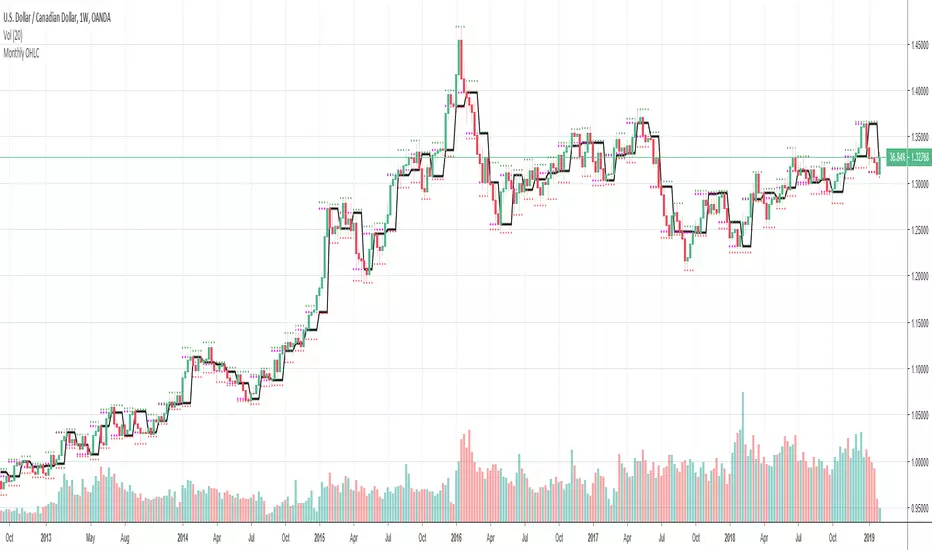
Monthly OHLCThis indicator displays the monthly Open, High, Low and Close price on a chart.
Very helpful indicator for starting your trading week (I use it every week in FOREX, Crypto, and Equities).
In conjunction using this on the Weekly & Daily timerfame with a 200, 10 and 5 EMA you can start your week off with a probable bull or bear bias.