AI Intraday Astra by Pooja v27📘 AI Intraday Astra v27
Invite-Only Intraday Indicator for Option Traders
🔍 What this indicator does (Purpose)
AI Intraday Astra v27 is a rule-based intraday signal-filtering indicator designed to reduce false breakouts, repeated entries, and low-energy trades commonly faced by option traders.
Unlike traditional indicators that generate frequent signals, this script focuses on signal validation and rejection, producing trades only when multiple market conditions align on the same confirmed candle.
⭐ What makes this indicator ORIGINAL
This script is not a simple combination of indicators.
It uses a state-based decision architecture, where signals are allowed only after passing multiple sequential checks and internal reset rules.
Key originality points:
Independent BUY and SELL engines (no shared oscillator state)
State tracking to control signal eligibility
Reset-based logic after every signal
Multi-layer filtering instead of single-condition triggers
This design differentiates it from standard RSI, EMA, or Supertrend-based scripts.
⚙️ Core Features (Explained Clearly)
🔹 Auto BUY / SELL Signals (Confirmed Only)
Signals trigger only after candle close and only when all filters align.
No intrabar repainting or blinking signals.
🔹 Dual RSI Engine (Buy & Sell Separation)
Separate RSI + RSI-MA logic for Buy and Sell
Minimum RSI-MA distance filter
Directional slope validation
Signal gap control
➡️ Prevents mixed or weak momentum signals.
🔹 ADX + ATR Volatility Filter
ADX confirms directional strength
ATR confirms sufficient intraday volatility
➡️ Blocks signals during sideways or low-energy markets.
🔹 EMA + VWAP Trend Alignment
BUY only above EMA & VWAP
SELL only below EMA & VWAP
➡️ Avoids counter-trend option entries.
🔹 Trendline-Based Structure Filter
Dynamic trendlines derived from swing highs/lows
Optional slope modes (ATR / Stdev / Linear Regression)
Signals allowed only near relevant structure
➡️ Prevents chasing overextended prices.
🔹 Pivot Points (Support & Resistance Context)
Traditional pivot levels
Multi-timeframe calculation
Optional price labels
➡️ Used for context, not direct signal generation.
🔹 Reset & Anti-Overtrading Logic
After a signal:
Price must break and re-accept across EMA
Minimum bars enforced between same-side signals
➡️ Controls over-trading in strong trends.
🔹 Session Filter
Optional disabling of signals during selected intraday time windows
(e.g. noisy market open).
🧠 About “AI”
This script does not use machine learning or prediction models.
“AI” refers to a rule-based decision system that evaluates multiple market conditions together and allows a signal only when all rules remain valid until candle close.
🔔 Alerts
BUY / SELL alerts on confirmed signals only
Webhook-compatible
No repaint behavior
👤 Who this is for
Intraday option traders
Traders who prefer quality over quantity
Rule-based and confirmation-driven setups
🔒 Why Invite-Only
The script contains internal state management, reset logic, and independent signal engines that go beyond standard indicator combinations.
Source access is restricted to protect this implementation.
⚠️ Disclaimer
This indicator is for educational and analytical purposes only.
It does not provide financial advice or profit guarantees.
Users are responsible for their own risk management.
Moving Averages

Whale Trading Network Technical Indicator
Whale Trading Network — Technical Indicator (WTN)
What it does — signal families
WTN produces three signal types across three user‑selected timeframes: (1) Green : bottom setup candidates, (2) Gold : continuation confirmations, and (3) Red : early top warnings. It blends momentum with trend/structure context and suppresses prints during sustained downtrends or late‑stage rallies. Defaults target 4h, 1d, and 5d workflows.
Preamble — originality and invite‑only context
WTN is a controller‑driven, regime‑aware indicator that coordinates classic elements (RSI, MACD, Stochastic RSI, MAs, BBs) into a governed signal layer rather than a simple overlay. A latched Down‑Channel regime, a Top‑Zone swing gate, cross‑asset/timeframe normalization, confluence‑based dot permissions, and multi‑timeframe orchestration (gold‑only on the highest frame) work together to actively manage when signals are allowed. The sections below explain why this is not a mashup and why the closed‑source / vendor value resides in WTN’s state‑machine logic, interlock rules, normalization framework, and cross‑frame roles—presented at the concept level so traders and moderators can understand how it operates without exposing proprietary thresholds.
Why it’s not a simple mashup (originality & usefulness)
WTN is not a bundle of classic tools; it is a controller‑driven indicator with regime awareness, gating, and normalization that coordinates otherwise independent signals into a single, coherent decision layer. Instead of overlaying RSI + MACD + BB + MAs, WTN governs when those tools matter, how long their states persist, and when prints must be blocked—using rules a basic mashup does not provide.
What the controller actually governs
Identifies and latches regimes (e.g., sustained down‑channel) so print permissions change with context—not just oscillator ticks.
Applies gates (e.g., Top‑Zone) when swing positioning suggests late‑stage risk.
Normalizes and weights evidence so MACD, RSI, Stoch RSI, histogram behavior, and price context contribute coherently.
Coordinates timeframes so dots form a workflow (tactical → swing → continuation) rather than three unrelated overlays.
Regime awareness & hysteresis (stability by design)
A core source of originality is hysteresis : once WTN recognizes a down‑channel, it latches that regime and suppresses prints until persistent breakout evidence plus momentum stabilization appear. This prevents flip‑flopping during chop, “first‑bounce” head fakes, and lower‑high rallies that a simple overlay will often misclassify. The regime state is visible (tinted panel), so users know why signals are paused.
Context gates that actively refuse bad timing
Two key context gates reduce “chase‑the‑top” and “bottom‑fish” problems:
Down‑Channel Latch: Blocks bottom candidates while momentum/structure remain impaired, then re‑enables only after sustained improvement.
Top‑Zone Gate: Detects upper‑swing positioning with momentum decay and blocks prints until positioning resets, avoiding confirmations into exhaustion.
Normalization that makes confluence real
Classic indicators have incompatible scales that vary across assets and timeframes. WTN normalizes them:
MACD line/signal/histogram, RSI, and Stoch RSI are mapped to consistent ranges so slope tests and region checks are comparable.
This lets confluence be meaningful : no single tool dominates due to scale; each contributes proportionally to permissions.
Multi‑timeframe orchestration (coordinated, not duplicated)
WTN assigns roles across the three selected timeframes:
Shorter timeframe: Tactical green setups (higher risk), ideally validated by gold .
Middle timeframe: Swing validation with more selective gold .
Highest timeframe: Gold‑only continuation, prioritizing higher‑confidence confirmation.
On lower frames, gold requires a prior green ; on the highest frame, green never prints . This structure turns dots into a sequence rather than three independent overlays.
Permission lattice & precedence (how conflicts are resolved)
Signals must pass a permission lattice where evidence sources interlock:
Momentum alignment: MACD slope and histogram behavior must agree; a single crossover is not enough.
Oscillator state: RSI/Stoch RSI must be supportive (e.g., stabilization from weak zones for a bottom candidate).
Structure & volatility context: MA stack, BB basis/width, and ATR‑aware checks help confirm or veto timing.
Regime/gate status: Down‑Channel or Top‑Zone states can override otherwise bullish micro‑signals.
Precedence rules mean a strong veto (e.g., active latch) can inhibit a print even if oscillators briefly improve.
Debounce, persistence & resumption (time matters)
WTN emphasizes persistence windows and debounce behavior:
Breakouts must persist (not one‑bar spikes) before the latch releases.
Oscillator stabilization must sustain before green candidates are permitted.
Continuations ( gold ) require maintained alignment , not transient ticks, so you avoid prints on single‑bar noise.
Failure modes addressed by the controller
RSI oversold during falling MACD: Basic mashups flag “bottom”; WTN keeps the latch until histogram and RSI recover together .
Momentum crossover inside the Top‑Zone: Overlays confirm continuation; WTN blocks until price resets out of the upper swing.
Event‑driven spikes (gap/volatility bursts): Transient improvements are debounced ; permissions wait for sustained evidence.
Indicator scale drift across assets/timeframes: Normalization ensures confluence rules remain consistent when you switch symbols.
Interpretability: see the “why,” not just the “what”
WTN’s pane is structured for auditability :
Tinted background exposes regime state (e.g., down‑channel latch).
Histogram anchored at 0 , RSI in the upper sub‑pane (0–100), Stoch RSI in the lower sub‑pane (−100–0) with clear overbought/oversold coloring.
Traders can visually trace the permission path: regime → positioning → momentum → oscillator → dot allowed/blocked.
Bottom line: WTN’s originality lives in the controller, regime latch, context gates, normalization, permission lattice, and timeframe orchestration that actively manage when a print is allowed. It is a coordinated decision system—not a simple overlay of classic indicators—and that governance is the reason it adds practical value for traders.
Why closed‑source / vendor value
WTN is powered by a proprietary engine written from the ground up in Pine v6; the source does not reuse any third‑party open‑source code. Its originality lies in the controller architecture and interlock logic that govern regime detection, context gates, normalization, and cross‑frame coordination. While it reads familiar elements (RSI, MACD, Stochastic RSI, MAs, BBs), the value comes from how those elements are orchestrated—state‑machine gating with hysteresis, context‑aware suppression and resumption, normalized confluence tests, and gold‑only continuation on the highest timeframe—yielding behavior that is not achievable by simply overlaying built‑ins.
What is original (and protected)
State‑machine gating: Rules define regimes, transitions, hysteresis, and re‑enable conditions across evidence sources (momentum slope, histogram decay/recovery, oscillator zones, MA/BB context).
Permission graph & interlocks: RSI, MACD (line/signal/histogram), Stoch RSI, price‑structure gates, and MA/BB context vote together through precedence rules—this coordination is proprietary.
Normalization framework: Mapping and using normalized ranges for momentum/oscillators to make confluence tests stable across assets/timeframes is a deliberate design central to WTN’s consistency.
Multi‑timeframe controller roles: Gold‑only behavior on the highest timeframe and the green‑precedence rule on lower frames are coordinated workflows specific to WTN.
Context‑aware suppression/resumption: Suppressing dots during down‑channels and top‑zones, then resuming only on verified persistence, reduces “false‑print drift” common to naive mashups.
Why protection is appropriate
Not reproducible through overlays: While anyone can overlay RSI, MACD, and BBs, WTN’s controller decisions (state transitions, permission checks, persistence windows, evidence requirements) are not trivially inferred from outputs and are central to its behavior.
Integrity of the workflow: Protection preserves a single, tested implementation so users do not encounter fragmented clones with altered rules that undermine the controller’s intent.
Ongoing calibration: Profiles for Crypto vs. Stocks (across three timeframes each) are curated to typical volatility traits. Maintaining these calibrations and the permission graph is part of the product’s vendor value.
What traders get (concept level, not black‑box hype)
Regime‑aware signals: Fewer prints into multi‑leg downtrends or late‑stage tops because the system explicitly refuses to signal in those contexts.
Consistent confluence: Normalization makes cross‑asset/timeframe confluence checks meaningful; users aren’t whipsawed by indicator scale differences.
Coherent workflow: Green → Gold on tactical frames, Gold‑only on the highest frame for continuation—an interpretable sequence that is easy to audit on the pane.
Transparent context: Tinted backgrounds and sub‑pane organization show why a dot was allowed or blocked (regime, swing position, oscillator state), letting traders understand how the script does what it claims—without exposing proprietary thresholds.
How it works — components & flow (concept level)
1) Normalized momentum & context
WTN reads RSI , MACD (line, signal, histogram), Stochastic RSI , ATR‑aware volatility , moving averages , Bollinger Bands , and price‑structure gates . Internals normalize oscillator values to a common pane so slopes, threshold checks, and histogram behavior are comparable across assets and timeframes. The histogram remains centered on 0, RSI uses 0–100 in the upper sub‑pane, and Stoch RSI maps to the lower sub‑pane.
Conceptual effect:
Normalization mitigates asset‑specific amplitude differences (e.g., MACD’s variable scale) so confluence tests don’t break when you switch symbols/timeframes.
Visual cues (line colors for overbought/oversold) make state changes obvious.
2) Regime detection — Down‑Channel Latch
Synchronized evidence (weak MA stack, negative momentum slope, fading histogram, RSI/Stoch RSI weak zones, price‑structure traits) latches the down‑channel regime. When latched, green prints are suppressed . The latch releases only after breakout persistence and improvements in RSI/histogram confirm trend resumption. The panel tints red while latched.
Design intent: Cut bottom‑fishing noise during multi‑leg downtrends, then resume prints only after sustained recovery.
3) Swing‑positioning — Top‑Zone Gate
A “top‑zone” derived from recent swing bounds with BB/Fibonacci context and momentum checks blocks new prints when price is in the upper swing and momentum decays, reducing confirmations into exhaustion.
4) Dot permissions (confluence gating)
WTN coordinates RSI, MACD, Stoch RSI, histogram behavior, SMA/BB context , and regime gates to determine whether a dot is allowed:
Green (bottom setup): Requires momentum deceleration with histogram improvement, RSI stabilizing upward, and price firming vs recent closes. Suppressed in Down‑Channel latch or Top‑Zone gate.
Gold (continuation): On lower two timeframes, prints only after a prior green and requires aligned momentum/oscillator states and supportive price context; on the highest timeframe, gold‑only prints emphasize higher‑confidence continuation cues.
Red (early top warning): Requires synchronized local peaks/roll‑downs across oscillators with slowing histogram; blocked in specific exhaustion conditions to avoid warnings into capitulation.
5) Multi‑timeframe controller
A controller aligns permissions across the three selected timeframes . Shorter frames provide tactical entries; the middle frame favors swing setups; the highest frame prints gold‑only for major continuation confirmation. Signals are coordinated, not independent overlays.
How to use it
Choose timeframes: Defaults target 4h / 1d / 5d . Use the shorter frame to spot tactical green ; wait for gold on the same or higher frame to confirm. Use the middle frame for swing validation. The highest frame is gold‑only , helping avoid early greens during broader trends.
Watch the tint: A red background band denotes the Down‑Channel latch ; expect suppressed greens until breakout persistence and momentum improvement.
Read the panel: The pane shows normalized momentum (MACD, histogram) with RSI up top and Stoch RSI below, including clear overbought/oversold coloring.
Confirm, then manage exposure: Treat green → gold as the preferred sequence. MA/BB context helps gauge trend strength (e.g., price vs 50/100/200 SMA and BB basis). Greens are higher‑risk; favor gold confirmations.
Crypto vs Stocks — calibrated profiles
Profiles are tuned for typical volatility patterns in each asset class. Each timeframe has its own calibration, yielding six independent tuning sections (3 per asset class).
Screenshots — captions
Screenshot 1 — Down‑Channel latch & release
The red‑tinted band shows the Down‑Channel latch regime on the indicator pane. While latched, green prints are suppressed . The latch only releases after breakout persistence and momentum improvement are visible (MACD/histogram strengthening with RSI and Stochastic RSI stabilizing). Once released, if the Top‑Zone gate is open and price context is supportive, the controller may permit a green dot on the lower timeframes, followed by a gold confirmation when conditions remain aligned.
Screenshot 2 — Pane layout & normalization
The indicator pane is organized for quick audit: the histogram is centered on 0 ; RSI plots in the upper sub‑pane on a 0–100 range; Stochastic RSI plots in the lower sub‑pane on a −100 to 0 normalized range. MACD line/signal/histogram and oscillators are normalized so slope checks, region tests, and confluence are comparable across symbols/timeframes. Line colors reflect overbought/oversold states to make regime/context changes easy to read.
Screenshot 3 — Adaptive dot permissions (sequence example)
This sequence shows adaptive dot permissions at work. After breakout persistence from a latched down‑channel, the controller permits a gold dot on the 5‑day view to confirm continuation (the highest timeframe uses gold‑only ). Soon after, the Top‑Zone gate engages, momentum slows (RSI/Stochastic RSI roll down, histogram decays), and a red dot warns of an early top. If deterioration persists, the Down‑Channel re‑latches and prints remain suppressed until the next verified recovery.
Limits & notes
100% original work: The WTN engine and controller logic are programmed from the ground up. No third‑party open‑source code, educational snippets, or auto‑generated code are reused.
No external libraries: Built in Pine v6 using standard language features only; no external libraries or ports of community scripts are used.
Chart type: Designed for standard time‑based candles only; non‑standard charts (Heikin Ashi, Renko, Kagi, P&F, Range) can produce unrealistic results.
Data handling: No lookahead and no future offsets.
Risk disclosure & legal notice
This tool is provided for educational purposes only and does not constitute financial or investment advice or recommendations.
Trading and investing involve risk, including possible loss of principal.
No guarantees or warranties of performance are expressed or implied. Past results do not predict future outcomes.
This publication does not include solicitation, pricing, or promotional offers; it provides information on the indicator’s design and use.
Use at your own risk. Test settings on paper and consult a qualified investment professional familiar with your risk tolerance before any live use.

AI Reversal Signals Custom [wjdtks255]📊 Indicator Overview: AI Reversal Signals Custom
This indicator is a comprehensive trend-following and reversal detection tool. It combines the long-term trend bias of a 200 EMA with highly sensitive RSI-based reversal signals and momentum visualization. It is designed to capture market bottoms and tops by identifying exhaustion points in price action.
Key Features
200 EMA (Trend Filter): A gold line representing the long-term institutional trend. It helps traders distinguish between "buying the dip" and "catching a falling knife."
Reversal Buy/Sell Labels: Real-time signals that appear when the market recovers from extreme overbought or oversold conditions.
Dynamic Background Clouds: Visual indicators of trend strength changes, highlighting potential entry zones.
Momentum Histogram: Internal calculations mimic the "Bottom Bars" seen in professional suites to track the velocity of price movement.
📈 Trading Strategy (How to Trade)
1. High-Probability Long Setup (Buy)
Trend Confirmation: Price should ideally be trading above the 200 EMA for the highest success rate.
Signal: Wait for the "BUY" label to appear below the candle.
Momentum: Confirm with the Light Green background or histogram shift indicating recovery.
Entry: Enter on the close of the signal candle.
2. High-Probability Short Setup (Sell)
Trend Confirmation: Price should ideally be trading below the 200 EMA.
Signal: Wait for the "SELL" label to appear above the candle.
Momentum: Confirm with the Red background or histogram fading from green to red.
Entry: Enter on the close of the signal candle.
3. Risk Management
Stop Loss: Place your Stop Loss slightly below the recent swing low for Buy orders, or above the recent swing high for Sell orders.
Take Profit: Exit when the price reaches a major support/resistance level or when an opposing signal appears.
💡 Professional Tip
For the best results, use this indicator on the 15-minute or 1-hour timeframes. The most powerful "Ultimate Reversal" signals occur when there is a Bullish Divergence (Price making lower lows while the RSI makes higher lows) followed by a confirmed "BUY" label.


NTA MTF Context Pro🔹 NTA – MTF Context Pro
Multi-Timeframe Market Context & Institutional Bias Panel
📌 Overview
NTA – MTF Context Pro is a public, closed-source multi-timeframe market context indicator designed to help traders objectively evaluate directional bias, trend quality, and market conditions across multiple higher and lower timeframes from a single panel.
This indicator does not generate trade entries or signals.
Its purpose is to provide context, confirmation, and environmental filtering prior to executing trades with an external strategy or execution model.
🧠 Methodology & Conceptual Logic
The indicator follows a top-down institutional analysis framework, combining multiple analytical dimensions to describe market conditions rather than predict price.
For each timeframe (Monthly, Weekly, Daily, 4H, and 1H), the indicator performs the following conceptual evaluations:
1️⃣ Trend Structure Classification
Trend direction is determined through moving-average structure analysis, comparing medium-term and long-term averages to classify each timeframe as:
Bullish
Bearish
Neutral
This step defines structural market bias, not trade timing.
2️⃣ Trend Strength & Quality Assessment
To avoid low-quality or transitional environments, the indicator applies:
Directional strength measurement
ADX-based trend validation
This helps filter:
Weak momentum phases
Ranging or choppy conditions
Incomplete trend development
3️⃣ Volatility & Price Expansion Analysis
The indicator evaluates volatility normalization using ATR-based measurements to confirm that price movement is supported by sufficient expansion.
This step helps distinguish:
Active institutional participation
Compressed or inefficient price conditions
4️⃣ Multi-Timeframe Weighting
Higher timeframes are assigned greater influence in the final assessment to reflect institutional prioritization of macro structure over lower-timeframe noise.
This weighting framework reduces bias from isolated lower-timeframe movements.
🔢 Global Market Score (0–100)
All evaluated components are aggregated into a Global Market Score, summarizing the overall market environment:
65–100 → Bullish Bias
35–64 → Neutral / Range Environment
0–34 → Bearish Bias
The score is designed as a context filter, not a trading signal.
📊 Panel Output & Interpretation
For each timeframe, the panel displays:
TF → Timeframe analyzed
Trend → Bullish / Bearish / Neutral
Strength → Relative directional intensity
ADX → Trend validity
ATR % → Volatility expansion level
The top section displays:
Global Score
Dominant Market Bias
Confirmation status (Confirmed / Weak)
Visual elements dynamically adapt to market state for clarity and readability.
🎯 Intended Use
This indicator is intended for:
Advanced discretionary traders
Smart Money & market structure approaches
Swing and intraday analysis
Trade filtering and directional bias confirmation
Manual or algorithmic trading systems requiring contextual validation
Best used in conjunction with a separate execution model.
⚠️ Disclaimer
❌ Not a buy/sell signal generator
❌ No entry or exit logic
✅ Context and confirmation tool only
Always apply proper risk management.
🏷️ Credits
Developed by NexTrade Academy
Educational and analytical tool
Use at your own risk.

Bollinger Bands + MA 50/100/200📊 Bollinger Bands + MA 50 / 100 / 200 Indicator
This indicator combines Bollinger Bands with key Moving Averages (50, 100, 200) to help you spot trend direction, volatility, and potential reversal zones in one clean view.
🔹 Bollinger Bands
* Customizable length & MA type (SMA, EMA, RMA, WMA, VWMA)
* Visualizes market volatility
* Upper & lower bands help identify overbought / oversold conditions
🔹 Moving Averages
* MA 50 → Short-term trend
* MA 100 → Medium-term trend
* MA 200 → Long-term trend & major support/resistance
* Easy toggle on/off for clean charting
💡 How to use
* Price near upper band + strong MA trend → possible continuation
* Price near lower band → watch for bounce or breakdown
* MA alignment (50 > 100 > 200) → bullish trend
* MA cross & BB squeeze → potential breakout incoming
⚠️ Best used with price action & risk management
📌 Works on stocks, crypto, forex, indices

ATR Daily & Weekly With Stop Buffer this script shows Daily & Weekly ATR and also add 10% Stop buffer calculation so you can add stop loss.

Pyramid EnterPyramid Enter — Structured Add-On Entry Framework
Pyramid Enter is an analytical add-on framework designed to highlight structured continuation entry zones within an already-established directional move. It is intentionally not a standalone signal tool and is not designed to initiate positions on its own. Instead, it focuses on scaling logic once a directional bias is already defined.
The indicator is minimal, disciplined, and role-specific:
it answers the question “Where might additional entries make structural sense if I am already aligned?”
Core Philosophy
Most indicators attempt to do too much:
Identify trend
Call tops and bottoms
Time entries
Manage exits
Pyramid Enter does none of that.
Its sole purpose is to identify continuation alignment — moments where price structure and momentum re-synchronize after a pause or reset, potentially allowing for incremental exposure rather than a single all-in decision.
This makes it especially useful for studying trend persistence, not prediction.
How Pyramid Enter Works
At its core, Pyramid Enter evaluates the relationship between:
A fast EMA (price responsiveness)
A smoothed reference line (structure stabilization)
An ENTER event is generated when:
The fast EMA crosses above the selected smoothed line
Optional EMA 8/21 trend filter confirms directional alignment
Per-bar locking ensures only one event per bar
Adaptive logic allows alignment immediately when trend conditions flip
The indicator includes:
Real-time detection
Bar-close backup logic
Single-event locking per bar
This design ensures clean behavior in both live and historical environments without signal duplication.
What Pyramid Enter Is Not
It is important to be explicit:
Pyramid Enter does not determine trend direction
It does not mark exits
It does not replace a primary entry tool
It does not predict future price movement
It simply highlights structural continuation conditions.
Clean Pairing with Rasta
Rasta defines the market regime and structural rhythm.
It answers:
Is the market trending or transitioning?
What side is structurally favored?
Has the state flipped?
Pyramid Enter is designed to be used only after Rasta has already established context.
A common analytical workflow:
Use Rasta to identify structural alignment
Ignore Pyramid Enter entirely until Rasta confirms direction
Once aligned, Pyramid Enter highlights where continuation alignment re-appears
This keeps responsibilities separated:
Rasta = context
Pyramid Enter = continuation opportunity
Clean Pairing with RSI Extremes
RSI Extremes focuses on pressure exhaustion, not continuation.
It highlights:
Oversold exhaustion (ENTER conditions)
Overbought exhaustion (EXIT conditions)
Statistically rare stress points
When combined:
RSI Extremes highlights where pressure may reset
Pyramid Enter highlights when structure realigns after that reset
This pairing allows users to study:
Exhaustion → stabilization → continuation
without relying on a single indicator to do everything.
Three-Tool System Architecture
When used together, each tool has a clearly defined role:
Rasta
→ Structural regime & directional bias
RSI Extremes
→ Momentum exhaustion & pressure extremes
Pyramid Enter
→ Continuation alignment & scaling logic
Each tool is independent, but complementary.
None replaces the others.
Design Principles
Pyramid Enter is built around:
Role clarity
Minimalism
State discipline
No prediction
No guarantees
It is intended for educational, analytical, and research use only. All interpretation, risk management, and decision-making remain the responsibility of the user.
Summary
Pyramid Enter is a focused continuation framework that:
Highlights structural add-on alignment
Avoids prediction or exit logic
Pairs cleanly with Rasta and RSI Extremes
Encourages disciplined scaling rather than impulsive entries
Its value comes from what it refuses to do, not from over-complexity.

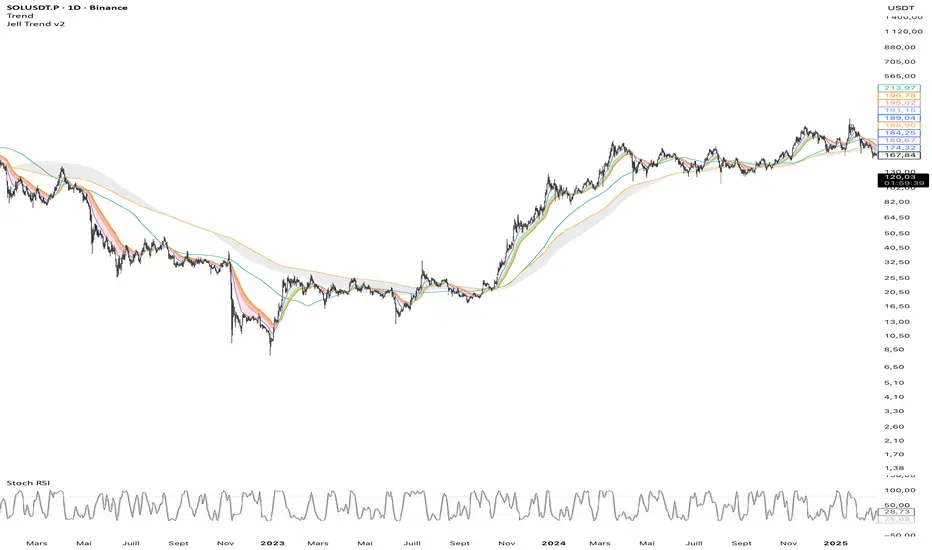
Jell TrendThe Jell Trend is a comprehensive tool designed for Trend Following and Pullback traders. It combines Short-Term Momentum, Long-Term Structure, and Multi-Timeframe (MTF) analysis into a single, clean indicator.
Key Features:
1. Momentum Ribbon (Short Term) Composed of EMA 13, 25, and 32.
Visual Aid: Dynamic clouds color the space between EMAs to show immediate trend strength.
2. Market Structure (Long Term) Displays classic institutional moving averages (SMA 100, EMA 200, SMA 200, SMA 300).
The "200 Zone": A specific cloud fills the gap between the EMA 200 and SMA 200, highlighting major institutional support/resistance areas.
3. Built-in Multi-Timeframe (MTF)
Fixed H4 EMA 200: Displays the 4-Hour EMA 200 on any timeframe (M5, M15, H1).
Benefit: Allows intraday traders to see major key levels without switching charts.
Customization:
Every line and cloud can be toggled on/off and colored to fit your specific charting needs.
Double Cross Strategy - directional color plus golden crossCandle color changes to dark green when opening below 9/20 SMAs when 9 is below the 20 and closes above.
Candle color changes to dark red when opening above the 9/20 SMAs when the 9 is above the 20 and closes below.
Candle color changes to yellow when either of the above occurs plus crosses the vwap.

Cosmic Crypto Golden ZoneCosmic Crypto Golden Zone
## Overview
**Cosmic Crypto Golden Zone** is an all-in-one swing trading indicator designed to identify high-probability retracement entries using Fibonacci levels, multi-timeframe confluence, and a simple Buy/Sell scoring system. The indicator removes the guesswork from trading pullbacks by combining structure analysis, momentum indicators, and volume confirmation into a single, easy-to-read signal.
**Best Used For:** Swing trading on 15m, 1H, and 4H timeframes in crypto, forex, and stocks.
---
## Key Features
### 🎯 Golden Zone Detection
Automatically identifies the optimal entry zone (0.5 - 0.786 Fibonacci retracement) where price is most likely to reverse and continue the trend.
### 📊 Buy/Sell Scoring (1-10)
A simplified signal table that scores setups from 1-10, telling you exactly when to buy or sell without needing to interpret multiple indicators.
### 📈 Multi-Timeframe Confluence
Filters trades to align with the higher timeframe trend (default: 4H), ensuring you only trade in the dominant direction.
### 🔍 Structure Detection (HH/HL/LH/LL)
Tracks market structure with Higher Highs, Higher Lows, Lower Highs, and Lower Lows to determine trend direction.
### 💧 Liquidity Sweep Detection
Identifies when price sweeps beyond the 0.886 level (stop-hunting zone) and reclaims the entry zone—a premium reversal signal.
### 📉 RSI Divergence Detection
Spots bullish and bearish divergences within the golden zone for additional confirmation.
### 🛡️ Dynamic Stop Loss
ATR-based stop loss that adjusts to current volatility, protecting you in both calm and volatile markets.
### 🎯 Smart Take Profit
Calculates TP based on your chosen entry point (FOMO, ENTRY, or Average) with customizable Risk:Reward targeting.
---
## How to Read the Signal Table
The table in the bottom-right corner gives you everything you need at a glance:
| Row | What It Shows |
|-----|---------------|
| **BUY/SELL + Score** | Direction and strength (1-10) |
| **Action** | 🚀 NOW (8+), ✓ READY (6-7), 👀 WATCH (4-5), ⏳ WAIT (<4) |
| **Zone** | Whether price is IN the golden zone or waiting |
| **Entry / TP / SL** | Your exact trade levels |
| **R:R** | Risk-to-Reward ratio with quality indicator |
### Score Breakdown
| Score | Meaning | Action |
|-------|---------|--------|
| **8-10** | High conviction setup | Enter on next candle close |
| **6-7** | Good setup | Enter with confirmation candle |
| **4-5** | Possible setup | Wait for more confluence |
| **1-3** | Weak/No setup | Skip this trade |
---
## How to Use: Step-by-Step
### Step 1: Check the Trend Direction
Look at the **Structure** in the info display:
- **BULLISH** (HH + HL pattern) → Only look for BUY signals
- **BEARISH** (LL + LH pattern) → Only look for SELL signals
### Step 2: Wait for Price to Enter the Golden Zone
The golden zone is highlighted between the **FOMO (0.618)** and **ENTRY (0.786)** levels. The table will show "✓ IN ZONE" when price reaches this area.
### Step 3: Check Your Score
Wait for the Buy/Sell score to reach **6 or higher** before considering an entry. Higher scores = higher probability.
### Step 4: Look for Confirmation
The best entries have multiple confirmations:
- ✅ Score 6+
- ✅ In Golden Zone
- ✅ Stochastic oversold/overbought
- ✅ RSI Divergence (DIV label)
- ✅ Liquidity Sweep (LIQ label) — *Premium signal*
- ✅ Bullish/Bearish candle pattern
### Step 5: Execute the Trade
Use the levels shown on the chart and in the table:
- **Entry:** FOMO (aggressive) or ENTRY (conservative)
- **Stop Loss:** Below/above the SL line (red)
- **Take Profit:** At the TP line (green)
---
## Chart Labels Explained
| Label | Color | Meaning |
|-------|-------|---------|
| **FOMO: ** | Green | 0.618 Fib - Aggressive entry level |
| **ENTRY: ** | Yellow (Bold) | 0.786 Fib - Conservative entry level |
| **LIQ: ** | Red | 0.886 Fib - Liquidity/stop-hunt zone |
| **TP: ** | Green | Take Profit target |
| **SL: ** | Red (Bold) | Stop Loss level |
| **R:R ** | Green/Orange | Risk-to-Reward ratio |
| **HH/HL/LH/LL** | Various | Structure swing labels |
| **DIV** | Lime/Pink | RSI Divergence detected |
| **LIQ** (arrow) | Lime/Red | Liquidity sweep signal |
| **AE** | Green/Red | Williams Vix Fix Aggressive Entry |
| **B/S** | Green/Red | Buy/Sell signal with score |
---
## Recommended Settings
### For Crypto (BTC, ETH, Altcoins)
- **Timeframe:** 1H or 4H
- **HTF:** 4H or Daily
- **Use Logarithmic Fibs:** ✅ ON
- **TP R:R Target:** 2.0 - 3.0
### For Forex
- **Timeframe:** 15m or 1H
- **HTF:** 4H
- **Use Logarithmic Fibs:** ❌ OFF
- **TP R:R Target:** 1.5 - 2.0
### For Stocks
- **Timeframe:** 1H or Daily
- **HTF:** Daily or Weekly
- **Use Logarithmic Fibs:** ✅ ON
- **TP R:R Target:** 2.0
---
## Settings Reference
### Structure (ZigZag)
- **Left Bars:** Lookback period for pivot detection (default: 10)
- **Right Bars:** Confirmation bars (default: 2)
- **Show Swing Labels:** Display HH/HL/LH/LL markers
### Multi-Timeframe Confluence
- **Enable MTF Filter:** Only trade when aligned with HTF trend
- **Higher Timeframe:** The timeframe to check trend (default: 4H)
### ADX Trend Strength
- **Enable ADX Filter:** Filter out choppy/ranging markets
- **ADX Threshold:** Minimum ADX value for trend confirmation (default: 20)
### Auto Fib Settings
- **Use Logarithmic Fibs:** Better for large % moves (crypto/stocks)
- **Fib Length:** How far the fib lines extend
### Split-Entry Trade Planner
- **Entry 1 Ratio:** FOMO level (default: 0.618)
- **Entry 2 Ratio:** ENTRY level (default: 0.786)
- **TP Calculation Mode:** Base TP on ENTRY, FOMO, or Average
- **TP R:R Target:** Your desired risk-to-reward ratio
- **Use ATR-Based Dynamic SL:** Volatility-adjusted stop loss
- **SL ATR Multiplier:** How many ATRs below entry for SL
### Williams Vix Fix
- **Show Bullish/Bearish AE:** Aggressive entry signals based on volatility extremes
- **Only Show in Golden Zone:** Filter VixFix signals to golden zone only
---
## Pro Tips
### 1. The Liquidity Sweep is Gold
When you see the **LIQ** arrow after price wicks below 0.886 and reclaims 0.786, this is often the best entry. Stops have been hunted, weak hands are out, and smart money is entering.
### 2. Don't Fight the HTF Trend
If the 4H is bearish, don't take long signals on the 15m just because the score is high. Always align with the bigger picture.
### 3. Wait for "IN ZONE"
Patience pays. The best setups come when price actually pulls back to the golden zone. Chasing breakouts leads to poor R:R.
### 4. Score 6+ is the Minimum
Scores of 4-5 can work, but your win rate will be significantly higher waiting for 6+. Scores of 8+ are rare but highly reliable.
### 5. Use Multiple Timeframes
Check the setup on your trading timeframe AND one timeframe higher. If both show bullish structure with good scores, confidence is higher.
### 6. Respect the Stop Loss
The SL is placed below the liquidity zone for a reason. If price closes below it, the setup is invalidated. Don't move your stop.
---
## Alerts Available
- **High Confluence Long/Short** — When score reaches your threshold
- **Bullish/Bearish Liquidity Sweep** — Premium reversal signal
- **RSI Divergence Detected** — Divergence in golden zone
- **Williams Vix Fix AE** — Aggressive entry signal
---
## Credits
Created by **Cosmic Crypto**
Combines concepts from:
- Fibonacci Retracement Trading
- Smart Money Concepts (Liquidity Sweeps)
- Williams Vix Fix
- Multi-Timeframe Analysis
- Stochastic RSI
- ADX Trend Strength
---
*Trade responsibly. Past performance does not guarantee future results. Always use proper risk management.*

ODTE Layman Signals 📌 Script Name
Layman Options Signals – Structured BUY CALL / BUY PUT with SL & TP
📖 Overview
This indicator is a complete, finished intraday trading system designed to simplify options trading (including 0DTE and weekly options) by converting price action and market structure into clear, actionable signals.
The script performs all analysis in the background and displays only what the trader needs to execute consistently:
BUY CALL or BUY PUT
Predefined Stop Loss (SL)
Two Take Profit levels (TP1 and TP2)
Trade status and levels displayed in a live status box
The focus of this tool is execution discipline, not prediction.
🧠 Core Concepts Used (What Makes This Script Original)
This script combines multiple price-action concepts into a single, rule-based framework:
1️⃣ Opening Range Breakout (ORB)
The script calculates the opening range high and low using the first X minutes of the regular session.
Trades are only allowed above ORB high for CALLs and below ORB low for PUTs.
This filters low-quality trades during early chop.
2️⃣ Market Structure Confirmation
CALL trades require higher highs and higher lows
PUT trades require lower lows and lower highs
This prevents trading against structure.
3️⃣ Retest & Liquidity Sweep Validation
Breakouts are validated using:
ORB retests (price accepts above/below the range)
Liquidity sweeps (false breakouts that trap traders)
This helps reduce fake breakouts.
4️⃣ Volatility-Aware Risk Management
Stop losses are placed using market structure + ATR buffer
This avoids stops being placed at obvious levels.
5️⃣ Multi-Target Trade Management
TP1 = partial profit (risk reduction)
TP2 = runner target (trend continuation)
After TP1, stop loss can move to breakeven (optional)
6️⃣ Discipline Controls
Only one active trade at a time
Cooldown period after a stop loss
Prevents over-trading and revenge trading
📊 What the Indicator Displays
The script plots the following directly on the chart:
Entry level
Stop Loss (SL)
Take Profit 1 (TP1)
Take Profit 2 (TP2)
Opening Range High & Low
It also includes a Status Box that always shows one of the following states:
WAIT
BUY CALL
BUY PUT
IN TRADE
COOLDOWN
This allows traders to understand the current state at a glance without reading code.
▶️ How to Use the Indicator
Recommended Timeframes
1-minute or 2-minute charts
Intraday use only
Entry Rules
When BUY CALL appears → Buy an ATM or slightly ITM call
When BUY PUT appears → Buy an ATM or slightly ITM put
Risk Management
Exit immediately if price hits the SL line
Take partial profits at TP1
Hold remaining position for TP2 if conditions allow
When Status Shows WAIT or COOLDOWN
No trade should be taken
⚙️ Recommended Instruments
SPY / QQQ
Liquid large-cap stocks
Intraday options (0DTE / weeklies)
⚠️ Important Disclaimer
This script is provided for educational purposes only.
It is not financial advice
It does not guarantee profits
It does not place trades automatically
Options trading involves significant risk
Always test using paper trading or small size before live use.
🎯 Who This Script Is For
✔ Traders who want clear rules
✔ Traders who prefer price action over indicators
✔ Options traders who value risk management
✔ Users who want less chart clutter and more discipline
❌ Not intended for swing trading
❌ Not intended for automated trading systems
🧩 Final Notes
This is a complete, finished indicator, not a test or experimental script.
All logic is deterministic, non-repainting, and designed for real-time use.
The philosophy behind this tool is simple:
Good trading comes from structure, discipline, and risk control — not prediction.

Boyen_Multi EMA LTF HTFKey Features:
Short-Term Trend (Lower Timeframe - LTF):
EMA 13: A 13-period EMA that reacts quickly to recent price changes, ideal for capturing short-term momentum and early trend shifts.
EMA 21: A 21-period EMA offering a slightly smoother view of price action, balancing sensitivity and reliability for short-term analysis.
EMA 25: A 25-period EMA providing additional confirmation of short-term trends with a bit more lag for stability.
Medium-Term Trend:
SMA 100: A 100-period SMA that serves as a benchmark for medium-term trend direction, often used to gauge broader market sentiment and key levels.
Long-Term Trend (Higher Timeframe - HTF):
EMA 200: A 200-period EMA, widely recognized as a critical long-term trend indicator, helping traders assess the overall market bias.
SMA 300: A 300-period SMA for an even deeper perspective on long-term price movements, smoothing out noise to highlight major trends.

NIFTY Buy Sell IndicatorThis indicator is best suited for intraday trading on Nifty with 5 minutes timeframe.

Black OPS Pro Edition (White Knight) v1.0Black OPS Pro Edition (White Knight) v1.0
Black OPS Pro Edition (White Knight) v1.0 is a professional-grade educational trading tool designed for trend analysis, volatility measurement, and intrabar signal detection. It combines ATR-based volatility tracking, Bollinger Bands, EMA bounces, and stochastic filtering to provide clear visual cues on market movements.
Features:
ATR & Volatility Analysis: Tracks market volatility and directional movement.
Bollinger Bands: Upper, lower, and midline bands with smoothing to identify breakouts and pullbacks.
Trend Detection: Automatically identifies bullish, bearish, and neutral trends.
EMA Bounces: Detects price interactions with multiple EMA levels (1- 200).
Stochastic Filter: Confirms trend signals and helps reduce false alerts.
Visual Signals: Up 🚀 and down 💥 arrows for trend flips, plus EMA bounce indicators ⚔️ 🕵️.
Dashboard: Displays current volatility and trend strength.
Background Coloring: Highlights bullish and bearish periods.
Screen-Fixed Disclaimer: Table at the bottom-right with a permanent educational disclaimer.
User Customization:
Adjust ATR length, volatility lookback, Bollinger Band parameters, EMA settings, and other thresholds to fit your trading style.
Disclaimer:
For educational purposes only. This script does NOT provide financial advice or guarantee profits. Users are fully responsible for their own trading decisions and risk management. Always perform your own analysis before making trades.

Swing & Intraday Entry/Exit Setup V0.1Support & Resistance Levels with Moving Averages & Supertrend
Overview
This comprehensive indicator combines Multi Support/Resistance analysis , Moving Average, and Supertrend signals into one powerful tool. Designed for intraday/swing traders, it helps identify key price levels across Daily, Weekly, and Monthly while providing trend confirmation through MAs and Supertrend.
Product of: CandleCodex
License: Free for personal use | NOT FOR SALE
Version: 5.0 (Pine Script v6)
---
KEY FEATURES
Swing & Intraday Entry/Exit Setup V0.1 © CandleCodex™ (Daily/Weekly/Monthly)
- Previous Day High/Low (PDH/PDL) with customizable styling
- Previous Week High/Low (PWH/PWL) with independent settings
- Previous Month High/Low (PMH/PML) for swing traders
- Mid Levels - Adjustable percentage (default 50%) between high and low
- R1, R2, R3 - Projected resistance levels based on price range
- S1, S2, S3 - Projected support levels for breakout/breakdown targets
Moving Average
- 4 Fully Customizable MAs (20, 50, 100, 200 by default)
- Multiple MA Types: SMA, EMA, SMMA (RMA), WMA, VWMA
- Custom Source Selection: Close, Open, High, Low, HL2, HLC3, OHLC4
- Individual Colors & Toggle:** Show/hide each MA independently
Supertrend Indicator
- Buy/Sell Signals - Automatic labels on trend reversals
- Trend Highlighting - Background fill for bullish/bearish trends
- Customizable ATR Period & Multiplier (Default: 10, 3.0)
- Multiple Source Options: HL2, Close, Open, etc.
- Alert Conditions: Set alerts for buy/sell signals and trend changes
Information Tables
- 3 Separate Tables for Daily, Weekly, Monthly levels
- Adjustable Positions: 9 position options (top, middle, bottom - left, center, right)
- Custom Text Size: Tiny, Small, Normal, Large
- Live Price Display: Shows all levels with current prices
- Range Calculation: Displays trading range for each timeframe
Advanced Customization
- Line Styling: Width (1-5), Style (Solid/Dashed/Dotted), Color for EVERY level
- Label Options: Show/hide labels, show/hide prices, left/right positioning
- Historical Data: Display up to 50 previous periods
- Custom Session Timing: Set specific hours for daily levels (Indian market: 9:15-15:30)
- Copyright Watermark: Toggleable branding with position control
---
VISUAL CUSTOMIZATION
Every line (High, Low, Mid, R1-R3, S1-S3) has independent controls for:
- Color - Choose from full color palette with transparency
- Width - 1 to 5 pixels thickness
- Style - Solid, Dashed, or Dotted lines
- Show/Hide - Toggle individual levels on/off
Default Color Scheme:
- Daily: Green (High), Red (Low), Yellow (Mid)
- Weekly: Cyan (High), Magenta (Low), Light Green (Mid)
- Monthly: Orange (High), Purple (Low), Pink (Mid)
---
HOW TO USE
For Day Traders:
1. Enable Daily Levels - Focus on PDH/PDL as key intraday S/R zones
2. Watch for Breakouts - Price breaking PDH = bullish, breaking PDL = bearish
3. Use Mid Level - Acts as equilibrium; rejection zone for mean reversion
4. R/S Targets - Use R1, R2, R3 as profit targets above PDH; S1, S2, S3 below PDL
5. MA Confirmation - Enter trades in direction of MA trend
6. Supertrend Signals - Take BUY when price above Supertrend, SELL when below
For Swing Traders:
1. Enable Weekly/Monthly Levels - PWH/PWL and PMH/PML for bigger picture
2. Combine Timeframes - Strong rejection at PWL + Daily bullish Supertrend = long opportunity
3. Range Trading - Trade between PWH and PWL in consolidation
4. Breakout Confirmation - Use MA ribbon to confirm trend direction on HTF breakouts
Risk Management:
- Place Stop Loss just below PDL for longs, above PDH for shorts
- Targets: Use R1/S1 for scalping, R2/S2 for swing trades, R3/S3 for momentum trades
- Avoid Chop Zones: When price between MAs, wait for clear trend
---
SETTINGS GROUPS
1. ENABLE/DISABLE FEATURES - Master toggles for all components
2. DISPLAY SETTINGS - Labels, prices, positioning, historical periods
3. DAILY LEVELS STYLING - Complete customization for daily timeframe
4. WEEKLY LEVELS STYLING - Complete customization for weekly timeframe
5. MONTHLY LEVELS STYLING - Complete customization for monthly timeframe
6. MOVING AVERAGES - 4 independent MA configurations
7. SUPERTREND - ATR period, multiplier, signals, highlighting
8. TABLE SETTINGS - Position, size, colors for info tables
9. ADVANCED SETTINGS - Custom session timing, timezone
---
UNIQUE ADVANTAGES
All-in-One Solution - No need for multiple indicators cluttering your chart
Zero Lag - Calculates previous day/week/month data accurately without repainting
Full Control - Every visual element is customizable
Clean Interface - Organized settings with clear tooltips
Performance Optimized - Efficient code, no lag even with all features enabled
Indian Market Ready - Custom session timing (9:15 AM - 3:30 PM IST)
Free Forever - No subscriptions, no hidden costs
---
## 📖 TECHNICAL DETAILS
- Pine Script Version: v6
- Chart Type: Overlay indicator
- Calculation Method: Uses `request.security()` for accurate HTF data with `lookahead_on` to prevent repainting
- Data Structures: Uses Pine v5 matrices and custom types for efficient level management
- Performance: Max 500 lines, 500 labels for historical level display
---
IMPORTANT NOTES
- Works best on intraday timeframes (15min to 4hour)
- Requires TradingView Premium/Pro for reliable multi-timeframe data
- Previous day data appears after the first bar of new day
- Custom session timing only affects Daily levels (Weekly/Monthly use standard calendar)
- Tables display only on last bar to maintain performance
---
LEARNING RESOURCES
This indicator is designed to help traders understand:
- Key support and resistance concepts
- Multi-timeframe analysis techniques
- Trend following with moving averages
- Momentum trading with Supertrend
- Professional chart setup and risk management
---
COPYRIGHT & TERMS
© 2025 CandleCodex™ - All Rights Reserved
Developer: Siddharth Sharma
License: Mozilla Public License 2.0 with additional restrictions
Allowed:
- Personal trading use
- Educational purposes
- Sharing with attribution
Prohibited:
- Commercial sale or resale
- Rebranding as your own work
- Removing copyright notices
- Claiming authorship
This indicator is FREE and will always remain FREE.
If someone is selling this, they are violating copyright.
---
SUPPORT & FEEDBACK
For questions, suggestions, or bug reports:
- Comment below this publication
- Follow CandleCodex™ for updates
- Check release notes for latest improvements
If you find this indicator useful, please Like ❤️ and leave a comment!
---
Disclaimer: This indicator is for educational purposes only. Trading involves risk. Past performance does not guarantee future results. Always practice proper risk management and consult with a financial advisor before trading.


HTF EMA Bias BackgroundThis indicator gives you the cross over points from EMAs on the 15 min chart as a coloured background, you can then go to the 1 min chart to see the overlay. Useful for a higher time frame BIAS.

Custom Reversal Oscillator [wjdtks255]📊 Indicator Overview: Custom Reversal Oscillator
This indicator is a momentum-based oscillator designed to identify potential trend reversals by analyzing price velocity and relative strength. It visualizes market exhaustion and recovery through a dynamic histogram and signal dots, similar to premium institutional tools.
Key Components
Dynamic Histogram (Bottom Bars): Changes color based on momentum strength. Bright Green/Red indicates accelerating momentum, while Darker shades suggest fading strength.
Signal Line: A white line tracing the core momentum, helping to visualize the "wave" of the market.
Buy/Sell Dots: Small circles at the bottom (Mint) or top (Red) that signal high-probability reversal points when the market is overextended.
📈 Trading Strategy (How to Trade)
1. Long Entry (Buy Signal)
Condition 1: The price should ideally be near or above the 200 EMA (for trend following) or showing a Bullish Divergence.
Condition 2: The Histogram bars transition from Dark Red to Bright Green.
Condition 3: A Mint Buy Dot appears at the bottom of the oscillator (near the -25 level).
Entry: Enter on the close of the candle where the Buy Dot is confirmed.
2. Short Entry (Sell Signal)
Condition 1: The price is struggling at resistance or showing a Bearish Divergence.
Condition 2: The Histogram bars transition from Dark Green to Bright Red.
Condition 3: A Red Sell Dot appears at the top of the oscillator (near the +25 level).
Entry: Enter on the close of the candle where the Sell Dot is confirmed.
3. Exit & Take Profit
Take Profit: Close the position when the Signal Line reaches the opposite extreme or when the histogram color starts to fade (loses its brightness).
Stop Loss: Place your stop loss slightly below the recent swing low (for Longs) or above the recent swing high (for Shorts).
💡 Pro Tips for Accuracy
Watch for Divergences: The most powerful signals occur when the price makes a lower low, but the Custom Reversal Oscillator makes a higher low. This indicates "Hidden Strength" and a massive reversal is often imminent.

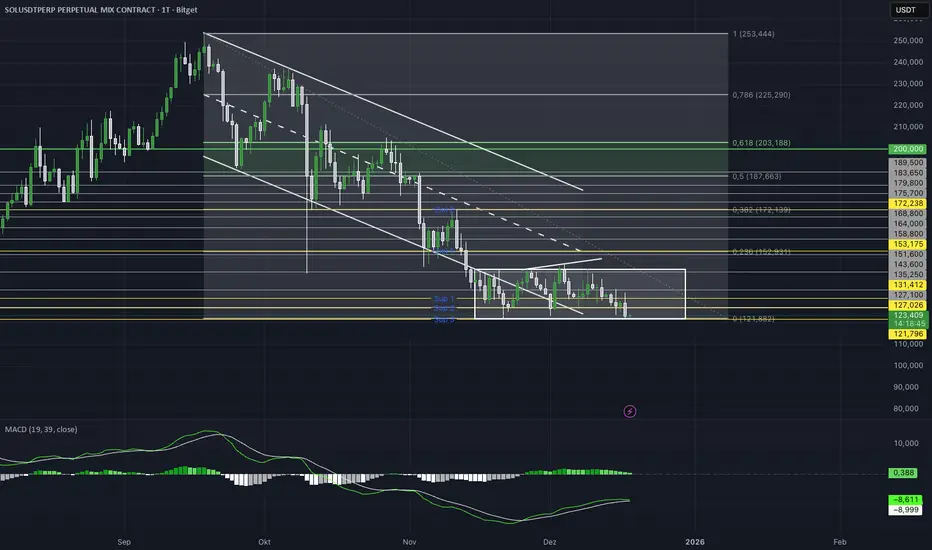
MACD CFF EditionMACD (19 / 39) – Higher Timeframe Momentum
This indicator is a modified MACD version designed specifically for higher timeframes and structural market moves.
Compared to the standard MACD (12 / 26), the periods are intentionally extended to reduce short-term noise and focus on meaningful momentum and trend shifts.
The classic MACD (12 / 26) reacts very quickly and often produces many signals on lower and mid timeframes that mainly reflect micro-volatility.
Using 19 / 39 deliberately slows the indicator down and filters out movements that lack relevance for higher-timeframe market structure.
Line Explanation
White Line – MACD Line (19–39)
This line measures the distance between short-term and mid-term momentum.
It highlights structural changes in capital flow.
Above zero → bullish structural momentum
Below zero → bearish structural momentum
Green Line – Signal Line
A smoothed version of the MACD line.
Used for confirmation, not for fast entry signals.
Crossovers should be interpreted as context confirmation, not buy or sell commands.
Histogram
Displays the distance between the MACD line and the signal line.
Helps identify whether momentum is:
expanding
or weakening
Intended Use
• Best suited for 4H, Daily and Weekly
• Trend and directional bias filter
• Structural confirmation
• Works best combined with price action and key levels
Not a scalping tool. Not a standalone signal indicator.
MA20 Dual Color Line IndicatorMA20 Dual Color Line Indicator
The MA20 Dual Color Line is a simple yet effective moving average indicator designed to help traders quickly visualize price trends and potential reversal points. It plots a 20-period Simple Moving Average (SMA) that changes color based on the relationship between the current closing price and the moving average itself.
🔶 How It Works
When the close price is above the MA20, the moving average line turns green, suggesting a potential bullish trend.
When the close price is below the MA20, the line turns red, indicating a possible bearish trend.
If the price is exactly at the MA20, the line remains white, highlighting a neutral or decision point.
📈 Ideal For
Identifying trend direction at a glance
Spotting support and resistance levels around the MA20
Enhancing visual analysis without cluttering the chart
🛠 Features
Clean and customizable line width
Real-time color switching based on price action
Overlay display to keep charts organized
This indicator is perfect for traders who prefer a clear, color-coded visual aid to complement their trading strategy. Whether you’re a beginner or an experienced trader, the MA20 Dual Color Line helps you stay aligned with the short-term trend.

Advanced custom multi MA signals (EMA/SMA/VWMA/VWAP) Features of Multi Moving Averages
The biggest enemy in trading is "Noise." If you get swayed by minute fluctuations on the chart, you end up missing the forest for the trees.
This indicator (Advanced Custom Multi MA Signals) is not just a simple line. By combining the three core elements of Price, Time, and Volume, it acts as a navigation system that visualizes the market's "true trend." In particular, the ability to analyze 5 moving averages simultaneously across various timeframes is akin to viewing a 3D map of the battlefield.
Understanding Core Concepts
This indicator supports 4 types of moving averages. It is crucial to clearly understand the nature of each tool.
SMA (Simple Moving Average): The most basic average value. Since it produces fewer whipsaws (false signals), it is used as a baseline to judge the "long-term trend."
EMA (Exponential Moving Average): Places more weight on recent prices. It reacts sensitively to market changes, making it advantageous for identifying "entry points."
VWMA (Volume Weighted Moving Average): Incorporates "volume" into the price calculation. It acts as a "false signal filter," weeding out price moves that aren't backed by trading volume.
VWAP (Volume Weighted Average Price): The benchmark price used by institutional investors for daily trading. It is calculated based on the session, regardless of the period settings. It is considered the "lifeline" of day trading.
Indicator Settings Guide
Open the settings window and tune it to fit your trading style.
MA 01 ~ 05 (Moving Average Settings)
MA Type: Select according to your purpose. (Generally, EMA is recommended for short-term analysis, SMA/VWMA for long-term).
Length: Enter the period you wish to analyze (e.g., 20, 60, 120, 200).
Timeframe: This is the core feature. It allows you to overlay moving averages from a higher timeframe (e.g., 4-hour, Daily) onto the chart you are currently viewing (e.g., 15-minute).
Signal Option (Trading Signals)
Golden Cross (GC) / Death Cross (DC): Captures the moment the short-term line breaks through the long-term line. You can run up to 3 strategies simultaneously.
Ribbon Gradient (Trend Visualization)
Represents the gap between two moving averages with color. As the color deepens and the width expands, it indicates a powerful trend; if the width narrows, it suggests a high probability of a trend reversal.
5 Usage Strategies
The highlight of this indicator is the cross strategy utilizing the "Multi-Timeframe (MTF)" feature. Familiarize yourself with the 5 example strategies below and set up your own strategy based on your expertise.
💡 Tip 1. Do not go against the "Major Trend" (The Authority of the Weekly Candle)
Settings: Set MA5 to .
Interpretation: The Weekly 50 line is the "major trend line" managed by institutions and market makers. If the current price is above this line, maintain only a "Buy (Long)" bias; if below, maintain only a "Sell (Short)" bias. Adhering to this rule alone can help you avoid massive losses.
💡 Tip 2. Highly Reliable "Swing Signal" (Daily Golden Cross)
Settings: In Signal 1, configure the Short MA to and the Long MA to .
Interpretation: A Golden Cross where the 4-Hour 50 EMA breaks above the Daily 50 EMA often signifies a major "trend reversal" rather than a temporary rebound. This provides an ideal entry signal for office workers or swing traders who need high reliability.
💡 Tip 3. 4-Hour Candle as the Standard for "Precision Entry"
Situation: When the Daily trend is rising (Bullish alignment).
Strategy: While watching the 15-minute or 1-hour chart, set the indicator's Signal 2 to the cross of and .
Interpretation: When the Daily chart is in an uptrend, a Golden Cross occurring on the 4-Hour chart marks "the point where a correction (pullback) ends and the rise resumes." This is the entry point with the best risk-to-reward ratio.
💡 Tip 4. Filtering Out "Fake Signals" (The Secret of Volume)
Strategy: When creating a cross signal, try using VWMA (Volume Weighted) for the Long MA, even if you use EMA for the Short MA.
Reason: A Golden Cross caused simply by a rise in price can be a trap. However, if it breaks through the heavy VWMA line accompanied by volume, it is strong evidence that "genuine liquidity" has entered.
💡 Tip 5. Remember the "Hierarchy" (Higher Timeframe Priority Rule)
Principle: If a Golden Cross (Buy Signal) appears on the 4-Hour chart, but the Daily chart is in a Death Cross (Sell Signal) state, do not enter.
Interpretation: A signal from a lower timeframe cannot overcome the power of a higher timeframe. The professional approach is to trade with significant volume only when signals align (Sync) in the order of Weekly > Daily > 4-Hour. Keep this indicator's dashboard feature on and always check the status of higher timeframes.
Signal Generation Principle (Operating Mechanism)
Signals are generated when the set short-term moving average and long-term moving average cross each other.
📈 1. Golden Cross (BUY = Buy Signal)
Situation: The moment the short-term MA crosses upward from below the long-term MA.
Principle: It implies that recent buying pressure has broken through the resistance level accumulated over a long period.
📉 2. Death Cross (SELL = Sell Signal)
Situation: The moment the short-term MA crosses downward from above the long-term MA.
Principle: It implies that recent selling pressure has collapsed the long-term support line.
※ If the candles are not displaying correctly or are flickering, please set the indicator's 'Visual order' to 'Bring to front' as shown in the image below.
Investment Caution and Disclaimer
Before using this indicator for actual trading, please strictly read the contents below.
① Auxiliary indicators are a "Compass," not a "Book of Prophecy."
This indicator is merely a tool that mathematically calculates and visualizes past price data. A "magic indicator" that predicts future price fluctuations 100% accurately or guarantees profit does not exist. The signals provided are for reference only and must never be the sole basis for entry/exit decisions.
② The responsibility for all investments lies with "Yourself."
Financial investment (Cryptocurrencies, Stocks, Futures, etc.) involves high volatility and is a risky activity that can result in the loss of some or all of the principal. The final responsibility for all trading results (profits and losses) incurred by utilizing this indicator lies entirely with the investor. The distributor and developer accept no legal responsibility for investment results under any circumstances.
③ Past data does not guarantee the future.
Even a Golden Cross that fit perfectly in backtesting or past charts may operate differently in tomorrow's market situation (News, Macroeconomics, Unexpected Variables, etc.). Do not rely solely on technical analysis; you must conduct fundamental analysis and risk management in parallel.
④ Risk management is the top priority.
No matter how promising a signal appears, "all-in trading" (investing all assets in a single trade) is a shortcut to bankruptcy. More important than the indicator itself is adhering to the principles of strict scaling in (split buying) and Stop-Loss.

Triple Supertrend + EMA CrossoverCustomized 3 supertrend and EMA crossover which is helpful for identification of the trend.
