Power Bar [MMT]Identify and trade powerful market thrusts with precision. Power Bar detects high-momentum bullish and bearish candles that break recent support or resistance, combine proximity to a key moving average, and offer automated multi-TP trade management.
Features
Power Bar Detection : Spots large-bodied candles (relative to ATR) with minimal opposing wicks, originating near the 20 SMA, and breaking key support/resistance zones.
Fully Configurable : Adjust ATR length/multiplier, wick size ratio, SMA proximity, display style (most recent/historical) and more.
SMA Overlay : Optionally plot configurable SMA for context with proximity checks.
Support/Resistance Lines : Detect and visualize dynamic S/R based on recent swing highs/lows, with customizable lookback, style, color, and tolerance.
Trade Managemen t: Automated lines and labels for entry, stop loss, and up to three profit targets (ATR or risk multiples). Choose display mode and extend historical trades.
Visual Alerts : Color-coded bar highlights, up/down arrow label overlays, customizable colors for bullish/bearish power bars.
Use Cases
Rapidly spot and respond to strong market moves, often signaling trend initiation or continuation.
Integrate with multi-timeframe setups, momentum strategies, and discretionary trading.
Set up actionable alerts when a power bar triggers in real time.
Inputs
ATR length and multiplier
Wick ratio and SMA proximity
Support/resistance lookback, tolerance, style, color
Trade management toggle and TP calculation modes
Historical/max recent bars/trades limit controls
Alerts
Alert conditions for bullish, bearish, and any power bar event, supporting automated trading workflows.
Moving Averages
(15M) Gold Daily SignalQuick Start
Symbol XAUUSD, timeframe 15m.
Defaults: TP 50 pips, SL 150 pips.
Wait for green (long) or red (short) background after bar close.
Place orders at the plotted Entry / TP / SL; optional scale-ins at E1/E2.
Max signals kept on chart – housekeeping only (limits old drawings).
Alerts
Turn Green → ready-to-buy signal.
Turn Red → ready-to-sell signal.
Create alerts once per bar close and keep the default message or customize.

Yit's SMA'sThis is the first update to my original SMA indicators I've added the following:
10 Week SMA
40 Week SMA
3 Month SMA
18 Month SMA
I wanted to add more based on these being common indicators various types of trading uses.
There will probably be more in the future.

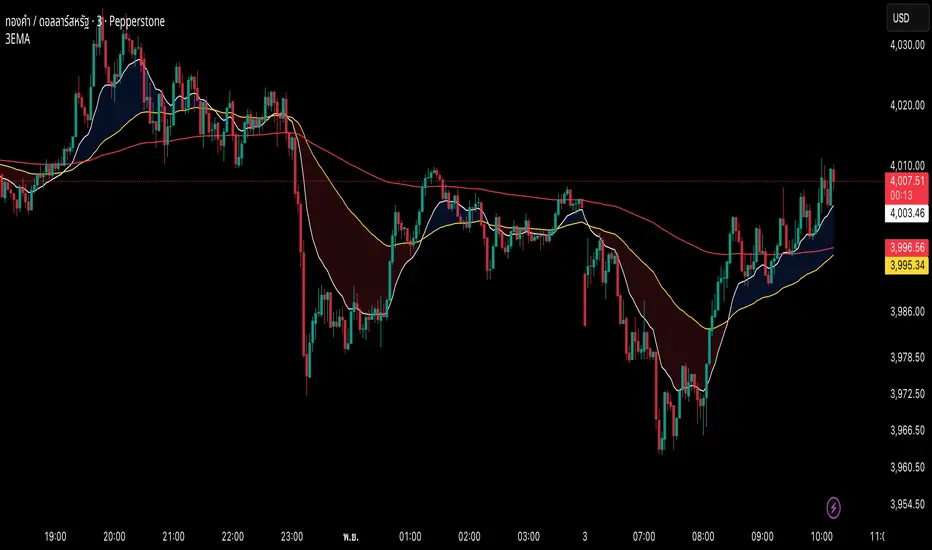
Simple EMA Cloud 20/50Shades the area between the 20 and 50 EMAs.
That's all it does, but combined with other indicators like the MACD, it gives you clear indications of entries and exits.
AND, it has no calories. What more could you ask for?

OmniTraderOmniTrader — What It Does
A pragmatic intraday toolkit that keeps your chart readable while surfacing the levels traders actually use: EMAs across timeframes, VWAP, yesterday’s high/low, Asian/London/NY session ranges, and a configurable Opening Range Breakout (ORB).
Multi-Timeframe EMAs (EMA 1 & 2) — Pick any TF per EMA (e.g., 5m EMA on a 1m chart).
VWAP — Toggle on/off for quick mean/flow context.
Session High/Low (live → frozen)
Tracks Asian / London / New York in your chart/exchange timezone.
Rays auto-extend; labels optional.
Previous Day High/Low — Daily levels with optional labels; auto-resets each new day.
Opening Range Breakout (ORB)
Choose session (NY/London/Asian) and 15m or 30m window.
Levels update live during the window, then lock.
Separate colors for ORB High & ORB Low + labels.
Style & Clarity Controls — Per-group color pickers, line width/style, label size & visibility.
Designed to minimize clutter while keeping essentials visible.

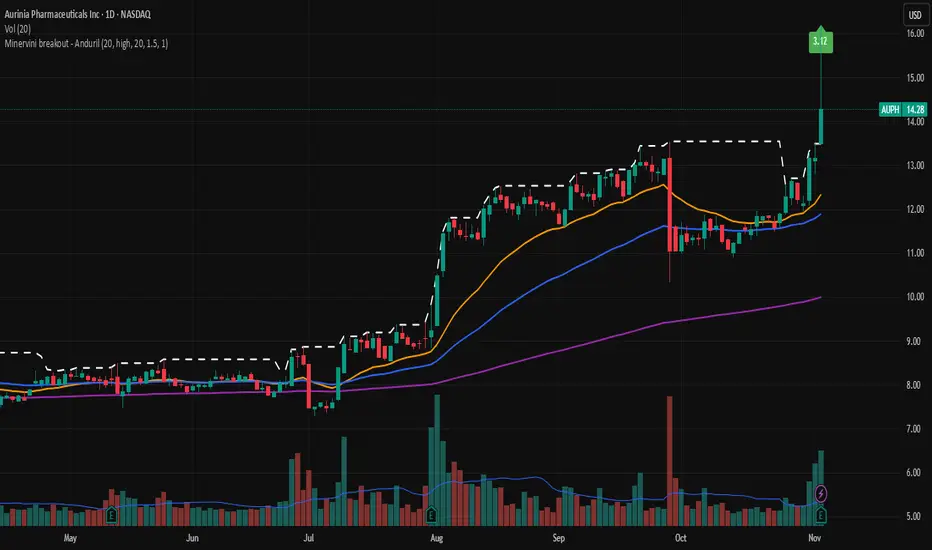
Minervini breakout - AndurilThis indicator checks the Mark Minerivini trend template as well checks consolidation areas and breakout.
Checks the highest closing price of last x days (default 20 days), exluding current day and draws a white dashed line, Calculates the relative volume of the current day. Calculates EMA 21, EMA50 and EMA200 and draws on the graph to define trend.
Gives a buy signal in green (writing relative strength of that day inside of green arrow) if:
1) Current price> breakout price* 0.98
2) Current price > EMA21 >EMA50>EMA200
3) Current price > 52 week high*0.75
4) Current price > 52 week low*1.3
5) EMA 200 of today > EMA 200 of 10 bar ago > EMA 200 of 20 bar ago
6) Relative volume of the day > 1.5
ממוצעים נעים דינמיים – קצר / בינוני / ארוךMA - L/M/S
dynamic ma across different time frame
5m, 30m, d, w, m

Opening Range HarmoniX
This is an all-in-one, modular toolkit designed for intraday traders, especially those focusing on the New York session. It combines a fully customizable Opening Range (OR) with a suite of essential indicators (Moving Average, VWAP, Supertrend, and Pivots) to provide a complete and clean view of the market.
All modules (indicators) can be toggled on or off individually, and the entire settings menu is fully translated in both English and Farsi (Persian).
Key Features
1. Customizable Opening Range (OR):
Range Timeframe: Set your OR timeframe (5, 15, or 30 min).
Precise Start Time: Define the exact start hour and minute (default 9:30 NY Time).
Key Levels: Includes OR High, OR Low, and a crucial Mid Line for price equilibrium.
Extension Method: Choose how lines extend: "Until NY Session Close" (16:00) or for a fixed "Number of Bars".
Full Styling: Complete control over color, width, and line style (solid, dashed, dotted) for all levels.
2. Dynamic Day Label:
Automatically displays the day of the week (in English or Farsi) and the selected OR timeframe (e.g., "Monday - 15m") at the start of the range.
3. Built-in Indicator Suite (All Toggleable):
Moving Average (MA):
Multiple Types: Choose from SMA, EMA, WMA, HMA, or VWMA.
Dynamic Coloring: MA line color automatically changes based on its upward (Uptrend) or downward (Downtrend) slope.
VWAP (Daily):
Features similar dynamic coloring to quickly identify the intraday trend bias.
Supertrend:
A classic trend-following tool with customizable ATR Period and Factor.
Dynamic trend-based coloring (uptrend/downtrend).
Pivot Points:
Classic high/low pivots with customizable lookback periods (left/right) to spot key turning points in the market.
💡 Core Concept
Use the Opening Range levels (High, Low, and Mid) as primary support/resistance and to establish the bias for the day. Then, use the additional indicators (MA, VWAP, Supertrend) to confirm trend direction and identify entry/exit opportunities in relation to the OR levels.

Rolling Compound ReturnRolling Compound Return Indicator - Summary
This indicator calculates and displays the compounded return over rolling time periods, showing how an investment would have performed if held for the specified lookback length.
How it works:
1. Rolling calculation - For each bar, looks back N periods and compounds all the returns together using the formula: (1 + return₁) × (1 + return₂) × ... × (1 + returnₙ) - 1
2. Multiple timeframes - Allows comparison of up to 3 different rolling periods simultaneously:
* Period 1 (default 20 bars): Blue line
* Period 2 (default 50 bars): Orange line
* Period 3 (default 100 bars): Purple line
3. Visual elements:
* Lines plotted as percentage returns on dedicated Y-axis
* Zero reference line to distinguish gains from losses
* Optional green/red fill showing positive/negative zones
* Info table displaying current values for each period
4. Key insight - Unlike simple moving averages of returns, this shows the actual cumulative effect of holding through all the ups and downs over the rolling window.
Use case: Helps identify whether recent price action (over your chosen lookback period) has resulted in net gains or losses, and how different time horizons compare. For example, you might see the 20-period showing +5% while the 50-period shows -2%, indicating recent strength after a longer decline.
The indicator updates on every bar to show the "rolling N-period return" at each point in time.

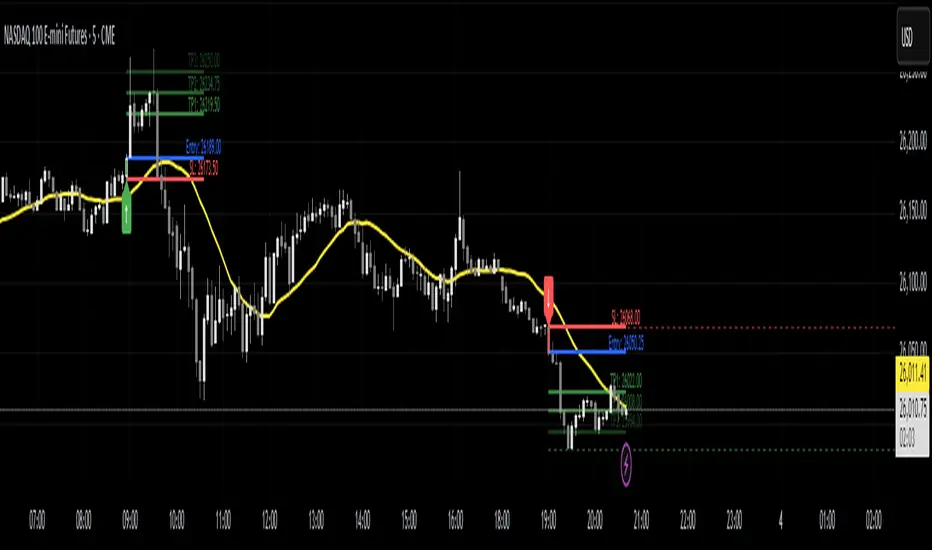
Real Trade (Banana Trader)📊 Introducing my exclusive TradingView indicator, built using my personal trading strategy 💪
This indicator shows you in real time:
✅ Possible entries
✅ Where to place your Stop Loss (SL)
✅ Where to set your Take Profit (TP)
It’s based on my system:
1️⃣ Identify the trend on higher timeframes (H1 or H4)
2️⃣ Look for key zones of interest on lower timeframes (M15)
3️⃣ Wait for the price reaction and execute the trade on M5 🎯
A tool created to simplify your analysis and help you trade with more clarity and precision 💥
⚠️ This video is for educational purposes only and does not constitute financial advice.
#trading #tradingview #tradingindicator #trader #smartmoney #forex #xauusd #scalping #tradingstrategy #learntrading #priceaction #tradingtips #daytrader #financialeducation #tradingcommunity #forextrader #marketanalysis #tradingsetup

EMA921// ─────────────────────────────────────────────
// Notes for Publishing
// ─────────────────────────────────────────────
// This script plots EMA 9 and EMA 21 with trend shading.
// Colors: EMA 9 = Orange, EMA 21 = White
// Ideal for short-term trend following & entries.

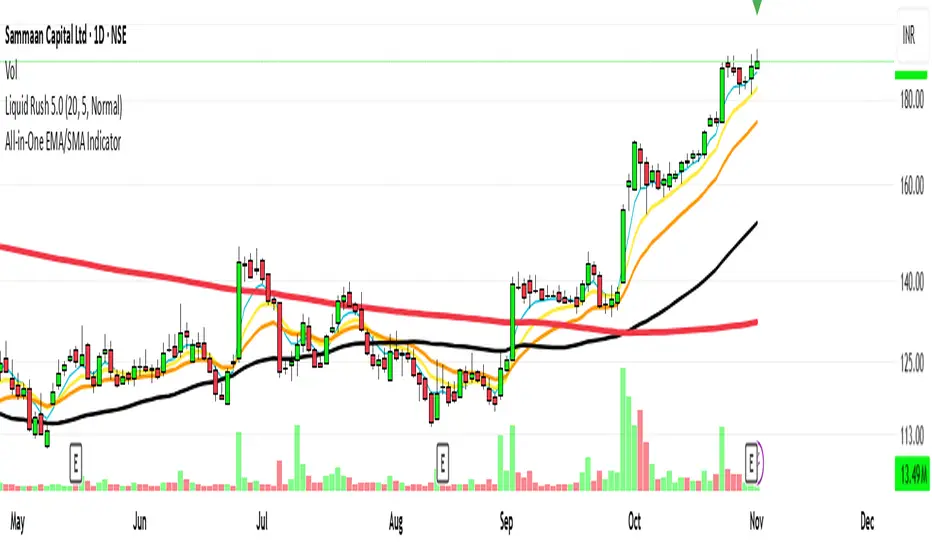
All-in-One EMA/SMA Indicator 5 EMA + 10 EMA + 20 EMA + 50 SMA + 200 SMA
All important moving averages at one place with required modification capabilities
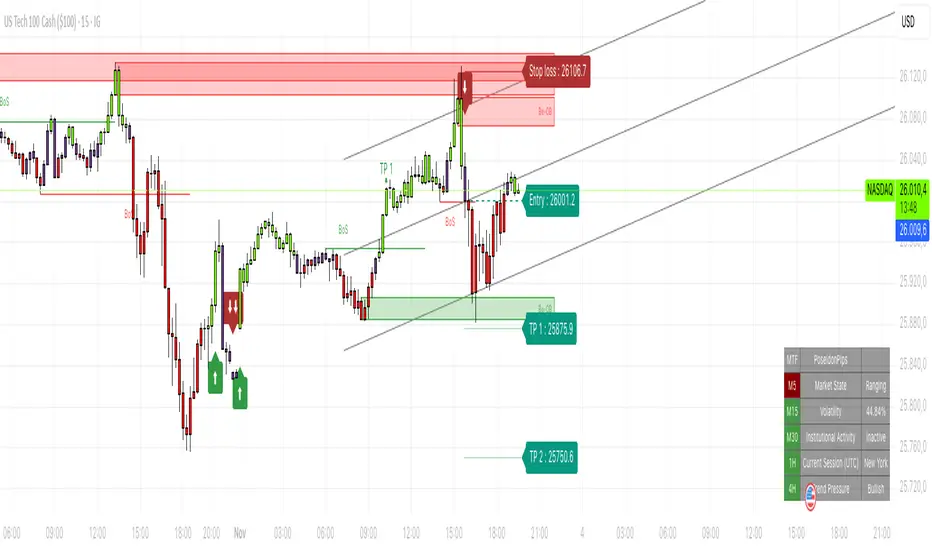
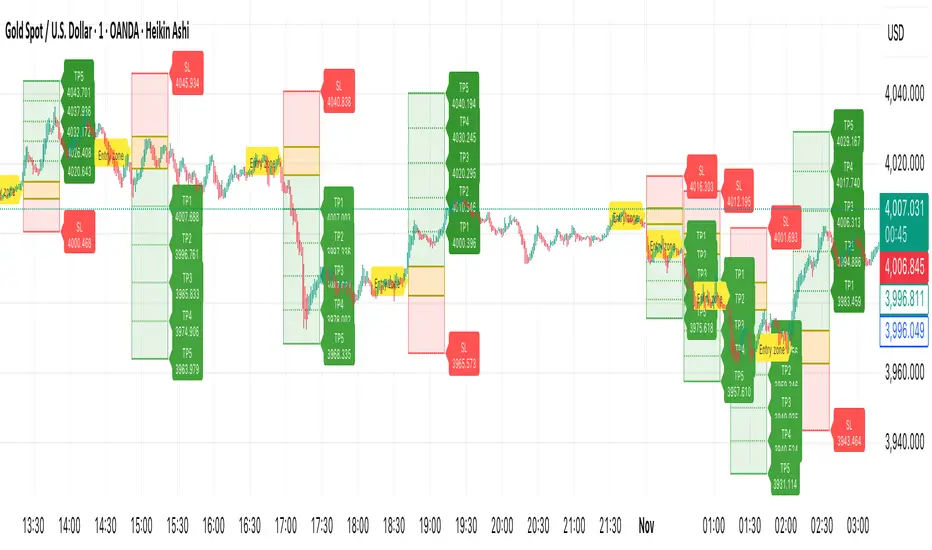
OrderVibe HFOrderVibe HF (High Frequency) Indicator
Overview
OrderVibe HF is a closed-source analytical framework designed to visualize short-term market direction, momentum shifts, and adaptive volatility conditions.
It does not generate trade calls or execute orders. Its purpose is to provide a fast, structured intraday context for traders observing short-term rotations and reversals.
How it works
-Dynamic Baseline & Flow Score - calculates an adaptive directional baseline that tracks short-term price flow and evaluates its strength through a scoring process. Long/short candidates appear when price movement exceeds a volatility-based threshold and directional pressure passes defined limits.
-Volatility Gate - two selectable modes (ATR + Percentile or Highest ATR legacy) adapt sensitivity to recent volatility and candle-body variation.
-Higher-Timeframe Confirmation (optional) — aligns short-term direction with a higher-timeframe bias for additional confluence.
-Quality Filter - validates candles by body-to-ATR ratio to reduce noise and avoid extreme bars; optional session-time constraint available.
-Cooldown - time- or bar-based delay preventing repetitive triggers.
-Delayed Confirmation - optional waiting stage to ensure conditions persist before confirming a setup; opposite signals cancel pending ones.
-Reverse on Adverse Move — flips directional state after a counter-move exceeding defined thresholds (points, ticks, or ATR×).
-ATR Setups (TP/SL) — on each signal bar, plots a protective SL and TP1–TP5 from volatility multiples, plus a highlighted Entry Zone visualizing the active risk area.
Alerts
Setup Long / Setup Short — one-shot alerts triggered on the bar where a setup appears (close-only or real-time).
Why it’s different and not a simple mashup
OrderVibe HF prioritizes reaction speed, volatility awareness, and clarity of short-term context rather than pattern recognition.
It merges flow-based directional scoring, adaptive volatility control, confirmation/cooldown management, and ATR-mapped setups into a coherent analytical process.
Usage
Optimized for XAUUSD, M1 timeframe, and Heiken Ashi candles.
Can operate on any symbol or timeframe; adjust sensitivity, ATR length, and thresholds to match your market.
Intended for contextual analysis and journaling, not automated execution.
Always test before live use.
How OrderVibe HF differs from “OrderVibe Indicator”
HF does not use order-block or support/resistance clustering.
It focuses on flow-score direction analysis, adaptive volatility gates, confirmation and reversal mechanics, and ATR-based multi-target setups.
The original Indicator emphasizes broader structural mapping and slower swing analysis.
Disclaimer
Analytical visualization tool only.
This is not financial advice and does not guarantee performance outcomes.
Use independent judgment and sound risk management.
ALMA & EMA Ribbon by zdmreThis indicator combines a unique trend-following signal with a classic EMA ribbon to provide a clear view of the market trend.
The main signal line is not based on a typical ATR. Instead, it uses an Arnaud Legoux Moving Average (ALMA) as its baseline and calculates support/resistance bands using Standard Deviation. This creates a responsive trend line that adapts well to volatility. This is paired with a simple EMA Ribbon to help confirm momentum.
What It Does
ALMA + SD Trend Line: This is the core of the indicator. It uses an ALMA as the baseline (instead of a simple MA) and Standard Deviation for the bands. This tends to be more responsive than many traditional trend-following indicators.
Buy/Sell Signals: Simple "B" and "S" labels appear on your chart when the trend is calculated to have changed direction.
EMA Ribbon: A standard Fast/Slow EMA ribbon is plotted to give you a secondary confirmation of momentum. The fill between the EMAs changes color (green for bull, red for bear).
On-Screen Dashboard: A clean info panel in the corner shows you the current status of all components at a glance:
Current Signal (Long/Short)
Price vs. Trend Line (Above/Below)
Trend Strength (%)
EMA Trend (Bullish/Bearish)
Momentum
Fully Customizable: You can toggle every visual element on or off (the signals, the ribbon, the bar coloring, the dashboard) to keep your chart clean.
Settings
Trend Settings:
Factor: This is the main setting. It's the Standard Deviation multiplier. A higher value makes the line less sensitive (fewer signals). A lower value makes it more sensitive (more signals).
SD Length: The lookback for the Standard Deviation.
ALMA Settings:
ALMA Length, Sigma, Offset: Standard controls for the ALMA's smoothness and responsiveness.
EMA Ribbon:
Fast EMA & Slow EMA: Set the lengths for your ribbon.
Visual Settings:
Checkboxes to toggle all visual components (signals, ribbon, dashboard, etc.).
You can set up alerts in TradingView for the following events:
🟢 Long Signal: Triggers on a new "B" (Buy) signal.
🔴 Short Signal: Triggers on a new "S" (Sell) signal.
⚠️ Price Crossed Trend: Triggers any time the price closes across the main trend line.
#DYOR


Smart Trend MASmart Trend MA - Adaptive Moving Average with VHF Technology
WHAT IT IS
Smart Trend MA is an adaptive moving average indicator based on Perry Kaufman's KAMA (Kaufman Adaptive Moving Average) algorithm enhanced with VHF (Vertical Horizontal Filter) technology. The indicator automatically adjusts its responsiveness to current market conditions, becoming faster during trending markets and slower during ranging conditions to reduce false signals.
ORIGINALITY AND VALUE
This implementation combines KAMA's efficiency ratio methodology with dynamic VHF period adaptation, creating an intelligent system that self-adjusts without manual intervention. Unlike standard moving averages with fixed periods, Smart Trend MA dynamically calculates optimal sensitivity based on market structure. The gradient color visualization system provides immediate trend strength feedback. This indicator adds value by reducing whipsaw trades in choppy markets while maintaining responsiveness during genuine trends.
HOW IT WORKS
The indicator employs Kaufman's efficiency ratio calculation to measure directional movement relative to volatility. When markets trend strongly, the efficiency ratio increases and the moving average responds quickly to price changes. During sideways or choppy markets, the efficiency ratio decreases and the moving average becomes smoother to filter noise.
The VHF adaptation layer adds a second dimension of intelligence by dynamically adjusting the calculation period based on vertical price movement relative to horizontal price range. This dual-adaptive approach creates a moving average that automatically optimizes itself for current conditions without requiring parameter changes.
The gradient color system uses slope calculation to display trend strength visually. Stronger trends display more saturated colors while weaker or consolidating markets show muted tones.
FEATURES
- KAMA algorithm with efficiency ratio calculation
- VHF adaptive period adjustment for enhanced responsiveness
- Gradient color visualization with 7 color scheme options
- Range detection line showing mid-range support and resistance levels
- Multi-timeframe compatible across all markets
- No repainting - calculations use confirmed bar data
- Native TradingView alert system with 6 alert conditions
SETTINGS AND PARAMETERS
Length: Base calculation period (default 21). Higher values produce smoother lines suitable for position trading. Lower values (9-12) increase sensitivity for shorter timeframes.
Fast Factor: Controls maximum responsiveness during strong trends (default 0.66). Higher values increase reaction speed but may produce more noise.
Slow Factor: Controls minimum responsiveness during ranging markets (default 0.0645). Lower values create more smoothing during consolidation.
Smoothing Method: Optional additional smoothing using Hann Window or T3 methods. Default "None" recommended for most applications.
Enable VHF Adaptiveness: Activates dynamic period adjustment based on market structure. Recommended to keep enabled.
Range Detection: Displays mid-range line calculated from recent highs and lows. Useful for identifying support and resistance zones.
Gradient Colors: Choose from 7 color schemes or disable for simple two-color trend indication.
USAGE INSTRUCTIONS
The indicator plots a single adaptive line on the price chart. When the line slopes upward, market conditions favor bullish positions. When the line slopes downward, market conditions favor bearish positions. The gradient color intensity indicates trend strength - more saturated colors signal stronger directional movement.
The range detection line identifies the midpoint between recent price extremes. Price above the range line suggests bullish bias while price below suggests bearish bias. This line often acts as dynamic support or resistance.
For best results, combine Smart Trend MA with volume analysis and price action confirmation. The indicator works across all timeframes and markets including forex, cryptocurrency, stocks, and indices.
ALERT CONDITIONS
The indicator provides six native alert conditions through TradingView's alert system:
Bullish Trend: Triggers when the moving average direction changes to upward
Bearish Trend: Triggers when the moving average direction changes to downward
Strong Bullish: Triggers when slope exceeds threshold indicating strong upward momentum
Strong Bearish: Triggers when slope exceeds threshold indicating strong downward momentum
Price Cross Above: Triggers when price crosses above the moving average
Price Cross Below: Triggers when price crosses below the moving average
TECHNICAL NOTES
This indicator uses lookahead_off to ensure calculations reflect only confirmed bar data, preventing repainting issues. The default 21-period setting represents a Fibonacci number statistically proven optimal for swing trading across multiple markets.
LIMITATIONS
Past performance does not guarantee future results. This indicator provides trend analysis based on historical price data and does not predict future price movement. Best results occur in markets with clear directional bias. During extreme volatility or news events, all technical indicators including adaptive moving averages may produce less reliable signals.
No indicator should be used as the sole basis for trading decisions. Combine Smart Trend MA with proper risk management, additional analysis methods, and thorough understanding of the markets you trade.

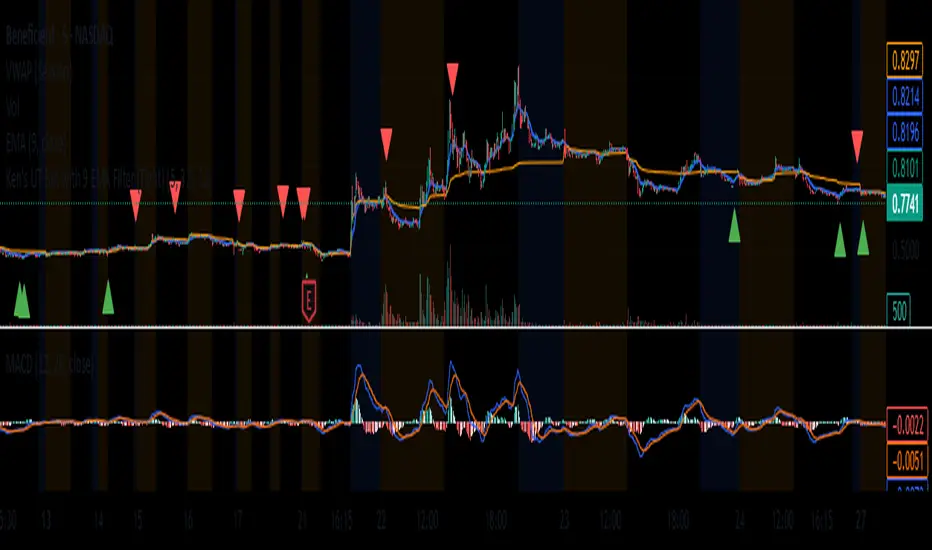
Inyerneck UT Bot with 9 EMA Filter With Signals (Tight) v: 4.20this script is a customized version of the UT bot, enhanced with 9ema trend filter for cleaner entries.designed for short term traders to reduce noise and avoid false signals during choppy price action. youll only see signals when price action confirms momentum aligned with trend as defined by EMA. try adjusting sensitivity and ATR period to your liking. my current setting is ATR 6,Sensitivity 3.8,EMA 9 to 11...
3s CISD 9 EMA- [CT]Private Algorithm that is invite only. It is only spread through word of mouth and is not available on any website.
This algorithm will give you the best chance at being green and is even better when following specific plays of someone or yourself.
This is not supposed to guarantee profit and the team are not financial advisors. Please always manage your own risk according to your risk tolerance .
Overview
The 3s CISD 9 EMA – indicator is a versatile market structure and sentiment tool that combines CISD (Change in Structural Direction) levels, EMA-based trend bias, and candlestick pattern detection to identify key turning points and continuation setups in price action.
It’s designed for traders seeking precision entries during structural shifts or reversals across any symbol or timeframe.
Key Features
🟡 9 EMA Trend Bias
Plots a 9-period Exponential Moving Average (EMA) to define short-term trend direction.
Optional bar coloring (green for bullish, red for bearish) helps visualize momentum shifts.
📊 CISD (Change in Structural Direction) Levels
Detects bullish and bearish pullbacks and confirms CISD breaks when price structure shifts direction.
Auto-draws labeled horizontal lines (+CISD / -CISD) at critical breakout points.
Supports line style customization (Solid, Dotted, Dashed), width, and extension for clarity.
Option to keep or clear old CISD levels.
Includes alert conditions when a new CISD formation is confirmed.
Real-time state table shows current structure bias: Bullish or Bearish.
📈 Candlestick Signal Suite
1. 3-Line Strike Pattern
Detects both bullish and bearish 3-line strike formations.
Useful for identifying exhaustion moves or reversals after a trend leg.
Configurable on/off toggles for each direction.
2. Engulfing (Big A$$ Candles)
Highlights large engulfing candles that dominate the previous bar.
Distinguishes bullish engulfing (orange triangle up) and bearish engulfing (blue triangle down).
Integrated alert conditions for automated notifications.
Customization Options
Toggle visibility for EMA, bar colors, CISD lines, labels, and pattern signals.
Adjustable line width, style, and extension length for CISD visuals.
Selectable table position (Top Right, Bottom Center, etc.).
Separate alert controls for bullish and bearish CISD events.
Alerts
“Bullish CISD Formed” → Indicates potential upward structural shift.
“Bearish CISD Formed” → Indicates potential downward structural shift.
Engulfing pattern alerts → Triggered when large reversal candles appear.
How to Use
Enable EMA and bar color for quick trend visualization.
Watch for CISD line breaks to anticipate structural changes.
Confirm entries with 3-Line Strike or Engulfing candle signals.
Use the State Table to track current directional bias.
Optional: Set alerts for CISD events to stay informed automatically.
Best Used For
Structure-based trading (ICT, Wyckoff, or price-action styles).
Identifying short-term reversals or continuation setups.
Multi-timeframe confluence analysis.
Momentum confirmation with 9 EMA and pattern alignment.
Disclaimer:
This script is for educational and analytical purposes only. Past performance does not guarantee future results. Always perform independent analysis before making trading decisions.

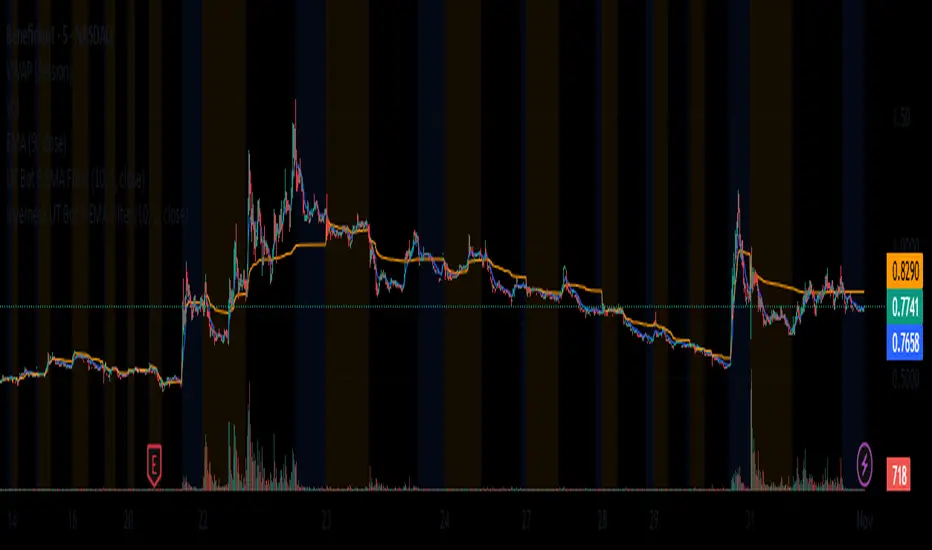
Inyerneck UT Bot 9 EMA V.sthis script is a custom ut bot signal generator using a 9 ema filter and atr based thresholds. it shows buy/sell signals based on crossover logic and works well for volitality based set ups. created by inyerneck
HEKO-Acumulación/Distribución/ObjetivoHEKO — Accumulation / Distribution / Targets + Pi-Cycle is an all-in-one indicator designed for anyone who wants to spot smart-buy zones (accumulation) and smart-sell zones (distribution), filter them with simple rules, and turn them into quantified targets (blue triangle)—all without prior knowledge.
What it does, in 4 points
Detects candles with buying traits (high volume, high close, positive CMF, non-extreme RSI) and selling traits (upper rejection, low close, negative CMF, high RSI).
Filters signals to show them only when price is below all the 200s (green) or above all the 200s (red), reducing “noise” in the middle zones.
Generates automatic targets from the day’s high of the green signal (visible point), and confirms with a blue triangle when that target is reached.
Logs and numbers each green-point ↔ blue-triangle pair, adds a target average, simulates an educational assessment, and optionally marks tops with Pi-Cycle.
Recommended workflow
Turn on the moving averages (MA1…MA5) and the 200-channel filter (recommended).
Adjust sensitivity: volume (multipliers), closePct (80–90%), wickFrac (35–50%), RSI Low/High if you want to filter extremes.
Watch for green signals below the 200 channel. When one appears, the system sets a target (= day’s high × (1 + %)).
Wait for the blue triangle. When it touches the target you’ll see it on price and, if you want, in the panel as well.
You can number each green-blue pair for tracking.
Use Pi-Cycle as a macro top alert (especially in BTC/crypto or, with stock mode, in equities).
Check the TG average and, if useful, the assessment (simulation) to feed back into your parameters.
Key options and why they matter
200 channel (4h and 1D): separates “cheap zones” (green) from “expensive zones” (red).
CMF and volume: quantify whether buying/selling shows real commitment.
Close within the candle: avoids “indifferent” candles and favors decisive ones.
Targets from the daily high: reduces “close” bias and gives realistic room for the chosen %.
Point-triangle pairing: traceability. You know which target comes from which signal.
Pi-Cycle: cycle warning that helps you avoid “falling in love with tops.”
Best practices
Start conservative (default parameters).
Adjust mult and closePct if you see too many or too few signals.
In very volatile assets, raise wickFrac and multDist for reds.
Review the TG average per asset: it guides you on whether your target % is ambitious or too low.
Remember: this is not a complete strategy; it’s a reading and targeting tool. Use it with risk management and your own plan.
Limits and reminders
No indicator eliminates false positives. Filters only reduce noise.
Targets are triggered by the candle’s high. A spike can hit the % instantly.
Pi-Cycle isn’t magic. It’s a historically sensible pattern—useful as an alert, not as dogma.

