[Greeny] RTH Only Naked VPOCWhat it does
Calculates and displays daily Volume Point of Control (VPOC) levels based on RTH (Regular Trading Hours) session only. Tracks which VPOCs remain "naked" (untouched) and which have been hit - but only counts hits during RTH hours, ignoring overnight/globex touches.
Key Features
One VPOC per trading day calculated from entire RTH session volume profile
RTH-only hit detection - levels only marked as hit when touched during RTH, not overnight
Works on all timeframes - daily, hourly, or any chart timeframe
Volume-based filtering - automatically skips low-liquidity sessions (pre-front-month contract data)
Visual markers - small dash on origin bar shows where each VPOC was, even after being hit
Visual Guide
Yellow dashed line - Naked VPOC (not yet touched during RTH)
White dashed line - Hit VPOC (was touched during RTH)
Small dash on candle - POC origin marker
Settings
Display options: Toggle to show only naked POCs, customize hit/naked colors, adjust line width and style (solid/dashed/dotted), enable/disable line extension and origin markers.
RTH Session: Configure start and end time in NY timezone. Default is 9:30-16:00 (US equity market hours), which equals 15:30-22:00 Budapest time.
Advanced: Adjust volume profile resolution (default 250 bins), data source timeframe for calculations (5min recommended for daily charts), and minimum volume threshold to filter out low-liquidity sessions like pre-rollover contract data (default 10% of average).
Best For
ES/MES, NQ/MNQ futures traders
Mean reversion strategies using VPOC as support/resistance
Auction Market Theory practitioners
Anyone wanting clean RTH-only volume profile levels
Note on Contract Rollovers
When using specific contract symbols (e.g., ESH2026 instead of ES1!), the script may show many naked VPOCs from months before the contract became active. This happens because futures contracts have very low liquidity before becoming the front-month, creating unreliable VPOCs with gaps that never get hit. The volume filter helps reduce this, but you may need to increase the "Min Volume % of Average" setting or simply ignore older levels when viewing back-month data.
Naked

Multiple Time Frame Stoch-RSIThis indicator is designed to show users the values for default stochastic RSI and default RSI settings across multiple time frames.
I have made many bad trades focusing too closely on one particular time frame and indicators that suggest the price will move one way, to be superseded by a higher timeframe pushing price in another direction.
The timeframes are customisable so you can select your own timeframes, but the default timeframes chosen here are part of the BareNaked Crypto or Naked Nation strategy, looking at timeframes in multiples of 3 for lower timeframes.
The idea in its simplest form is that when timeframes like the 3/6/9m are all over sold or over bought (coloured red or green) then it could be a suitable time to place an order. Or at least be more favourable for your trade.
This indicator as with all indicators is designed as a tool to add to whatever arsenal of strategy or tools you are already using and does not constitute financial advice, just be cause 3/6/9m is in red or green does not guarantee that the trade will go your way.
The orange on the timeframes are generally designed to show users where price can reverse so for example if the stochastic 3m is at 10 and in green, but the 9m is at 65 in orange, it could be that a push up is not finished and the 9m drop from oversold to 65 could be reversed due to a low 3m stochastic number and then 9m goes from 65 back up to 100, and vice versa.
The arrows for direction also allow you to quickly deduce the direction of the stochastic RSI, ^ up, V down, and stable -. this should allow you to see if the stochastic has been rising and is beginning to turn around or not.

portfolio_strikesA simple script for keeping track of your options portfolio. Basically, you can write one line of code per strategy (single, vertical, or strangle) to keep a line drawn on the underlying's chart, at the strike price, from the current bar until expiration. See the comments at the top of the code for more explanation.

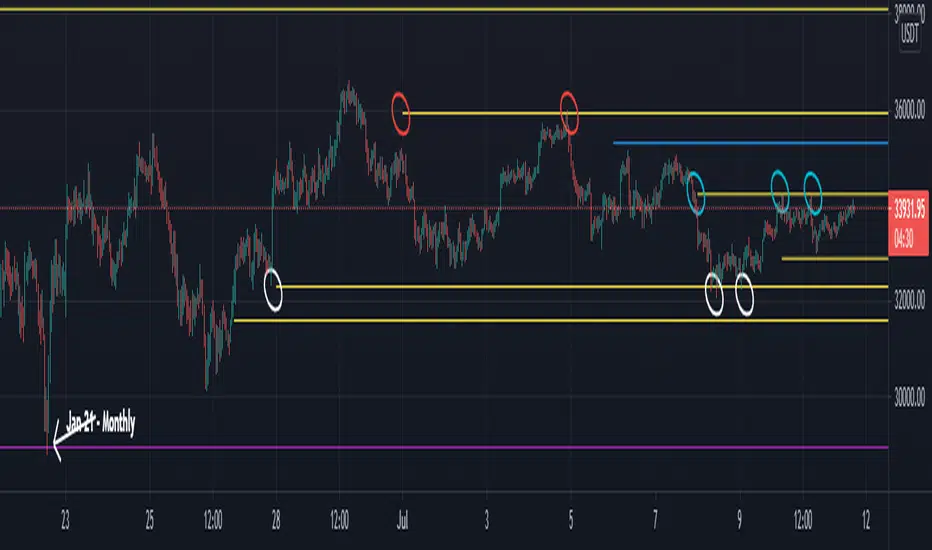
Naked - Daily Weekly MonthlyUser request for Naked Daily Weekly Monthly Opens.
This indicator plots the Daily Weekly Opens (the day after day after creation), they then will stay on the chart until a candle close is completed on the other side of the plot.
In the above chart picture you can see how previous monthly and daily opens have acted as support and resistance.
Thanks go to:
StackOverFlow Bjorn Mistiaen
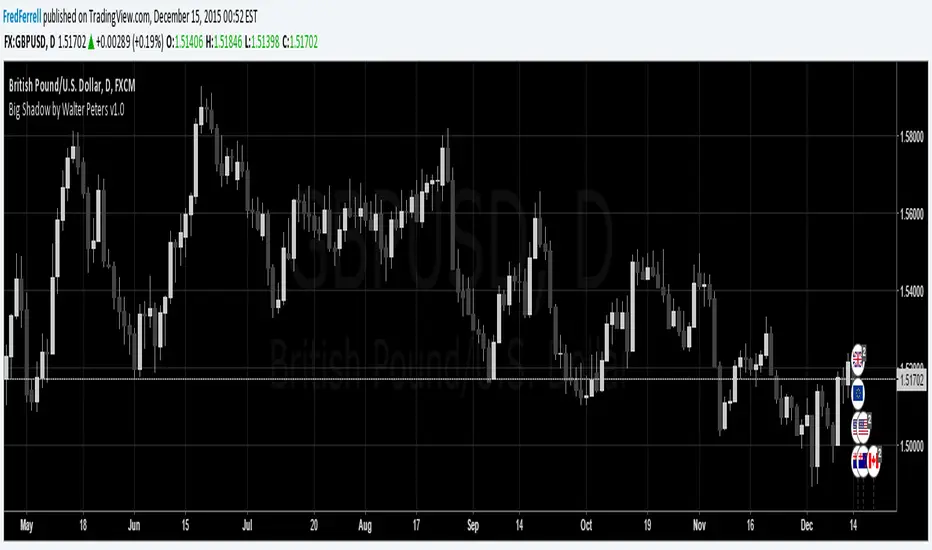
Naked Forex Trading Strategy v2v1 Big Shadow candles based on "How Naked Trading Works" video by Walter Peters: https://youtu created by AlistarElvis
v2 Bugfix calculation largest candle, added parameter for alternative calculation largest candle

Big Shadow by Walter Peters v1.0This is an indicator for the Big Shadow (engulfing candle) that Walter Peters teaches in his course and book "Naked Forex". I hope this will help other "Naked" traders to identify this candle pattern.