House Rules SuperTrend Strategy (ATR-Based, Non-Repainting)📝 DESCRIPTION
Overview
The House Rules SuperTrend Strategy is a clean, rule-based trading strategy built using Pine Script® v6.
It is designed for transparent backtesting, non-repainting signals, and simple trend-following execution across all markets and timeframes.
This strategy uses TradingView’s built-in SuperTrend indicator, which is derived from Average True Range (ATR), to identify trend direction changes and generate long and short trades.
How the Strategy Works
Long Entry
A long position is opened when the SuperTrend flips from bearish to bullish
This confirms a potential upward trend shift
Short Entry
A short position is opened when the SuperTrend flips from bullish to bearish
This confirms a potential downward trend shift
Exits
Positions are closed when either:
The opposite SuperTrend signal appears, or
The ATR-based Stop Loss or Take Profit is reached (if enabled)
All signals are calculated on confirmed candle closes only, ensuring accurate and fair backtesting.
Risk Management
Optional ATR-based Stop Loss
Optional ATR-based Take Profit
Position sizing based on percentage of equity
Commission included for realistic performance results
All parameters are user-adjustable from the settings panel.
Backtesting & Transparency
This is a strategy, not an indicator
No repainting
No future data usage
No hidden filters
No lookahead bias
Fully compatible with TradingView’s Strategy Tester
Users are encouraged to test different symbols, timeframes, and parameter values to suit their trading style.
Recommended Use
This strategy can be used on:
Cryptocurrencies
Forex
Stocks
Indices
Futures
It performs best in trending market conditions and may underperform during low-volatility or ranging markets.
Disclaimer
This script is provided for educational and research purposes only.
It is not financial advice. Always test and validate strategies before using them in live trading.
Non-repainting

Dynamic Flow Ribbon [Adaptive]The Dynamic Flow Ribbon is a next-generation trend-following tool designed to solve the two biggest problems traders face: Lag and Noise .
Unlike traditional Moving Averages (SMA/EMA) that are often too slow to catch reversals or too sensitive to chop, this indicator utilizes Rational Quadratic Kernel Smoothing . This advanced mathematical approach creates a "Flow Ribbon" that hugs price action tightly during trends while remaining silky smooth, filtering out the random noise that leads to false signals.
This is not just a crossover indicator; it is a complete Market Regime Detector . It automatically identifies when the market is trending and when it is ranging, helping you stay out of dangerous "chop" zones.
Why Use This?
Zero-Lag Smoothing: Experience the responsiveness of a fast EMA with the smoothness of a slow SMA.
Chop Filter: The ribbon automatically turns Gray when volatility (ADX) drops, signaling you to sit on your hands and preserve capital.
Visual Clarity: No messy lines. Just a clean, glowing ribbon that tells you the trend direction instantly.
How It Works
The indicator calculates two dynamic curves:
Fast Flow Line: Tracks immediate price action using a tight kernel window.
Base Flow Line: A slower, weighted baseline that acts as the trend anchor.
The Ribbon: The space between these lines forms the "Ribbon."
Green (Bullish): Fast Flow > Base Flow. The trend is Up.
Red (Bearish): Fast Flow < Base Flow. The trend is Down.
Gray (Flat): Volatility is too low (ADX < Threshold). The market is sideways.
How to Trade
This tool is best used for Trend Continuation and Reversal Catching .
The Entry: Wait for a Crossover Signal (Small Circle).
Buy when the Ribbon flips Green.
Sell when the Ribbon flips Red.
The Filter: If the Ribbon is Gray , ignore all signals. This prevents you from getting whipsawed in a ranging market.
The Exit: You can ride the trend until the Ribbon flips color, or use your own support/resistance targets.
Settings
Bandwidth (Smoothness): Adjusts the sensitivity of the kernel. Higher values = smoother ribbon (better for swing trading). Lower values = faster reaction (better for scalping).
Trend Filter: Toggle the ADX-based chop filter on/off.
Visuals: Fully customizable colors to match your chart aesthetic.
Pro Tip: Combine for Maximum Accuracy
While the Dynamic Flow Ribbon is excellent for Trend Direction, it does not plot Support & Resistance levels.
For the ultimate trading setup, I highly recommend pairing this with my AIO Pivot Master
or any other pivot indicator, which you can easily find on TradingView.
Use Dynamic Flow to determine the Direction .
Use AIO Pivot Master to find your Entry and Exit targets .
Disclaimer
For Educational and Informational Purposes Only
This indicator is provided for educational and informational purposes only and DOES NOT constitute financial, investment, or trading advice. It does not predict future market movements with certainty.
Risk Warning
Trading in financial markets (Stocks, Crypto, Futures, Forex, etc.) involves a high degree of risk and may not be suitable for all investors. You could lose some or all of your initial investment. Past performance of any trading system or methodology is not necessarily indicative of future results.
No Liability
The author of this script assumes no responsibility or liability for any errors or omissions in the content of this indicator, or for any trading losses or damages incurred as a result of using this tool. Users are solely responsible for their own trading decisions and should always use proper risk management. By using this script, you acknowledge and agree to these terms.

Delta Hedging Pressure📊 COT Delta Hedging Pressure – Institutional Sentiment Indicator
This indicator visualizes institutional hedging pressure by aggregating delta-style positioning into a clean, session-aware sentiment framework.
Instead of guessing direction, it shows who is likely hedging vs. pressing, helping traders align intraday execution with higher-timeframe positioning.
🔍 What This Indicator Does
Calculates cumulative hedging pressure using price-based delta logic
Classifies market state into:
Bullish (positive hedge pressure)
Bearish (negative hedge pressure)
Neutral (balanced flow)
Resets cleanly by session or user-defined period
Visualizes sentiment using:
Background shading
Labels
Cumulative plots
🧠 How Traders Use It
Directional bias filter (trade only with sentiment)
Context for FVGs, liquidity raids, and pullbacks
Avoids chop by identifying neutral hedge conditions
Pairs especially well with:
XAUUSD
Index CFDs
Futures / CFD hybrids
⚙️ Key Features
Session-aware cumulative logic
Adjustable sensitivity and lookback
Clean visual design (no clutter)
Non-repainting calculations
Works on 1m → HTF
⚠️ Important Notes
This is a context tool, not a signal generator
Best used alongside price structure and risk management
Designed for discipline and alignment, not overtrading
🎯 Ideal For
Scalpers & intraday traders
Traders using:
Fair Value Gaps (FVG)
Liquidity sweeps
Session-based models
Traders transitioning from prop logic to personal capital
🧩 Final Thought
This indicator answers one question:
“Is the market hedging or pressing — and should I be aggressive or patient?”
If you trade with structure, this keeps you on the right side.

Quality-Controlled Trend Strategy v2 (Expectancy Focused)This script focuses on quality control rather than curve-fitting.
No repainting, no intrabar tricks, no fake equity curves.
It uses confirmed-bar entries, ATR-based risk, and clean trend logic so backtests reflect what could actually be traded live.
If you publish scripts, this is the minimum structure worth sharing.
Why this script exists
TradingView’s public scripts are flooded with:
repainting indicators
no stop-loss logic
curve-fit entries that collapse live
strategies that look good only in hindsight
This script is intentionally boring but honest.
No repainting.
No intrabar tricks.
No fake equity curves
The goal is quality control, not hype.
What this strategy enforces
✔ Confirmed bars only
✔ Single source of truth for indicators
✔ Fixed risk structure
✔ No signal repainting
✔ Clean exits with unique IDs
✔ Works on any liquid market
Trading Logic (simple & auditable)
Trend filter
EMA 50 vs EMA 200
Entry
Pullback to EMA 50
RSI confirms momentum (not oversold/overbought)
Risk
ATR-based stop
Fixed R:R
One position at a time
This is the minimum bar for a strategy to be considered publish-worthy.
Why this helps TradingView quality
Most low-value scripts fail because they:
hide repainting logic
skip exits entirely
use inconsistent calculations
rely on hindsight candles
This strategy forces discipline:
every signal is confirmed
every trade has defined risk
behavior is repeatable across symbols & timeframes
If more scripts followed this baseline, TradingView’s public library would be far more usable.

Market Acceptance Envelope [Interakktive]The Market Acceptance Envelope (MAE) is a diagnostic tool that shows where price statistically belongs — not where it might go. Unlike traditional bands that expand with volatility, MAE expands with acceptance: regions where price rotates comfortably, efficiency drops, and the market agrees on fair value.
This is the anti-Bollinger thesis: bands should represent where price IS accepted, not where it MIGHT reach based on standard deviation.
█ USAGE
The filled corridor represents the current acceptance zone — where price has demonstrated rotational behavior with low directional efficiency. When price is inside the corridor, it's "home." When outside, it's exploring territory the market hasn't yet accepted.
For discretionary traders, MAE provides instant context: "Is price where it belongs, or is it extended?"
For systematic traders, the exported values (confidence, asymmetry, position) can inform position sizing and filter logic.
█ ACCEPTANCE CENTROID
Unlike traditional bands centered on a moving average, MAE uses an Acceptance Centroid — a time-weighted price level where acceptance behavior concentrates. The centroid is calculated by weighting price by:
• Inverse efficiency (low efficiency = high acceptance)
• Volatility stability (stable vol = higher weight)
• Dwell factor (time spent near level)
This means the centroid drifts toward where price actually rotates, not simply where it averages.
█ ASYMMETRIC BOUNDARIES
MAE calculates upper and lower boundaries independently. Markets rarely treat up and down equally — during uptrends, the upper boundary may be wider (more accepted upside exploration), while the lower boundary stays tight (quick rejection of dips).
This asymmetry is visible on the chart and exported as a metric (-1 to +1).
█ CONFIDENCE-BASED VISIBILITY
The corridor's opacity reflects acceptance confidence:
• High confidence → clearly visible corridor (price is in accepted rotation)
• Low confidence → faded corridor (trending/directional market, acceptance not established)
When the corridor fades, it's telling you: "Acceptance hasn't been earned here yet."
█ WHAT THIS INDICATOR IS
• A diagnostic acceptance envelope showing where price statistically belongs
• Asymmetric by design — upper and lower calculated independently
• Confidence-weighted visibility — fades when acceptance is not earned
• Non-repainting — uses closed-bar data only
█ WHAT THIS INDICATOR IS NOT
• NOT Bollinger Bands (no standard deviation around a mean)
• NOT Keltner Channels (no ATR-scaled envelope)
• NOT a signal generator — no touches = signals philosophy
• NO arrows, NO entries/exits, NO buy/sell recommendations
█ HOW IT WORKS
MAE uses an acceptance-weighted calculation approach:
1. ACCEPTANCE WEIGHT
Each bar receives a weight based on:
• Efficiency: (1 - efficiency) — low efficiency = rotational = high acceptance
• Volatility Stability: stable vol environment = higher weight
• Dwell Factor: price staying near central tendency = higher weight
2. ACCEPTANCE CENTROID
Weighted average of price using acceptance weights:
centroid = Σ(price × weight) / Σ(weight)
Smoothed adaptively — faster during drift, slower when stable.
3. ASYMMETRIC BOUNDARIES
Upper and lower distances calculated separately:
• rngUp = acceptance-weighted average of (price - centroid) when price > centroid
• rngDn = acceptance-weighted average of (centroid - price) when price < centroid
4. CONFIDENCE SCORE
Composite of average acceptance weight, volatility stability, and centroid stability.
Maps to corridor opacity: high confidence = visible, low confidence = faded.
█ SETTINGS
Market Acceptance Envelope — Core
• Acceptance Lookback (20): Bars to evaluate for acceptance conditions. Higher = smoother, slower response.
• Preset (Swing): Scalper = tight/fast, Swing = balanced, Position = wide/stable.
• Envelope Sensitivity (1.0): Width multiplier. Higher = wider corridor.
Market Acceptance Envelope — Visuals
• Show Corridor (true): Display the acceptance corridor.
• Show Centroid (false): Display the acceptance centroid line.
Market Acceptance Envelope — Data Window
• Show Data Window Values (false): Export MAE metrics for external use.
█ EXPORTED VALUES
When Data Window is enabled:
• mae_upper: Upper boundary value
• mae_lower: Lower boundary value
• mae_centroid: Acceptance centroid value
• mae_width: Corridor width (upper - lower)
• mae_asymmetry: Asymmetry ratio (-1 to +1, negative = lower wider)
• mae_confidence: Acceptance confidence (0-100)
• mae_position: Price position (-1 = below, 0 = inside, +1 = above)
█ SUITABLE MARKETS
Works on all markets: Stocks, Futures, Forex, Crypto, Indices.
Works on all timeframes. Higher timeframes show more stable acceptance zones.
█ DISCLAIMER
This indicator is for educational and informational purposes only. It does not constitute financial advice. Past performance does not guarantee future results. Always conduct your own analysis and use proper risk management. This is a diagnostic tool — it provides context, not signals.

Continuation Suite v1 — 5m/15mContinuation Suite v1 — 5m/15m (Non-Repainting, S/R + Trend Continuation)
What it does
Continuation Suite v1 is a practical intraday toolkit that combines non-repainting trend-continuation signals with auto-built Support/Resistance (S/R) from confirmed pivots. It’s designed for fast, liquid names on 5m charts with an optional 15m higher-timeframe (HTF) overlay. You get: stacked-EMA bias, disciplined pullback+reclaim entries, optional volume/volatility gates, a “Strong” signal tier, solid S/R lines or zones, and a compact dashboard for fast reads.
⸻
Why traders use it
• Clear bias using fast/mid/slow EMA stacking.
• Actionable entries that require a pullback, a reclaim, and (optionally) a minor break of prior extremes.
• Signal quality gates (volume vs SMA, ATR%, ADX/DI alignment, EMA spacing, slope).
• Non-repainting logic when “Confirm on Close” = ON. Intrabar previews show what’s forming, but confirmed signals only print on bar close.
• S/R that matters: confirmed-pivot lines or ATR-sized zones, optional HTF overlay, and auto de-dup to avoid clutter.
⸻
Signal construction (no magic, just rules)
Bullish continuation (base):
1. Trend: EMA fast > EMA mid > EMA slow
2. Pullback: price pulls into the stack (lowest low or close vs EMA fast/mid over a lookback)
3. Reclaim: close > EMA fast and close > open
4. Break filter (optional): current bar takes out the prior bar’s high
5. Filters: volume > SMA (if enabled) and ATR% ≤ max (if enabled)
6. Cooldown: a minimum bar gap between signals
Bearish continuation (base): mirror of the above.
Strong signals: base conditions plus ADX ≥ threshold, DI alignment (DI+>DI- for longs; DI->DI+ for shorts), minimum EMA-spacing %, and minimum fast-EMA slope.
Reference stops:
• Longs: lowest low over the pullback lookback
• Shorts: highest high over the pullback lookback
Alerts are included for: Bullish Continuation, Bearish Continuation, STRONG Bullish, STRONG Bearish.
⸻
S/R engine (current TF + optional HTF)
• Builds S/R from confirmed pivots only (left/right bars).
• Choose Lines (midlines) or Zones (ATR-sized).
• Zones merge when a new pivot lands near an existing zone’s mid (ATR-scaled epsilon).
• Touches counter tracks significance; you can require a minimum to draw.
• HTF overlay (default 15m) draws separate lines/zones with tiny TF tags on the right.
• De-dup option hides current-TF zones that sit too close to HTF zones (ATR-scaled), reducing overlap.
• Freeze on Close (optional) keeps arrays stable intrabar; snapshots show levels immediately as bars open.
⸻
Presets
• Auto: Detects QQQ-like tickers (QQQ, QLD, QID) or SoFi; else defaults to Custom.
• QQQ: Tighter ATR% and EMA settings geared to index-ETF behavior.
• SoFi: Wider ATR allowances and longer mid/slow for single-name behavior.
• Custom: Expose all key inputs to tune for your product.
⸻
Dashboard (top-right)
• Preset in use
• Bias (Bullish CONT / Bearish CONT / Neutral)
• Strong (Yes/No)
• Volatility (ATR% bucket)
• Trend (ADX bucket)
• HTF timeframe tag
• Volume (bucket or “off”)
• Signals mode (Close-Confirmed vs Intrabar)
⸻
Inputs you’ll actually adjust
Trend/Signals
• Fast/Mid/Slow EMA lengths
• Pullback lookback, Min bars between signals
• Volume filter (vol > SMA N)
• ATR% max filter (cap excessive volatility)
• Require break of prior bar’s high/low
• “Strong” gates: min EMA slope, min EMA spacing %, ADX length & threshold
Support/Resistance
• Lines vs Zones
• Pivot left/right bars
• Extend left/right (bars)
• Max pivots kept (current & HTF)
• Zone width (× ATR), Merge epsilon (× ATR), Min gap (× ATR)
• Min touches, Max zones per side near price
• De-dup current TF vs HTF (× ATR)
Repainting control
• Confirm on Close: when ON, signals/SR finalize on bar close (non-repainting)
• Freeze on Close: freeze S/R intrabar with snapshot updates
• Show previews: translucent intrabar labels for what’s forming
⸻
How to use it (straightforward)
1. Load on 5-minute chart (baseline). Keep Confirm on Close ON if you hate repainting.
2. Use Bias + Strong + S/R context. If a long prints into HTF resistance, you have information.
3. Manage risk off the reference stop (pullback extreme). If ATR% reads “Great,” widen expectations; if “Poor,” size down or pass.
4. Alerts: wire the four alert types to your workflow.
⸻
Notes and constraints
• Designed for liquid symbols. Thin books and synthetic “volume” will degrade the volume gate.
• S/R is pivot-based. On very choppy tape, touch counts help. Increase min touches or switch to Lines to declutter.
• If your chart timeframe isn’t 5m, behavior changes because lengths are in bars, not minutes. Tune lengths accordingly.
⸻
Disclaimers
This is a research tool. No signals are guaranteed. Markets change, outliers happen, slippage is real. Nothing here is financial advice—use your own judgment and risk management.
⸻
Author: DaddyScruff
License: MPL-2.0 (Mozilla Public License 2.0)

HKM - Renko Emulator with EMA TrendThis is a Renko based Emulator to plot on any chart type which prints the box as printed on a Renko charts and is a Non-Repaint version. You can use either Traditional or ATR Method on current chart Timeframe. Option to plot an EMA Line is provided with Trend indication.

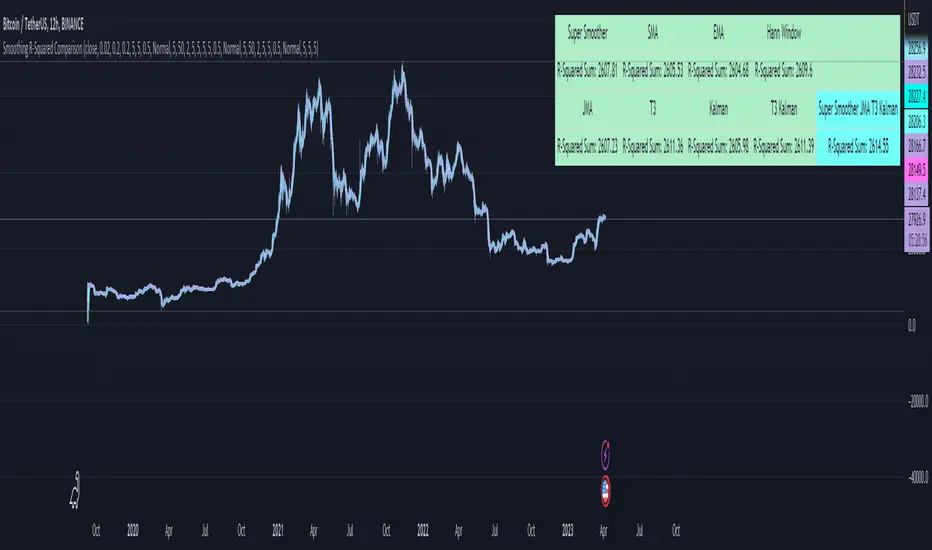
Smoothing R-Squared ComparisonIntroduction
Heyo guys, here I made a comparison between my favorised smoothing algorithms.
I chose the R-Squared value as rating factor to accomplish the comparison.
The indicator is non-repainting.
Description
In technical analysis, traders often use moving averages to smooth out the noise in price data and identify trends. While moving averages are a useful tool, they can also obscure important information about the underlying relationship between the price and the smoothed price.
One way to evaluate this relationship is by calculating the R-squared value, which represents the proportion of the variance in the price that can be explained by the smoothed price in a linear regression model.
This PineScript code implements a smoothing R-squared comparison indicator.
It provides a comparison of different smoothing techniques such as Kalman filter, T3, JMA, EMA, SMA, Super Smoother and some special combinations of them.
The Kalman filter is a mathematical algorithm that uses a series of measurements observed over time, containing statistical noise and other inaccuracies, and produces estimates of unknown variables that tend to be more accurate than those based on a single measurement.
The input parameters for the Kalman filter include the process noise covariance and the measurement noise covariance, which help to adjust the sensitivity of the filter to changes in the input data.
The T3 smoothing technique is a popular method used in technical analysis to remove noise from a signal.
The input parameters for the T3 smoothing method include the length of the window used for smoothing, the type of smoothing used (Normal or New), and the smoothing factor used to adjust the sensitivity to changes in the input data.
The JMA smoothing technique is another popular method used in technical analysis to remove noise from a signal.
The input parameters for the JMA smoothing method include the length of the window used for smoothing, the phase used to shift the input data before applying the smoothing algorithm, and the power used to adjust the sensitivity of the JMA to changes in the input data.
The EMA and SMA techniques are also popular methods used in technical analysis to remove noise from a signal.
The input parameters for the EMA and SMA techniques include the length of the window used for smoothing.
The indicator displays a comparison of the R-squared values for each smoothing technique, which provides an indication of how well the technique is fitting the data.
Higher R-squared values indicate a better fit. By adjusting the input parameters for each smoothing technique, the user can compare the effectiveness of different techniques in removing noise from the input data.
Usage
You can use it to find the best fitting smoothing method for the timeframe you usually use.
Just apply it on your preferred timeframe and look for the highlighted table cell.
Conclusion
It seems like the T3 works best on timeframes under 4H.
There's where I am active, so I will use this one more in the future.
Thank you for checking this out. Enjoy your day and leave me a like or comment. 🧙♂️
---
Credits to:
▪@loxx – T3
▪@balipour – Super Smoother
▪ChatGPT – Wrote 80 % of this article and helped with the research
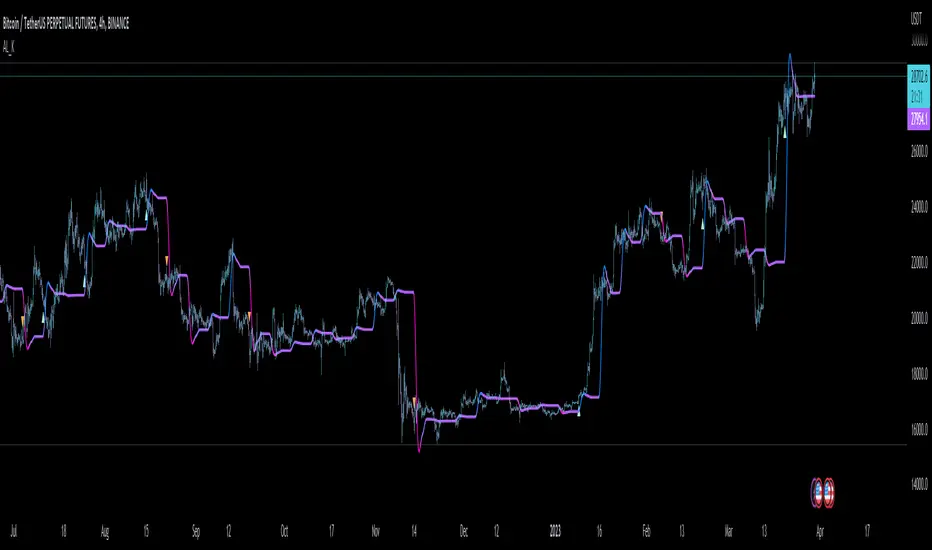
VHF Adaptive Linear Regression KAMAIntroduction
Heyo, in this indicator I decided to add VHF adaptivness, linear regression and smoothing to a KAMA in order to squeeze all out of it.
KAMA:
Developed by Perry Kaufman, Kaufman's Adaptive Moving Average (KAMA) is a moving average designed to account for market noise or volatility. KAMA will closely follow prices when the price swings are relatively small and the noise is low. KAMA will adjust when the price swings widen and follow prices from a greater distance. This trend-following indicator can be used to identify the overall trend, time turning points and filter price movements.
VHF:
Vertical Horizontal Filter (VHF) was created by Adam White to identify trending and ranging markets. VHF measures the level of trend activity, similar to ADX DI. Vertical Horizontal Filter does not, itself, generate trading signals, but determines whether signals are taken from trend or momentum indicators. Using this trend information, one is then able to derive an average cycle length.
Linear Regression Curve:
A line that best fits the prices specified over a user-defined time period.
This is very good to eliminate bad crosses of KAMA and the pric.
Usage
You can use this indicator on every timeframe I think. I mostly tested it on 1 min, 5 min and 15 min.
Signals
Enter Long -> crossover(close, kama) and crossover(kama, kama )
Enter Short -> crossunder(close, kama) and crossunder(kama, kama )
Thanks for checking this out!
--
Credits to
▪️@cheatcountry – Hann Window Smoohing
▪️@loxx – VHF and T3
▪️@LucF – Gradient
Chandelier Exit ZLSMA StrategyIntroduction
Heyo guys, I recently checked out some eye-catching trading strategy videos on YT and found one to test.
This indicator is based on the video.
Usage
The recommended timeframe is 5 min.
Signals
Long Entry => L Label
Price crosses above ZLSMA and Chandelier Exit shows Buy
Long Exit => green circle
Price crosses below ZLSMA
Short Entry => S Label
Price crosses below ZLSMA and Chandelier Exit shows Sell
Short Exit => orange circle
Prices crosses above ZLSMA
Ty for checking this out. Enjoy!
--
Credits to
@netweaver2011 - ZLSMA
@everget – Chandelier Exit

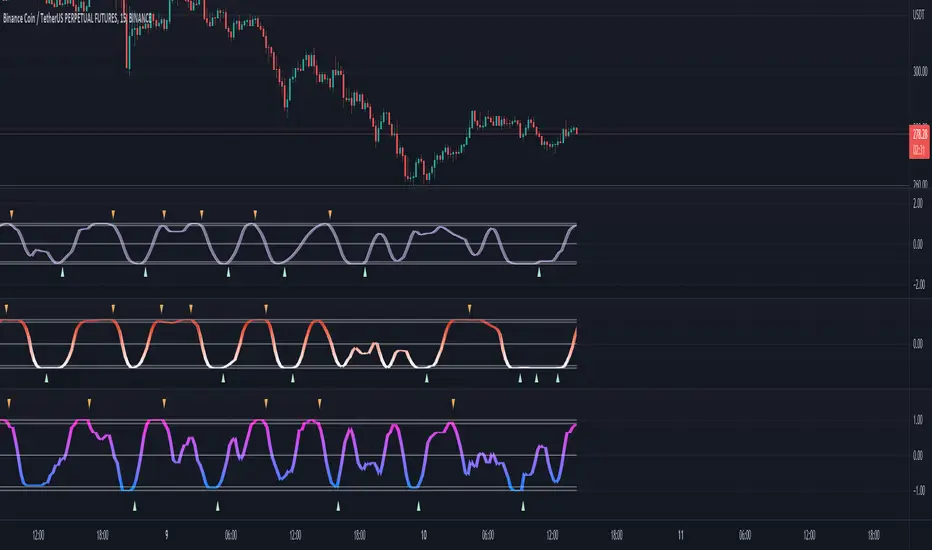
Adaptive Fisherized KSTIntroduction
Heyo guys, here is a new adaptive fisherized indicator of me.
I applied Inverse Fisher Transform, Ehlers dominant cycle analysis,
smoothing and divergence analysis on the Know Sure Thing (KST) indicator.
Moreover, the indicator doesn't repaint.
Usage
I didn't backtest the indicator, but I recommend the 5–15 min timeframe.
It can be also used on other timeframs, but I have no experience with that.
The indicator has no special filter system, so you need to find an own combo in order to build a trading system.
A trend filter like KAMA or my Adaptive Fisherized Trend Intensity Index could fit well.
If you find a good combo, let me know it in the comments pls.
Signals
Zero Line
KST crossover 0 => Enter Long
KST crossunder 0 => Enter Short
Cross
KST crossover KST MA => Enter Long
KST crossunder KST MA => Enter Short
Cross Filtered
KST crossover KST MA and KST above 0 => Enter Long
KST crossunder KST MA and KST under 0 => Enter Short
KST crossunder 0 => Exit Long
KST crossover 0 => Exit Short
More to read: KST Explanation
Enjoy and let me know your opinion!
--
Credits to
- @tista
- @blackcat1402
- @DasanC
- @cheatcountry

Adaptive Fisherized Stochastic Center of GravityIntroduction
I modified the script "Fisher Stochastic Center of Gravity" of @DasanC for this indicator.
I added inverse Fisher transform, cycle period adaptiveness mode (Ehlers) and smoothing to it.
Moreover, I added buy and sell and beautified some stuff.
Lastly, it is also non-repainting!
Usage
This indicator can be used like a normal stochastic, but I don't recommend divergence analysis on it.
That fisherization stuff seems to make the graphs unuseable for that because it tries.
It works well on every timeframe I would say, but lower timeframes are recommended, because of the fast nature of stochastic.
Usually it does a good job on entry confirmation for reversals and trend continuation trades.
Recommended indicator to combine with this indicator is RSI cyclic smoothed v2 .
This is the best RSI version I know. In trending market it is recommended to look more on the inner bands and in flat market it is recommended to look more on the outer bands.
When RSI shows oversold and this indicator shows a crossover of the Center of Gravity plot through the bottom line -> Long entry is confirmed
When RSI shows overbought and this indicator shows a crossunder of the Center of Gravity plot through the top line -> Short entry is confirmed
Settings
The adaptive mode is enabled by default to give you straight the whole indicator experience.
The default settings are optimized, but should be changed depending on the market.
An example:
Market has a low volatility and a high momentum -> I want a slower/higher length to catch the slower new highs and lows.
Market has higher volatility and a low momentum, -> I want a faster/lower length to catch the faster new highs and lows
Signals
Crossover
Buy -> cog crossover signalLine
Sell -> cog crossunder signalLine
Overbought/Oversold Crossover
Buy -> cog crossover lowerBand
Sell -> cog crossunder lowerBand
I use this indicator a lot, because I don't know a better stochastic on this community here.
@DasanC did an awesome work with his version I used as base for this script.
Enjoy this indicator and let the profit roll! 🔥
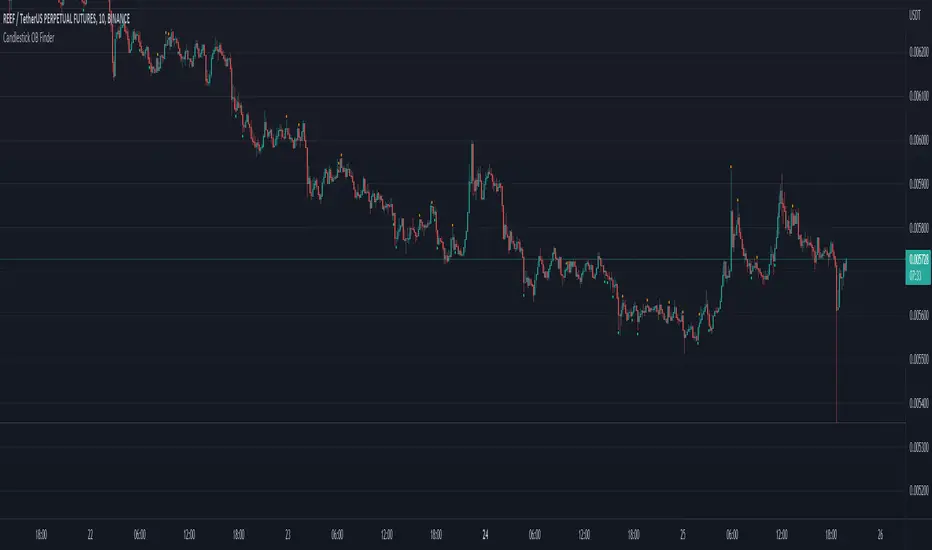
Candlestick OB FinderIntroduction
Hello, this here is a non-repainting candlestick indicator which is able to detect OB looking candlestick formations.
Usage
It can be used to confirm entries, but be aware that it produces a lot of false signals.
Somehow the swings tend to reverse at these points.
I recommend the 10–15 minutes timeframe.
I hope you enjoy this small indicator. :)