COT3 - Flip Strength Index - Invincible3This indicator uses the TradingView COT library to visualize institutional positioning and potential sentiment or trend shifts. It compares the long% vs short% of commercial and non-commercial traders for both Pair A and Pair B, helping traders identify trend strength, market overextension, and early reversal signals.
🔷 COT RSI
The COT RSI normalizes the net positioning difference between non-commercial and commercial traders over (N=13, 26, and 52)-week periods. It ranges from 0 to 100, highlighting when sentiment is at bullish or bearish extremes.
COT RSI (N)= ((NC - C)−min)/(max-min) x100
🟡 COT Index
The COT Index tracks where the current non-commercial net position lies within its 1-year and 3-year historical range. It reflects institutional accumulation or distribution phases.
Strength represents the magnitude of that positioning bias, visualized through normalized RSI-style metrics.
COT Index (N)= (NC net)/(max-min) x100
🔁 Flip Detection
Flip refers to the crossovers between long% and short%, indicating a change in directional bias among trader groups. When long positions exceed shorts (or vice versa), it signals a possible market flip in sentiment or trend.
For example, Pair B commercial flip is calculated as:
Long% = (Long/Open Interest)×100
Short% = (Short/Open Interest)×100
Flip = Long%−Short%
A bullish flip occurs when long% overtakes short%, and vice versa for a bearish flip. These flips often precede price trend changes or confirm sentiment breakouts.
Flip captures how far current positioning deviates from historical norms — highlighting periods of institutional overconfidence or exhaustion, often leading to significant market turns.
This combination offers a multi-layered edge for identifying when smart money is flipping direction, and whether that flip has strong conviction or is likely to fade.
..........................................................................................................................................................
Noncommercial

EURUSD COT Trend StrategyThis is a long term/investment type of strategy designed to have a good idea about where the big trend direction is headed.
Its logic, its made entirely on the COT report, mainly from looking into the net non comercial positions aka the speculators.
For bullish trend we look that the difference between long non comercial vs short non comercial is higher than 0
For bearish trend we look that the difference between long non comercial vs short non comercial is lower than 0.
This is mainly as an educational tool, for a full strategy, I recommend implement other things into it, like technical analysis or risk management.
If you have any questions, please let me know !

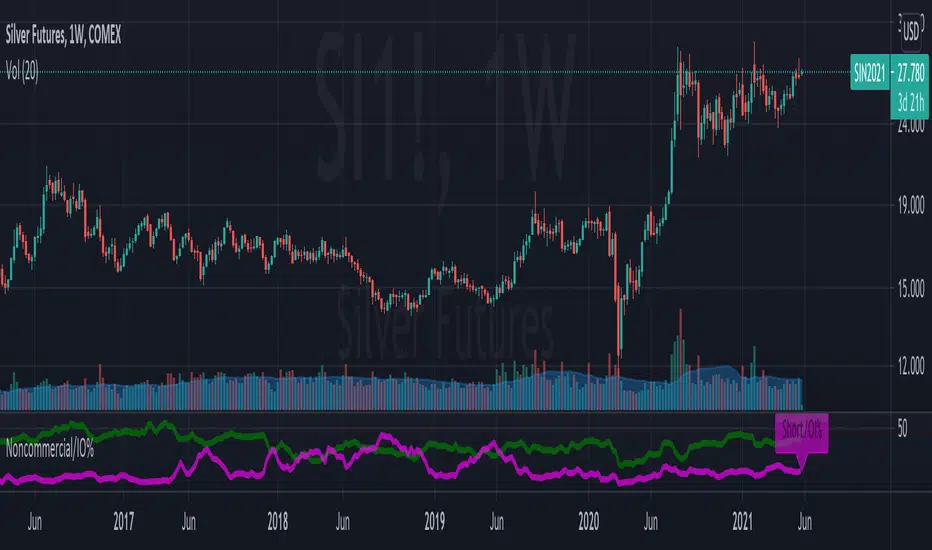
Noncommercial long futures position to overall Open InterestThis is an indicator that gets data from Quandl and presents weekly CFTC futures data (www.cftc.gov). In this indicator, the noncommercial long/short positions are calculated as a percentage of overall Open Interest. This indicates the bullish/bearish sentiment of the market.
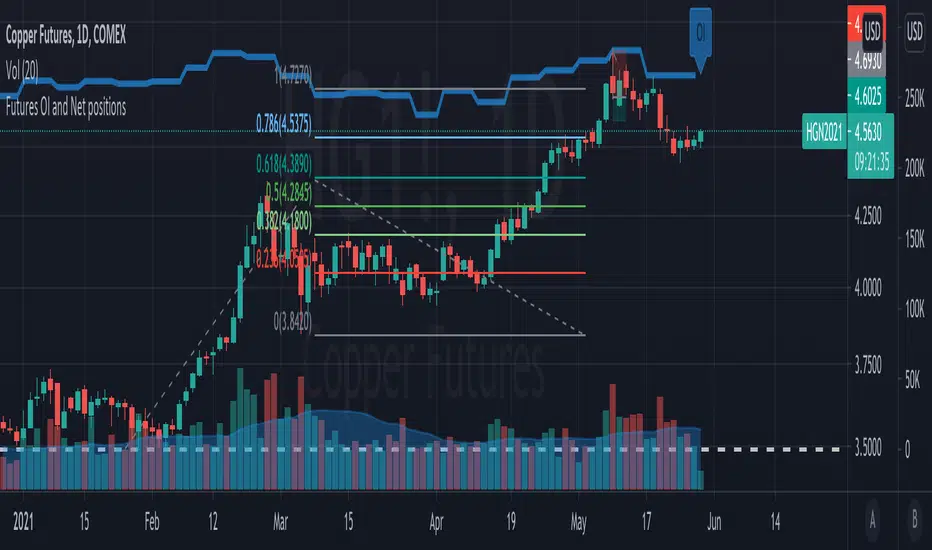
Futures OI and Net positionsThis is an indicator that gets data from Quandl and presents weekly CFTC futures data (www.cftc.gov). In this indicator, Open Interest (OI) and net noncommercial positions are presented. Net_noncommercial positions are calculated as noncommercial_long - noncommercial_short.