Balancelink : Partition Function 1.0This script computes the partition function values 𝑝(𝑛) using Euler’s Pentagonal Number Theorem and displays them in a horizontally wrapped table directly on the chart. The partition function is a classic function in number theory that counts the number of ways an integer 𝑛 can be expressed as a sum of positive integers, disregarding the order of the summands.
Key Features
Efficient Calculation:
The script computes 𝑝(𝑛) for all orders from 0 up to a user-defined maximum (set by the "End Order" input). The recursive computation leverages Euler’s Pentagonal Number Theorem, ensuring the function is calculated correctly for each order.
Display Range Selection:
Users can select a specific range of orders (for example, from 𝑛 = 100 to 𝑛 = 200 to display.) This means you can focus on a particular segment of the partition function results without cluttering the chart.
Horizontally Wrapped Table:
The partition values are organized into a clean, horizontal table with a customizable number of columns per row (default is 20). When the number of values exceeds the maximum columns, the table automatically wraps onto a new set of rows for better readability.
Medium Text Size:
The table cells use a medium (normal) text size for easy viewing and clarity.
How to Use
Inputs:
Start Order (n): The starting index from which you want to display the partition function (default is 100).
End Order (n): The ending index up to which the partition function values will be displayed (default is 200).
Max Columns Per Row: Determines how many results are shown per row before wrapping to the next (default is 20).
Calculation:
The script calculates all 𝑝(𝑛) values from 0 up to the specified "End Order". It then extracts and displays only the values in the chosen range.
Visualization:
The computed values are shown in a neatly arranged table at the top right of your TradingView chart, making it simple to scroll through and inspect the partition function values.
Use Cases
Educational & Research:
Ideal for educators and students exploring concepts of integer partitions and number theory.
Data Analysis & Pattern Recognition:
Useful for those interested in the behavior and growth of partition numbers as 𝑛 increases.
Numbertheory

Prime, E & PI Superiority CyclesIf you have been studying the markets long enough you will probably have noticed a certain pattern. Whichever trade entry/exit logic you try to use, it will go through phases of working really well and phases where it doesn't work at all. This is the markets way of ensuring anyone who sticks to an oversimplified, one-dimensional strategy will not profit. Superiority cycles are a method I devised by which code interrogates the nature of where price has been pivoting in relation to three key structures, the Prime Frame, E Frame and Pi Frame which are plotted as horizontal lines at these values:
* Use script on 1 minute chart ONLY
prime numbers up to 100: 2.0,3.0,5.0,7.0,11.0,13.0,17.0,19.0,23.0,27.0,29.0,31.0,37.0,41.0,43.0,47.0,53.0,59.0,61.0,67.0,71.0,73.0,79.0,83.0,89.0,97.0
multiples of e up to 100: 2.71828, 5.43656, 8.15484, 10.87312, 13.5914, 16.30968, 19.02796, 21.74624, 24.46452, 27.1828, 29.90108, 32.61936, 35.33764,
38.05592, 40.7742, 43.49248, 46.21076, 48.92904, 51.64732, 54.3656, 57.08388, 59.80216, 62.52044, 65.23872, 67.957, 70.67528, 73.39356000000001, 76.11184,
78.83012, 81.5484, 84.26668000000001, 86.98496, 89.70324, 92.42152, 95.13980000000001, 97.85808
multiples of pi up to 100: 3.14159, 6.28318, 9.424769999999999, 12.56636, 15.70795, 18.849539999999998, 21.99113, 25.13272, 28.27431, 31.4159, 34.55749,
37.699079999999995, 40.840669999999996, 43.98226, 47.12385, 50.26544, 53.40703, 56.54862, 59.69021, 62.8318, 65.97339, 69.11498, 72.25657, 75.39815999999999,
78.53975, 81.68133999999999, 84.82293, 87.96452, 91.10611, 94.2477, 97.38929
These values are iterated up the chart as seen below:
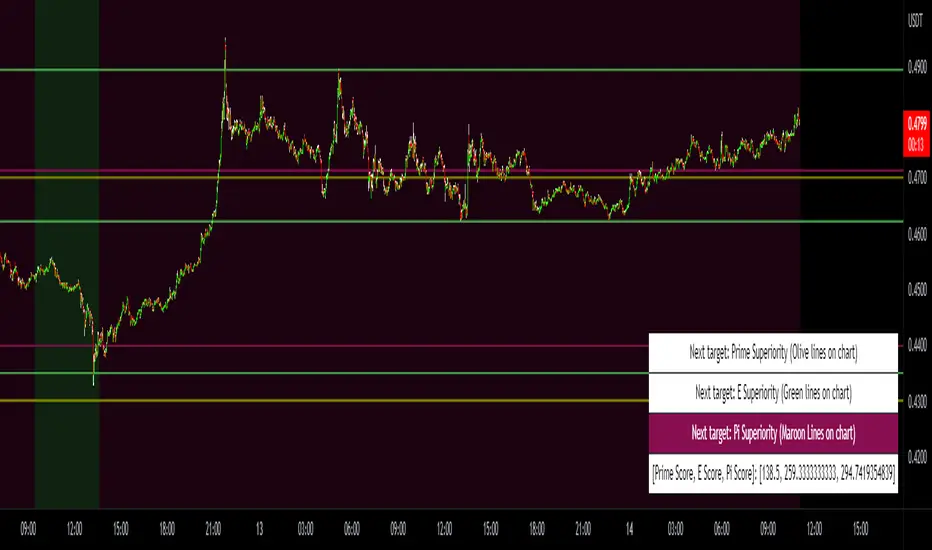
The script sums the distance of pivots to each of the respective frames (olive lines for Prime Frame, green lines for E Frame and maroon lines for Pi Frame) and determines which frame price has been reacting to in the least significant way. The worst performing frame is the next frame we target reversals at. The table in the bottom right will light up a color that corresponds to the frame color we should target.
Here is an example of Prime Superiority, where we prioritize trading from prime levels:
The table and the background color are both olive which means target prime levels. In an ideal world strong moves should start and finish where the white flags are placed i.e. in this case $17k and $19k. The reason these levels are 17,000 and 19,000 and not just 17 and 19 like in the original prime number sequence is due to the scaling code in the get_scale_func() which allows the code to operate on all assets.
This is E Superiority where we would hope to see major reversals at green lines:
This is Pi Superiority where we would hope to see major reversals at maroon lines:
And finally I would like to show you a market moving from one superiority to another. This can be observed by the bgcolor which tells us what the superiority was at every historical minute
Pi Frame Superiority into E Frame Superiority example:
Prime Frame Superiority into E Frame Superiority example:
Prime Frame Superiority into Pi Frame Superiority example:
By rotating the analysis we use to enter trades in this way we hope to hide our strategy better from market makers and artificial intelligence, and overall make greater profits.