Structure High LowsThis indicator identifies and tracks swing highs and lows in any market and timeframe, plotting them as solid lines on a chart. It offers customizable line features and can follow rules to update highs and lows based on bullish or bearish conditions.
In bullish ranges, the indicator updates the high until a swing high forms, while in bearish ranges, it updates the low until a swing low forms. These swings determine the final high or low. The indicator's unique approach incorporates market structure insights to potentially identify price movement trends and validate strategies across timeframes.
In bearish conditions, the indicator updates the low until a swing low forms, while the high adjusts when a candle's body surpasses the prior high. Swing highs entail lower highs on both sides, and swing lows involve higher lows. This indicator's innovation lies in its use of market structure to track price movement and validate trend strategies across timeframes.
Ohlc

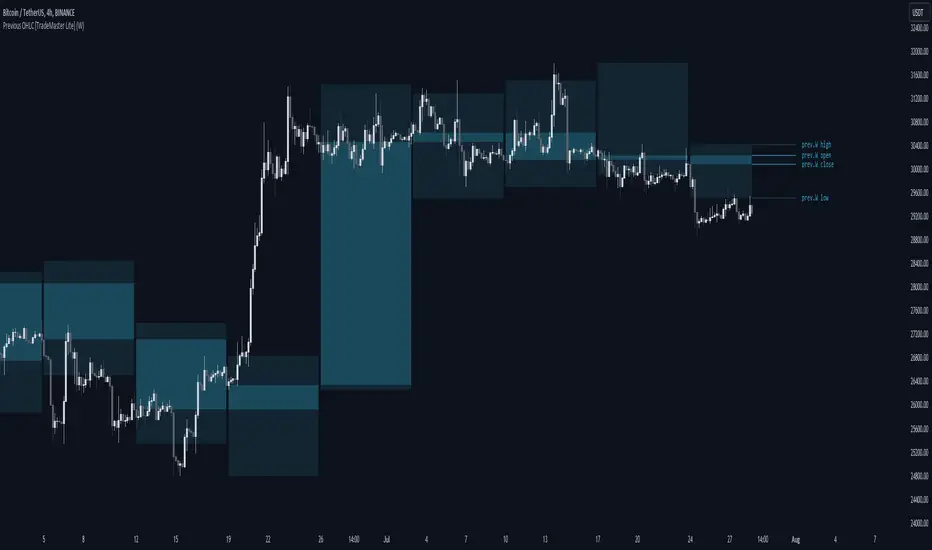
Previous OHLC Levels [TradeMaster Lite]In trading, the “Previous Open/High/Low/Close” (or previous OHLC) refers to the opening, high, low and closing price of the instrument in the previous period. These prices are typically used in technical analysis to identify trends and patterns and to make trading decisions. Some traders may also use the differences between the opening, high, low and closing prices to make trading decisions. For example, the difference between the closing and opening price (the so-called “true body”) and the high and low price (the so-called “upper shadow” and “lower shadow”) can indicate the strength of a trend, whether the bulls or bears are controlling the market, and can also give an idea of market volatility, and are also used as support and resistance levels.
Previous Open: shows the opening price of the previous period. It's the price at which the market first started trading in that period.
Previous High: represents the highest price reached during the previous period. It can act as a resistance level for the current period.
Previous Low: indicates the lowest price hit during the previous period. It can serve as a support level in the current period.
Previous Close: the last price at which the asset traded during the previous period. It's often considered the most accurate reflection of the market sentiment at the end of that period.
These values provide a summary of the previous trading period's price action, giving you a baseline for comparing current price movements. They can help in understanding the market's direction and identifying potential support and resistance levels. It is important to keep in mind that, like any other technical indicator, Previous OHLC does not give a definitive indication of future market direction and should be used in conjunction with other analytical tools, as well as fundamental analysis and market sentiment. It is also important to have appropriate risk management in place.
👉 General advice
Confirming Signals with other indicators:
As with all technical indicators, it is important to confirm potential signals with other analytical tools, such as support and resistance levels, as well as indicators like RSI, MACD, and volume. This helps increase the probability of a successful trade.
Use proper risk management:
When using this or any other indicator, it is crucial to have proper risk management in place. Consider implementing stop-loss levels and thoughtful position sizing.
Combining with other technical indicators:
The indicator can be effectively used alongside other technical indicators to create a comprehensive trading strategy and provide additional confirmation.
Keep in Mind:
Thorough research and backtesting are essential before making any trading decisions. Furthermore, it's crucial to have a solid understanding of the indicator and its behavior. Additionally, incorporating fundamental analysis and considering market sentiment can be vital factors to take into account in your trading approach.
Limitations:
This is a lagging indicator. Please note that the displayed values are delayed by the chosen timeframe on historical bars and show the values from the previous period on the current bar.
The indicators within the TradeMaster Lite package aim for simplicity and efficiency, while retaining their original purpose and value. Some settings, functions or visuals may be simpler than expected.
⭐ Conclusion
We hold the view that the true path to success is the synergy between the trader and the tool, contrary to the common belief that the tool itself is the sole determinant of profitability. The actual scenario is more nuanced than such an oversimplification. Our aim is to offer useful features that meet the needs of the 21st century and that we actually use.
🛑 Risk Notice:
Everything provided by trademasterindicator – from scripts, tools, and articles to educational materials – is intended solely for educational and informational purposes. Past performance does not assure future returns.
Excalibur Trading System [Dare]✦ INTRODUCTION
The core goal in the Excalibur Trading System is attaining an optimal entry - fading the masses, selling others' buys, buying others' sells, and trading along true tops and bottoms where price manipulation commonly occurs. Executions are most successful intraday and when aligned with HTF price action while still maintaining a systematic approach in analysis and risk management. Use of this tool is not recommended for the uninitiated trader; it takes intense focus, dedicated practice, and unwavering confidence to wield this successfully. Please go through the guide I’ve provided which contains comprehensive coverage of all the elements below which, in the context of this post, are meant to depict a general idea of what the indicator is meant to accomplish.
✦ INDICATOR DETAILS
System Overview
System Components
Indicator Settings
Plotting Interpretation
Postscript
✦ SYSTEM OVERVIEW
Type of System
This is a mechanical system which requires zero discretion. While trading with an objective approach offers several advantages, it's important to note that it is not foolproof. Market conditions can change, and indicators can provide false signals. The accuracy is not 100% and even following it perfectly, as with any strategy, one will incur losses.
Objective Decision-making - No emotional bias, no fear.
Consistent - A repeatable approach that eliminates impulsivity.
Easily tested - Strategy performance can be measured universally no matter who is using it, in both forward and backtesting.
No Guesswork - Provides specific entry and exit signals with a systematic procedure.
Predefined Rules - Controls risk and enforces discipline.
Simple and Clear - Reduces complexity and confusion.
Performance in Various Market Conditions
Excalibur is meant to catch reversals and second-stage continuations, but trending days should be avoided. It has been tested and used in live market conditions in Index Futures, during the regular NY Session, on the 1m Timeframe, targeting ≥2.5RR Ratio. Outcomes will vary by trader due to factors such as risk tolerance, entry opportunities taken, human error and psychological barriers. Historical performance is not a guarantee of future results.
✦ SYSTEM COMPONENTS
Setup Schematic
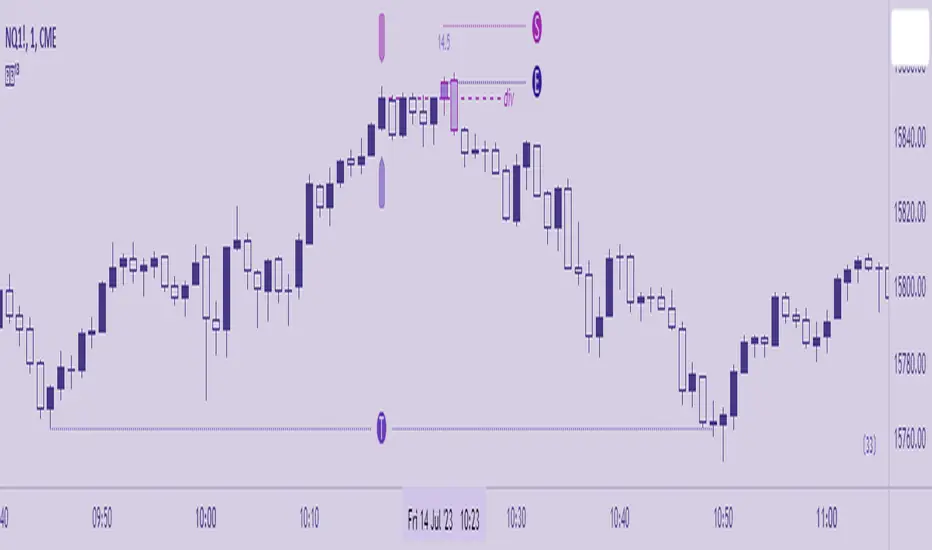
The premise for all setups is the same. We are identifying manipulation above a previous high (bearish) or below a previous low (bullish) in anticipation of a reversal. This indicator is meant to be used as a measuring tool to quantify that manipulation taking place using Hi's and Lo's as identified by the Bar , which is based on a standard deviation calculation. The Fu tag is meant to be used to find Divergence at custom pivots, not predetermined lookback periods - this is similar to SMT - Smart Money Technique, but this Divergence references bodies vs. wicks and the execution of the trade is at the extreme pivot vs. the weak pivot.
Using the Bar as a guide, the trader will set the Hi/Lo tags and the indicator will automatically calculate the Threshold, the point beyond which one’s Entry resides when Divergence is also present. A valid entry plots as a Polaris star below (bullish) and above (bearish) the current bar in their respective scenarios.
Bullish Setup
(1) Place the Lo tag at the current threshold as signified by the Bar.
(2) Search for Divergence with price action below that threshold by using the Fu tag at extreme bodies of recent swing lows.
(3) Wait for a bullish Entry to plot, confirmed at candle close.
Bearish Setup
(1) Place the Hi tag at the current threshold as signified by the Bar.
(2) Search for Divergence with price action above that threshold by using the Fu tag at extreme bodies of recent swing highs.
(3) Wait for a bearish Entry to plot, confirmed at candle close.
The indicator collects the OHLC values of the target asset candles based on the trader’s Hi/Lo placement, compares them to up to two assets, and plots an entry depending on the context of the setup. The entry method, like the setup composition, is based on minute Divergences in price between the assets and other criteria related to how the candles close relative to each other.
✦ INDICATOR SETTINGS
Options
This line controls the colors of the Polaris (✦) and the squares in the Manipulation Bar. Manipulation can be measured using either mathematical calculation (ᴀʟᴘʜᴀ) or OHLC data-points (ʙᴇᴛᴀ). The Polaris denotes a time and price of possible reversal at an extreme low or high - deselect this line to hide it.
⋆ This line controls colors of the Tags and Candles - Bullish, Bearish, and All. To customize, switch to ᴄᴜsᴛᴏᴍ. If the Divergence Candles are not consistently visible, change the Visual Order to Front on the chart by selecting the indicator Title then More. To hide, deselect this line.'
The third and fourth lines controls the visibility of the Manipulation Bar, Matrix Tags, Advisor Arrows and Invalidation Labels.
Time
By default, the times for Hi, Lo and Fu are set to 09:00, 09:30 and 09:15 respectively. The date will need to be manually adjusted at the beginning of each trading day.
Price
By default, the charted Asset is assumed to be ES1! (E-Mini S&P 500 Continuous Contract) . If the trader would like to chart a different Asset, be sure to adjust Assets I and II to valid comparisons so that the indicator can accurately detect price divergences.
Risk
Input the account size and percentage one intends to risk. To pyramid, indicate the quantity the position to be divided into. In MT4 or 5, right-click a symbol then Specification. The Contract Size field contains the Units per Lot. Use the various options to customize the table format and visibility.
The tooltips (i) will be available in the UI in case the trader will ever need to refer to them for the information above.
✦ PLOTTING INTERPRETATION
Matrix Tags
Guided by the manipulation bar, the trader will use Hi and Lo tags to measure the manipulation threshold. The Fu tag measures either bullish or bearish divergences depending on the placement of the Hi/Lo tags.
Manipulation Bar
The squares plotted together form a bar and indicate whether a candle is or isn’t plotting a new manipulation threshold (creating a new Hi or Lo ). The trader should always use the current Hi or Lo .
Advisor Arrows
The arrows are meant to signify a possible valid entry in the temporary period of time between the candle open and close. They give advance notice that the trader should be looking for divergences using the Fu tag to attain a confirmed entry (Polaris) on that particular candle as it is forming.
Entry Signal
The Polaris denotes a time and price of trade execution. As long as the Matrix tags are placed correctly, this is a valid signal to place a position in the direction indicated. Entry price is at the candle close, regardless of the next candle’s open price.
Risk Labels and Table
This is an automatic calculation for Stop placement based on average true range (valid only for indices with a 0.25pt tick value. A future version may allow for customization of this feature for assets not based on ticks, like forex pairs). The table (by default at the bottom right) will display the trader's position size based on the inputs.
Divergence Candles
Using the Fu tag, the trader can select swing highs and lows to determine if divergence is occurring above and below them, respectively. Divergence is maintained as long as the colored candles are printed consecutively. Referring to the charts of Assets I and II in a separate layout window is recommended but not required.
✦ POSTSCRIPT
I forged this sword, Excalibur, in pursuit of my highest aspiration - to create a legacy and provide a gift to my friends, family, and all those burdened by obligations that limit them from living what they would consider to be a fulfilling life. Those free to pursue the ambitions they truly value are the ones who change their communities and even the world for the better.
~Dare.
luckynickva OHLC
This Script Shows The OHLC Of The Higher Timeframe Candles In The Background Great For Not Losing Sight Of The Bigger Picture On The Lower Timeframe
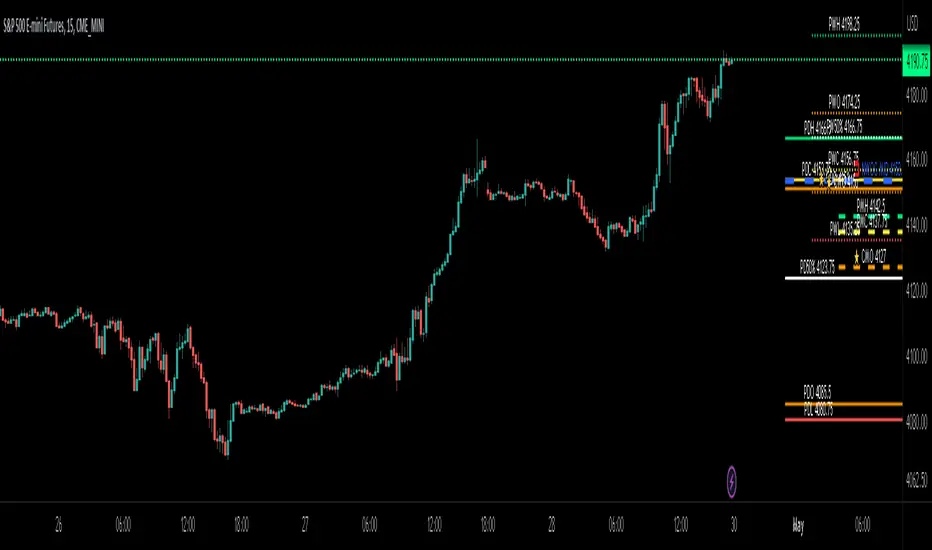
ICT Day/Week/Month Levels [MK]Displays Open, High, Low, Close and 50% levels for the Previous Day/Week/Month.
Also shows the Open for the Current Day/Week/Month
Also shows the Current New Week Opening Gap Midline (NWOG)
These levels are key to teachings by ICT as well as other trading strategies. There are lots of scripts available for this data, however this one plots the levels to the right of price on the chart to keep the chart as clean as possible. The line styles, colors and text can be customised. The offset to the right of the chart for the start of line and label offsets can also be adjusted.
Labels are abbreviated to PDH (previous day high), CMO (current month open), PW50% (previous week 50% from high to low) ..etc
Bursa Malaysia Index SeriesERVIEW
This indicator is intend to display Bursa Malaysia Index Series.
█ FEATURES
1. Choose available sector based on Bursa Malaysia Index.
2. Plot close or OHLC.
3. Color of Closing price plot adapt to chart background color.
4. Font size can be selected.
█ EXAMPLES / USAGES

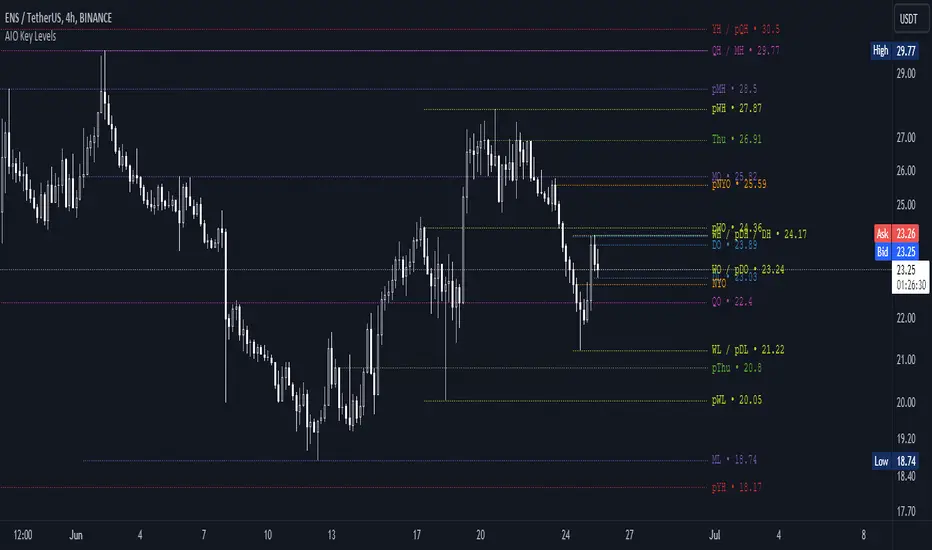
AIO Key LevelsAll In One Key Levels - Displays key levels for any type of chart.
Over 30 levels at your complete disposal.
Filled with a host of features that allow you to customise the appearance and display of the indicator to suit your individual trading style.
The result is a clear and concise indicator that helps traders easily identify key levels.
- The indicator is easy to use and does not need a detailed description.
- With customisable input parameters such as display style, line style, font style, offset, threshold and index.
- The colours for the key levels can also be customised.
- The script uses a 'switch' function and selected input parameters to set display, line and font styles.
- The key levels are constructed using the data received and the selected styles and colours.
- A unique cycle helps to improve the readability of the levels without "polluting" the graph with multiple labels
- In addition, I have left hints in the indicator to help you understand it better.
For Pine coders.
Why did I create it when there are many counterparts?
Simply because counterparts have very large and complex code and modest functionality and flex.
Here I have managed to fit it into 100 lines still readable.
You can learn how to call lots of lines and marks with just one function.
I also created a unique loop that connects labels if they are too close together for better visibility on a plot.
I have left detailed comments for each action.
I would be glad if someone could tell me how to make it more easier.
OHLC [TFO]Keep higher timeframe OHLC in mind by watching the candle form on LTF charts. Inspired by ICT concepts, specifically concerning the daily OHLC.

OHLC ToolOHLC Tool allows you to display Current or Historical OHLC Values as horizontal lines that extend to the right on your chart.
Features
Variable Lookback to display a specific historical bar's values. Default = 1 (Previous Candle)
Customizable Timeframe to view HTF Candle values.
Custom Line Colors, Styles, and Thicknesses.
Price Scale Value Display Capability.
For displaying the line values and labels on the price scale you will need to enable:
"Indicator and financials name labels"
and
"Indicator and financials value labels"
These options are found in the Price Scale Menu under Labels. Price Scale Menu > Labels
When you do this you will notice your other indicator values will also be on the price scale,
if you wish to disable these, go to the indicator settings under the "Style" Tab, Uncheck the "Labels on price scale" box.
Indicator Settings > Style > "Labels on price scale"
Enjoy!

Simple OHLC Custom Range Interactive█ OVERVIEW
This indicator show lines of OHLC which can be commonly used as support and resistance zones.
OHLC can be shown table with candlestick visual.
Color of candlestick depends on direction of bullish / bearish of the chosen candlestick.
█ INSPIRATION
Inspired by design, code and usage of CAGR . Basic usage of custom range / interactive, pretty much explained here . Credits to TradingView .
█ FEATURES
Table can positioned by any position and font size can be resized.
OHLC can be in full or simple name.
Lines can be extend either right, left, both or none.
█ HOW TO USE
Only 1 point is required.
Dont worry about magnet, point will attached depends on High or Low of the candle.
█ USAGE / TIPS EXAMPLES (Description explained in each image)

Key Levels by myooThis indicator plots key levels on the chart and can put a label on the price scale.
These levels can act as important support and resistance and cause big reactions.
• Open, High, Low, and EQ for the current day, previous day, current week, previous week, current month, previous month and current year.
•To show the levels on the price scale, you need to right click on the price scale, select "Labels" and turn on "Indicator and financial name labels" and "Indicator and financial value labels".
•In the settings under "Style", disable the "Labels" for a clean look.
In the settings window you can change the way the lines are drawn:
•Minimal: Lines are being drawn to the right for a clean chart.
•Standard: Lines are being drawn from the open bar of said period.
•Additionally, if you do not like to have the labels on the price scale, you can turn them of in the settings under the "Style Tab" by deactivating "Labels on price scale".
In this case, you can use the labels from the indicator itself, that are being drawn above the price line on the chart. Use the "Offset" setting to dial in the position to your preference.
Enjoy trading!

OHMLC Candles LevelsPlot Open / High / Middle / Low / Close Lines of current and previous candles.
The indicator is Multi-Timeframe.
Choose the line style and the type of extension.

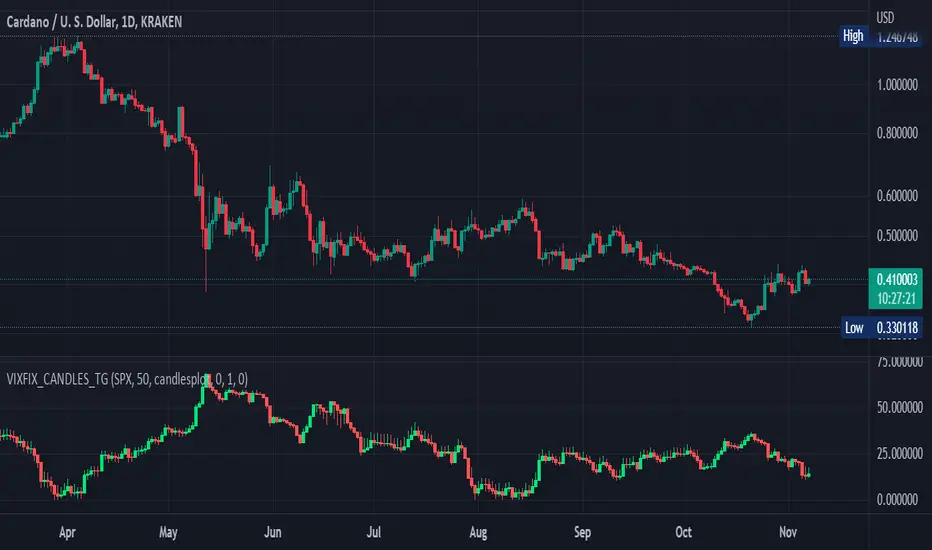
Williams Vix Fix OHLC candles plot indicator (Tartigradia)OHLC candles plot of the Williams VixFix indicator, which allows to draw trend lines.
Williams VixFix is a realized volatility indicator developed by Larry Williams, and can help in finding market bottoms.
Indeed, as Williams describe in his paper, markets tend to find the lowest prices during times of highest volatility, which usually accompany times of highest fear. The VixFix is calculated as how much the current low price statistically deviates from the maximum within a given look-back period.
The Williams VixFix indicator is usually presented as a curve or histogram. The novelty of this indicator is to present the data as a OHLC candles plot: whereas the original Williams VixFix calculation only involves the close value, we here use the open, high and low values as well. This led to some mathematical challenges because some of these calculations led to absurd values, so workarounds had to be found, but in the end I think the result was worth it, it reproduces the VIX chart quite well.
A great additional value of the OHLC chart is that it shows not just the close value, but all the values during the session: open, high and low in addition to close. This allows to draw trend lines and can provide additional information on momentum and sentiment. In addition, other indicators can be used on it, as if it was a price chart, such as RSI indicators (see RSI+ (alt) indicator for example).
For more information on the Vix Fix, which is a strategy published under public domain:
The VIX Fix, Larry Williams, Active Trader magazine, December 2007, web.archive.org
Fixing the VIX: An Indicator to Beat Fear, Amber Hestla-Barnhart, Journal of Technical Analysis, March 13, 2015, ssrn.com
Replicating the CBOE VIX using a synthetic volatility index trading algorithm, Dayne Cary and Gary van Vuuren, Cogent Economics & Finance, Volume 7, 2019, Issue 1, doi.org
This indicator includes only the Williams VixFix as an OHLC candles or bars plot, and price / vixfix candles plot, as well as the typical vixfix histogram. Indeed, it is much more practical for unbounded range indicators to be plotted in their own separate panel, hence why this indicator is released separately, so that it can work and be scaled adequately out of the box.
Note that the there are however no bottom buy signals. For a more complete indicator, which also includes the OHLC candles plots present here, but also bottom signals and Inverse VixFix (top signals), see:
Set Index symbol to SPX, and index_current = false, and timeframe Weekly, to reproduce the original VIX as close as possible by the VIXFIX (use the Add Symbol option, because you want to plot CBOE:VIX on the same timeframe as the current chart, which may include extended session / weekends). With the Weekly timeframe, off days / extended session days should not change much, but with lower timeframes this is important, because nights and weekends can change how the graph appears and seemingly make them different because of timing misalignment when in reality they are not when properly aligned.
Implied Move with NASA Ideas & Price LineThis script allows you to customize the Implied Move Percentage and fully customize the way it is shown.
Can be used on any stock that has earnings and works based on the Implied Move (Percent).
Basically, it lets you visualize how the stock moved after reporting earnings and seeing if it reached the implied move or not.
This is helpful as it's important to know what earnings are worth keeping an eye on and which should be avoided.
There is also an added custom text input which was inspired to make from a frogman named NASA.
It lets you input whatever text you want on whatever price you want.
To summarize, it's basically a Post-It Note that you can add to any price level for any stock.
Alerts can be set if wanted, They can be alerted for the Implied Moves (If the stock price goes Above/ Below the set percentage) and NASA Ideas (if the stock price goes Above/ Below the set price).
There is also an added custom price line which is mostly for having a nonintrusive price line and label.
This price line and label can be switched to show the (Open, High, Low, Close, Extended High, Extended Low, Yesterday's Open, Yesterday's High, Yesterday's Low, and Yesterday's Close).

Daily Profile (Nephew_Sam_)From getting several requests to combine many of my indicators into one, this indicator plots everything you need for a Daily Profile.
1. Session = Current session + Daily dividers + day of the week
2. Open Lines = Plot the open of the day, midnight, week and month
3. Asian Range = Plots the asian range with an option for midpoint and extending lines
4. Previous OHLC = Plot the previous day/week/month OHLC
EVERY line/label/color/size/style is fully customizable in this indicator.
Important to adjust your timezone to get the correct data

Crossover Alerts for Yesterday O/H/L/C , Today Vwap [Zero54]This is a very simple script/indicator that trigger alerts every time the script triggers the following conditions.
1) Script crosses yesterday's (previous day's) high
2) Script crosses yesterday's (previous day's) low
3) Script crosses yesterday's (previous day's) open
4) Script crosses yesterday's (previous day's) close
5) Script crosses today's vwap.
I developed this to keep track of the scripts I follow and I find it useful. Hope you will find it useful too.
Steps to use:
1) Open the ticker for which you want to set the alerts.
2) Add this indicator to the chart.
3) Right Click on the text and set choose "Add Alert"
4) After you have done with setting up the alert, feel free to remove the indicator from the chart. It is not necessary for the indicator to be added in the chart in order for it to work.
5) Repeat 1-4 for all the scripts for which you want to set the alerts.
Be advised: During market open, if you have set alerts for multiple scripts, a tsunami of alerts may be triggered.
If you like this alert indicator, please like/boost it. Feel free to re-use this code however you may wish to. Cheers!

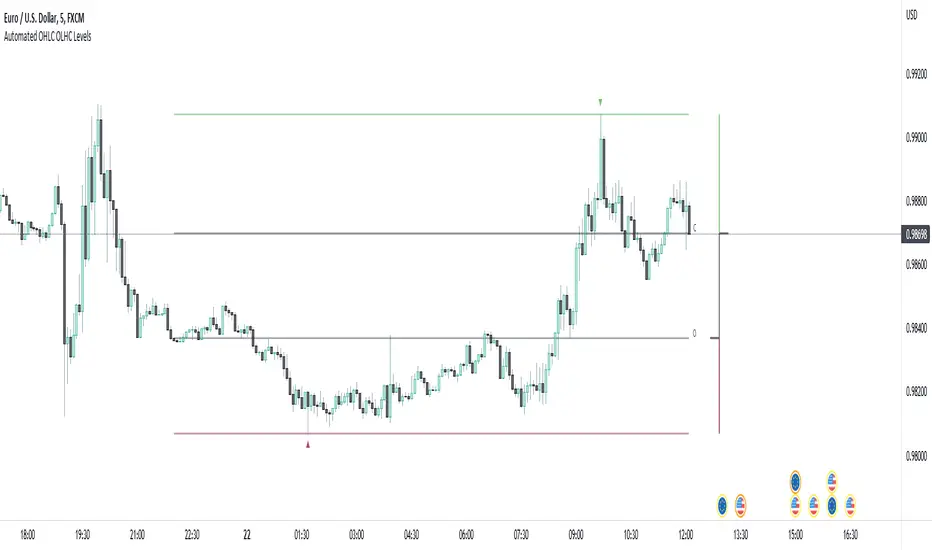
Automated OHLC OLHC LevelsA simple, clean, effective visualization tool, for the OHLC or OLHC of a chosen candle/timeframe.
Apply this indicator using a higher timeframe, in conjunction with other levels and the directional bias, to easily recognize trading opportunities at lower timeframes.
Yearly CandlesPlots yearly candles from monthly candles data. This indicator could also be used to view yearly candles of those symbols for which candlesticks are not available in TradingView (for e.g., ECONOMICS:USINTR , ECONOMICS:USIRYY , ECONOMICS:USWG etc)
As these are not out of the box candles they do have these shortcomings -
Last candle's data is not available in status line, a separate label lists OHLC and change details near its close level
The very first candle's width may vary based on how much data is available for that year
Works only with monthly timeframe
Only those indicators that can be added on other indicators can be applied, however, they may still not work as intended as this still technically is a monthly chart!

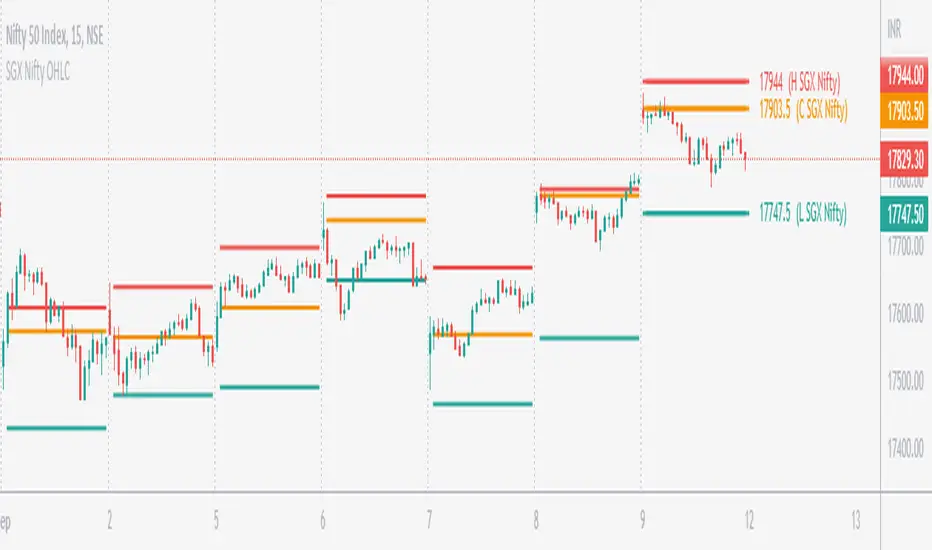
SGX Nifty OHLC for Nifty 50 IndexSGX Nifty OHLC for Nifty 50 Index
What is this Indicator?
• This indicator calculates the OHLC levels of SGX Nifty.
How does SGX Nifty impact NIFTY and the Indian Market?
• Helps in predicting NIFTY50 Index behavior.
• The closing price of today's 9.14 am (IST) SGX Nifty will be the Open of today's Nifty50 Open. This helps to determine the opening Gap of Nifty50.
• SGX Nifty OHLC levels can act as support and resistance in Nifty50.
Who to use?
• Beneficial for Day Traders, who trade in NIFTY Index.
What timeframe to use?
• Use 1 minute for better accuracy.
• Other timeframes will also work.
Important Note
• Use 1 min timeframe for accurate OHLC.
• In other timeframes OHLC will have negligible difference, it won't be huge.
• This indicator will appear only on NIFTY Index and Futures chart.
• To hide the warning label go to the indicator Menu.
OHLC Moving AverageThis indicator shows 4 moving averages of Open, High, Low and Close at the same time with an option to select SMA or EMA.
If you implement this indicator twice, you can make it look like the following chart.
One set of MA(red) is for current timeframe and another set(blue) is for higher timeframe, which is to identify potential support and resistance zones.
--------------------------
四本値(始値、高値、安値、終値)それぞれの移動平均線を同時に表示することのできるインジケーターです。
MAタイプはSMAかEMAを選択することができます。
このインジケーターを二つセットすると以下のように上位足の移動平均線とセットで表示することも可能です。
(赤がチャートの時間軸の4本値の移動平均線、青が上位足の4本値の移動平均線)
上位足の移動平均線をサポート・レジスタンスのゾーンとして捉える時などに活用できます。

OHLC MTFThe script allows you to plot the opening, highest, lowest and closing (ohlc) values of a previous candle.
Settings :
- "Time Frame" : allows you to choose the reference time frame;
- "Offset" : sets which candle to select the data from.
Ex : If you select "1 day" as the time frame and "1" as the offset, the OHLC values of yesterday's daily candle will be displayed (regardless of your current time frame).

4C Daily Levels Suite + Premarket High/LowThis '4C Daily Levels Suite + Premarket High/Low' indicator is a clean way to automatically plot important daily levels including:
Prior Day High
Prior Day Low
Prior Day Close
50% level between Prior High/Low
Today's Open
Today's Premarket Low+High
This Daily Levels indicator is unique in its ability to:
-Plot all of the daily level PLUS premarket high/low levels (extended hours must be turned ON)
-Can hide past days levels, only plotting levels on the current day, to keep chart cleaner
-Can extend line levels right or fullscreen
-Plots the level price at each level on the chart
-Can show/hide price levels labels
-Can add supplemental premarket levels plot to show levels being formed during the premarket time period
-Coded with line.new vs plot so dashed lines are available as a style
-Automatically hides the indicator if the timeframe selected is Daily or greater
SEE SCREENSHOT EXAMPLES BELOW
Default mode, with extended hours showing:
With supplemental premarket plot showing:
Default mode without extended hours showing:
Showing past day’s levels
Extend lines to fullscreen
Some parts of this code were adapted from 'pd Levels' by CryptoCurl

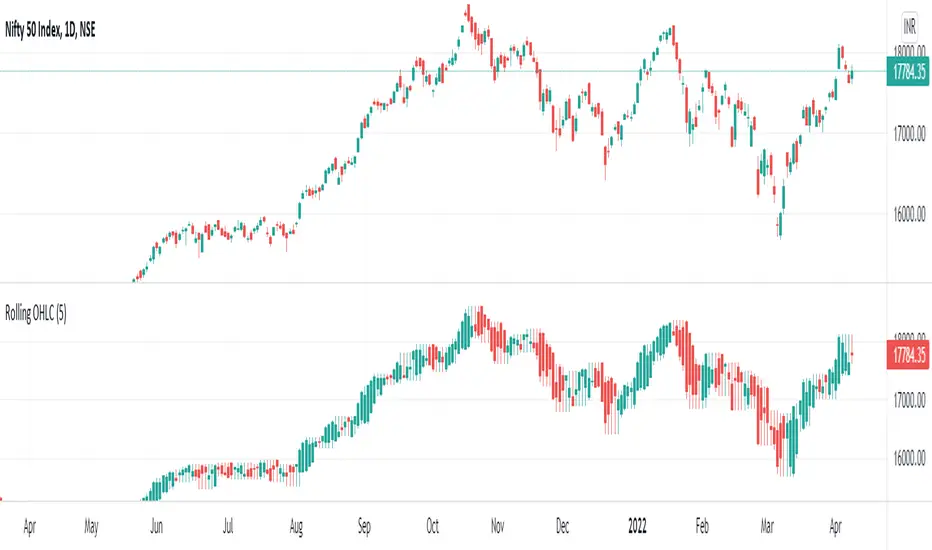
Rolling OHLC Candles█ OVERVIEW
This indicator displays a Rolling OHLC Bars for a given timeframe Multiplier. Contrary to OHLC Charts, if the timeframe Multiplier is "5", this indicator plot OHLC of the last 5 Candles.
█ WHAT IS THE NEED FOR IT
Let's see if we want to use a Higher timeframe OHLC Data using security function or resolution options. The indicator repaints until the higher timeframe OHLC Candle closes, leading to a repainting strategy or indicator using higher-timeframe data. So we can use Rolling OHLC Candles in these cases.
█ USES
To Pull out higher timeframe OHLC Data to build a non-repainting strategy or indicator.
Prominently, traders use Heikin Ashi Candles to locate trends or trading opportunities easier than traditional candlesticks. But the OHLC in those Heikin Ashi candles doesn't match with conventional candlesticks. We can use these Rolling OHLC Candles as an alternative for Heikin Ashi Candles because Here we can locate trends or trading opportunities easier than traditional candlesticks, and also close of these candles matches the close of the standard candlesticks, which can help us to take trades based on the close of the candles.
█ WHY I AM BUILDING THIS SIMPLE INDICATOR
There is no doubt higher timeframe analysis is a critical study to mastering the markets.
I found a necessity for an indicator that analyses multiple higher timeframes and gives us a cumulative or average trend direction. I already built the indicator; I will release it soon. The Indicator I am building is wholly based on my understanding and perspective of Market Structure. Please use this indicator idea to remove the repainting issue when you make an indicator that utilises higher timeframe data.
I am using this in my upcoming indicators. Felt to share before head.
Stay Tuned...
If you have any recommendations or alternative ideas, then please drop a comment under the script ;)