Spot vs. Derivatives BasisThis indicator calculates the basis between average spot and average perpetual futures prices across selected exchanges. It helps identify deviations between spot and perp markets — a key signal for funding pressure, arbitrage, or market dislocation.
Key Features:
Manual Pair Control – Enable or disable specific trading pairs as needed
Flexible Basis Smoothing – Apply SMA, EMA, WMA, or VWMA to filter noise
Anomaly Highlighting – Automatically flags basis deviations beyond ±0.1%
Okx

Kaito Box with RSI Div(Dynamic Adjustment + MA + Long)The script implements a dynamic trading strategy that combines box range detection, RSI divergence signals, and moving average trend analysis. It is designed for use on OKX Signal Bots and includes features for dynamic position scaling and partial position closing. Below is a summary of its key functionalities:
Key Features:
Box Range Detection:
The script identifies price ranges using the highest high and lowest low of a configurable boxLength period.
These levels are plotted on the chart to visualize the price range.
RSI Divergence Detection:
The script calculates RSI using a configurable rsiLength.
Detects bullish divergence when price makes a lower low, but RSI makes a higher low.
Detects bearish divergence when price makes a higher high, but RSI makes a lower high.
Includes separate left and right lookback periods (leftLookback, rightLookback) for precise local extrema detection.
Customizable Moving Averages:
Supports multiple types of Moving Averages (SMA, EMA, SMMA, WMA, VWMA).
Calculates and plots MA20, MA50, MA100, and MA200 on a user-defined timeframe (custom_timeframe).
Identifies uptrends and downtrends based on the alignment of the moving averages and price levels.
Dynamic Position Scaling:
Implements dynamic position sizing for long entries and partial position closing for exits.
The percentage of position size added or closed is based on the difference between the current price and the average position price (avgPrice), with configurable minimum thresholds (minEnterPercent, minExitPercent).
Signal Integration for OKX Bots:
Sends buy/sell signals to OKX Signal Bots using the configured signalToken.
Supports market or limit orders with configurable price offsets and investment types.
Trend-Based Signal Filtering:
Only triggers long signals during downtrends and short signals during uptrends, ensuring trades align with the overall market context.
Visual Annotations:
Plots bullish and bearish divergence signals on the chart.
Displays labels showing dynamic position size adjustments and current average price during trades.
How It Works:
Long Signals:
Triggered when the price breaches the lower box range, and a bullish RSI divergence is detected.
Additional filtering ensures long trades are executed only during downtrend conditions.
Dynamically adjusts the position size based on the price difference from the average entry price.
Short Signals:
Triggered when the price breaches the upper box range, and a bearish RSI divergence is detected.
Additional filtering ensures short trades are executed only during uptrend conditions.
Dynamically closes portions of the position based on price movement relative to the average entry price.
Alerts:
Generates actionable alerts formatted for OKX bots, including order type, signal token, and dynamically calculated position sizes.
Use Case:
This strategy is well-suited for automated trading on platforms like OKX, where it can:
Exploit price ranges and RSI divergences for precise entries and exits.
Dynamically manage position sizes to optimize risk-reward.
Adapt to different market conditions using configurable parameters like moving averages, divergence lookbacks, and trend filters.
This script provides a robust foundation for traders looking to automate their strategies while maintaining flexibility and control over their trading logic.

OKX Signal BOT - Strategy Scanner & Orderer
Hello traders,
With the OKX Signal BOT - Strategy Scanner & Orderer, you can now design your own strategy, scan over 20 cryptocurrencies, and send orders for futures trades on the OKX exchange.
How to Use:
🌐 First, log into your account on the OKX exchange and create a signal bot.
📝 While creating the signal bot, note down the webhook URL and signal token variables given to you; they'll be needed later.
🔍 Select the trading pairs that the bot will work on.
📈 Add this indicator to your chart.
⚙️ Adjust the values of the indicators you will use in your strategy.
📊 Set your entry conditions and indicator setups according to your preference.
🚀 Decide which condition will generate a LONG signal and which will generate a SHORT signal.
🔗 Then, link these conditions with either an AND or OR connector.
🛠️ This also serves as a strategy designer.
🆔 Paste the signal token value you got from OKX into the OKX Signal ID section in the indicator.
➕ Add the cryptocurrency pairs you added to the bot on OKX to this design tool as well.
💾 Save and exit.
🚨 Set an alarm and paste the webhook URL link you got from OKX.
Congratulations, you can now send signals from Tradingview to the OKX exchange without needing any other platform.
Warnings:
⚠️ Works only for futures trades.
📈 Make your leverage settings through the exchange.
🛑 It is recommended to set take profit and stop loss through the exchange.
🚫 If too many alarms are triggered, Tradingview may stop your alarms.
💡 Ensure that the coins you add in the symbol section are from the OKX exchange.
🔍 For futures trades, make sure the symbols end with ".P".
🎉 Enjoy using it!

OKX: MA CrossoverEXAMPLE Scripte from my stream , how to use OKX webhooks for create strategy on Pine with real\demo trading on your OKX account. This strategy only for test the functional forward orders to OKX. The backtest not included commisions and other.
OKX MA Crossover. This strategy generate JSONs for place orders on the exchange by alerts and webhooks.
In the script 2 function to generate entry and exit orders, and input parameters that needed for setup exchange.
Use it for test this stack and to write you own strategy for trade on the OKX Exchange.

[OKX Signal Bot] Indicator Script Set Up TemplateDiscover the power of the Turtle Trade Channels Indicator (TUTCI), an innovative tool that integrates the time-tested principles of the legendary Turtle Trade system. This groundbreaking system shattered the belief that successful traders are born, not made, by transforming ordinary individuals into profitable traders.
The Turtle Trade Experiment, which achieved a remarkable 80% annual return over four years and amassed a staggering $150 million, showcased the immense potential of this trend-following strategy. Unlike the conventional "buy low and sell high" approach, the Turtle Trade system embraces a different philosophy—one of capturing substantial profits by following prevailing trends.
At the heart of the Turtle Trade Channels Indicator lies the concept of Donchian Channels, a powerful technical indicator developed by Richard Donchian. Building upon this foundation, the main rule of TUTCI is to identify 20-day breakouts and capitalize on them, while simultaneously utilizing a profit-taking strategy based on breaching 10-day highs or lows.
For long trades, the indicator signals a buying opportunity when the price breaks above the 20-day high. Conversely, for short trades, a selling opportunity arises when the price falls below the 20-day low. This systematic approach allows traders to align themselves with the prevailing momentum, capturing significant price movements.
To further enhance trading precision, TUTCI incorporates two key lines. The red line represents the trading line, indicating the direction of the trend. Price bars above the trend line suggest an uptrend, while those below indicate a downtrend. The dotted blue line serves as the exit line, guiding traders to close their positions when price action breaches the 10-day high or low. This rule safeguards profits and helps traders avoid potential trend reversals.
The Turtle Trade Channels Indicator (TUTCI) is a versatile tool applicable to various financial markets, including stocks, commodities, and forex. By harnessing the power of breakouts and integrating profit-taking rules, this indicator empowers traders to capitalize on favorable trading opportunities while managing risk effectively.
As with any trading strategy, it is crucial to conduct thorough backtesting and evaluation of the TUTCI system before implementing it in live trading. Traders can customize the indicator's parameters to align with their trading preferences and adapt to changing market conditions. Employing sound risk management techniques, such as position sizing and stop-loss orders, is paramount to protect capital and minimize potential losses.
Experience the transformational potential of the Turtle Trade Channels Indicator (TUTCI) and embark on a journey of trend following, capturing significant profits, and achieving trading success.
These scripts are only functioning as sample script templates to support okx alert standards. It is not intended to provide any investment, tax, or legal advice, nor should it be considered an offer to purchase, sell, hold or offer any services relating to digital assets. Digital assets, including stablecoins, involve a high degree of risk, can fluctuate greatly, and can even become worthless. You should carefully consider whether trading or holding digital assets is suitable for you in light of your financial condition and risk tolerance. OKX does not provide investment or asset recommendations. You are solely responsible for your investment decisions, and OKX is not responsible for any potential losses. Past performance is not indicative of future results. Please consult your legal/tax/investment professional for questions about your specific circumstances.

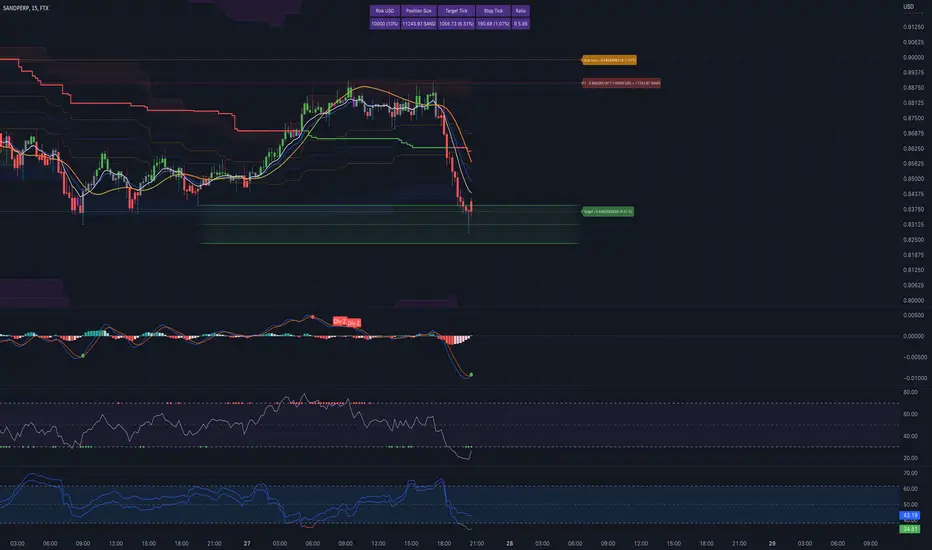
Interactive Lot/Position Calculator FTX/OKX DCA [RDM13-NOSTRA] Interactive script to calculate lot and position size when you use TradingView to trade on FTX or OKX. You can also use multi positions for DCA strategy.
After adding an indicator and making an initial interactive selection on the chart, you can modify the selection points by selecting the indicator and moving the points on the chart.