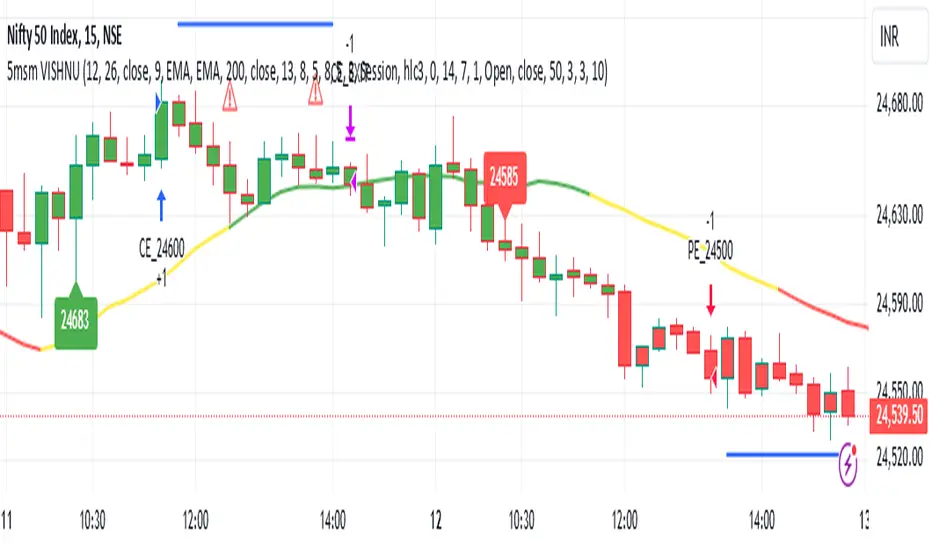
5MSM VISHNU5MSM VISHNU Indicator for Trending Markets originally written by patrick1994.
It was originally based on the MACD 12-26 and the 50 bar EMA .
The macd hist is color coded with green as buy and sell as red.
I added an option to use a couple of lower lag ema's (See line 13 - ema_signal).
5MSM VISHNU with MACD Indicator for Trending Markets
Originally written by Trading Rush
Note that the user may choose lower lags to compute the MACD signals
added lower lag ema functions - see lines 21 to 30
added plot for the MACD signal 'hist' - computed in lines 36 to 41
The extra MACD line was added for clarity for the placement of the buy sell signals.
Optionstrading
MACD Willy StrategyThis strategy is mainly developed for scalping / intraday trading. It could potentially be used to identify entry/exit signals for short term options trading. It performs decently well on popular stocks when used on time frames between 5 min to 15 min using regular session bar data. It combines 3 popular indicators, EMA, MACD, and William %range, to generate both long and short signals.
EMA:
Default is 200 EMA line.
MACD:
Default is 12/26 lengths for fast/slow signal inputs.
William %R - Smoothed (Published):
This is a custom indicator that generates two moving average lines from the original William %R line.
How it works:
Entry conditions:
1. Long/short entries when bar closes above/below EMA line
2. Long/short entries when MACD line is above/below signal line (histogram > 0 for long, < 0 for short)
3. Long/short entries when William %R fast MA line is above/below slow MA line
Exit conditions:
1. Exit long when MACD line is below signal line, vise versa for exit short
2. Exit long when William %R fast MA line is below slow MA line, vise versa for exit short
3. Exit long when William %R fast MA line must in below the overbought (-20) limit, exit short when above the oversold (-80) limit.
***Note that parameters are NOT optimized for any particular stocks / instruments.
Enjoy~~!!

TICK strategy for SPY optionsImportant notes:
1. This strategy is designed for same day SPY option scalping. All profit shown in back testing report is based on Profit/Loss (P/L) estimates from trading options with approximately 6 months of data. By default, it is set to 10 option contracts. By default the initial capital is set to $5000. Pyramiding is set to 3.
2. This strategy works better with non-extended market data.
3. This strategy is mainly developed for SPY trading on 5 min chart, it probably will not be very profitable with other tickers or time frame without tweaking all the parameters first.
4. This strategy will work with QQQ as well, but please adjust the profit multiplier to match the P/L of QQQ options.
How it works:
When trading the indices, many rely on the TICK for market directions. This strategy is a trend following strategy that uses a combination of conditions using the following indicators:
- TICK
- RSI
- VIX volatility index
- EMA
For entries, the conditions are:
1. TICK moving average crossover with a delayed signal line
2. Bullish or bearish RSI signal, RSI > 50 for bullish, < 50 for bearish
3. VIX must be above a certain threshold to take advantage of high market volatility
4. Price must be on top of EMA line for long, and below for short
For exits, there are 3 scenarios:
1. Stop loss set by a percentage of the daily ATR value
2. Trend changes on the TICK and the RSI
3. Bearish or bullish divergence on price with TICK
This strategy automatically signal to close all trades at 3:50 pm EST at the end of the day.
Extras:
- There is an option to show P/L for reinvesting profits
Enjoy~!!! Let's all make $$$

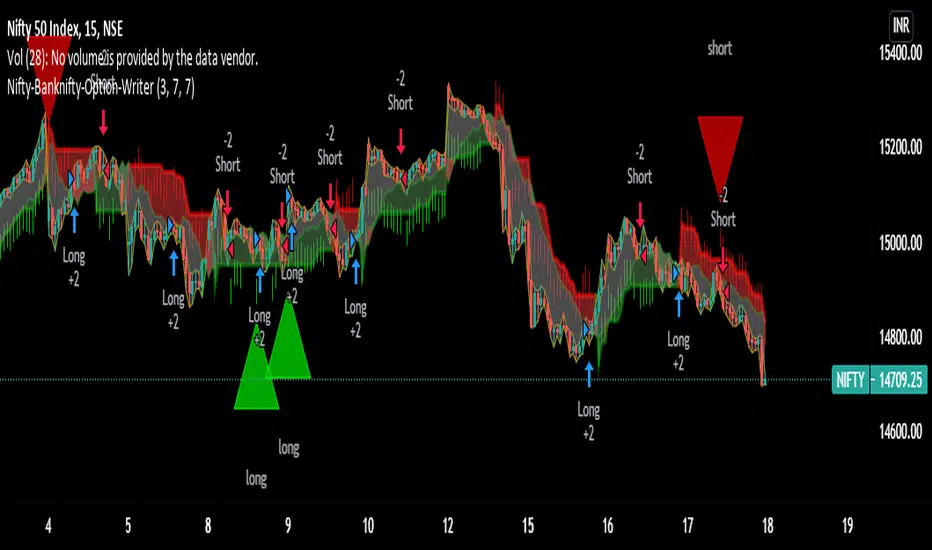
Nifty-Banknifty-Option-WriterNifty-Banknifty-Option-Writer tool is having signals like below
1) Bullish signal for taking long trade
2) Bearish signal for taking short trade
3) Triangle UP signal for trend change Long trade
4) Triangle Down signal for trend change Short trade
5) Big Arrow down signal for closing long trade if u have any short trades
6) Big Arrow UP signal for closing Short trade if i have any long trades
7) This tool is having three zone GREEN, RED and GRAY
8) small red arrow and small green arrow
===========================================================================================
How to use this tool:-
You should take long trade in index call option or sell put option when you will get Bullish signal or Big green Triangle and book the profit when you get any red signal either Its Big red triangle or Bearish signal or big downward red arrow close long trade or small red arrow.
Similarly you can take long trade for Index put option or sell call option for Short trade when you get Bearish signal or Big red triangle and book the profit when you will get close long big green arrow signal or small green arrow or Bullish signal or Big green triangle.
-If candle formation is having above GREEN and GRAY zone then it signifies strength is bullish and remain in Long trade till you are not getting close long trade signal or small red downward arrow signal.
-If candle formation is happening below RED and GRAY zone then it signifies strength is bearish and remain in short trade till you are not getting close short trade signal or small green upward arrow signal.
I have taken combination of ATR, Super trend and RSI to get the trend and trend change of underlying.
this tool i have created for any underlying not specific to Nifty or Banknifty though I have used this name so Indian can take benefit for Index trading.
Still didn't understand then ping me or give me call on my number given in signature i will make zoom call with you so will understand how to use this script.
=============================================================
I have taking consideration of Bullish and Bearish trade for strategy and its giving its optimal result in 1 hr time frame.
I have added commission/slippage for trade so actual result can be displayed in strategy tester.
Ping me or DM me to subscribe this indicator.
I have given all my indicator details below link (Signature URL). You can check indicators and call me on given number or email me on given email to access the scripts and indicators. Telegram link is also given you can ping me there.
--------------------------------------------------------------------------------------------------------------------------------------
Disclaimer : Past performance of the indicator is not giving guarantee for future performance as well, it may change as per market condition.
-------------------------------------------------------------------------------------------------------------------------------------