string_utilsLibrary "string_utils"
Collection of string utilities that can be used to replace sub-strings in a string and string functions
that are not part of the standard library.
This a more simple replacement of my previous string_variables library since it uses types for better
performance due to data locality and methods that give a more intuitive API.
Penunjuk dan strategi

Feature ScalingLibrary "Feature_Scaling"
FS: This library helps you scale your data to certain ranges or standarize, normalize, unit scale or min-max scale your data in your prefered way. Mostly used for normalization purposes.
minmaxscale(source, min, max, length)
minmaxscale: Min-max normalization scales your data to set minimum and maximum range
Parameters:
source
min
max
length
Returns: res: Data scaled to the set minimum and maximum range
meanscale(source, length)
meanscale: Mean normalization of your data
Parameters:
source
length
Returns: res: Mean normalization result of the source
standarize(source, length, biased)
standarize: Standarization of your data
Parameters:
source
length
biased
Returns: res: Standarized data
unitlength(source, length)
unitlength: Scales your data into overall unit length
Parameters:
source
length
Returns: res: Your data scaled to the unit length
TableBuilderLibrary "TableBuilder"
A helper library to make it simpler to create tables in pinescript
This is a simple table building library that I created because I personally feel that the built-in table building method is too verbose. It features chaining methods and variable arguments.
There are many features that are lacking because the implementation is early, and there may be antipatterns because I am not familiar with the runtime behavior like pinescript. If you have any comments on code improvements or features you want, please comment :D

SILLibrary "SIL"
mean_src(x, y)
calculates moving average : x is the source of price (OHLC) & y = the lookback period
Parameters:
x
y
stan_dev(x, y, z)
calculates standard deviation, x = source of price (OHLC), y = the average lookback, z = average given prior two float and intger inputs, call the f_avg_src() function in f_stan_dev()
Parameters:
x
y
z
vawma(x, y)
calculates volume weighted moving average, x = source of price (OHLC), y = loookback period
Parameters:
x
y
gethurst(x, y, z)
calculates the Hurst Exponent and Hurst Exponent average, x = source of price (OHLC), y = lookback period for Hurst Exponent Calculation, z = lookback period for average Hurst Exponent
Parameters:
x
y
z


WarCalendarLibrary "WarCalendar"
This library is a data provider for important Dates and Times from the Economic Calendar.
events()
Returns the list of dates supported by this library as a string array.
Returns: array : Names of events supported by this library
warstart()

libKageMiscLibrary "libKageMisc"
Kage's Miscelaneous library
print(_value)
Print a numerical value in a label at last historical bar.
Parameters:
_value : (float) The value to be printed.
Returns: Nothing.
barsBackToDate(_year, _month, _day)
Get the number of bars we have to go back to get data from a specific date.
Parameters:
_year : (int) Year of the specific date.
_month : (int) Month of the specific date. Optional. Default = 1.
_day : (int) Day of the specific date. Optional. Default = 1.
Returns: (int) Number of bars to go back until reach the specific date.
bodySize(_index)
Calculates the size of the bar's body.
Parameters:
_index : (simple int) The historical index of the bar. Optional. Default = 0.
Returns: (float) The size of the bar's body in price units.
shadowSize(_direction)
Size of the current bar shadow. Either "top" or "bottom".
Parameters:
_direction : (string) Direction of the desired shadow.
Returns: (float) The size of the chosen bar's shadow in price units.
shadowBodyRatio(_direction)
Proportion of current bar shadow to the bar size
Parameters:
_direction : (string) Direction of the desired shadow.
Returns: (float) Ratio of the shadow size per body size.
bodyCloseRatio(_index)
Proportion of chosen bar body size to the close price
Parameters:
_index : (simple int) The historical index of the bar. Optional. Default = 0.()
Returns: (float) Ratio of the body size per close price.
lastDayOfMonth(_month)
Returns the last day of a month.
Parameters:
_month : (int) Month number.
Returns: (int) The number (28, 30 or 31) of the last day of a given month.
nameOfMonth(_month)
Return the short name of a month.
Parameters:
_month : (int) Month number.
Returns: (string) The short name ("Jan", "Feb"...) of a given month.
pl(_initialValue, _finalValue)
Calculate Profit/Loss between two values.
Parameters:
_initialValue : (float) Initial value.
_finalValue : (float) Final value = Initial value + delta.
Returns: (float) Profit/Loss as a percentual change.
gma(_Type, _Source, _Length)
Generalist Moving Average (GMA).
Parameters:
_Type : (string) Type of average to be used. Either "EMA", "HMA", "RMA", "SMA", "SWMA", "WMA" or "VWMA".
_Source : (series float) Series of values to process.
_Length : (simple int) Number of bars (length).
Returns: (float) The value of the chosen moving average.
xFormat(_percentValue, _minXFactor)
Transform a percentual value in a X Factor value.
Parameters:
_percentValue : (float) Percentual value to be transformed.
_minXFactor : (float) Minimum X Factor to that the conversion occurs. Optional. Default = 10.
Returns: (string) A formated string.
isLong()
Check if the open trade direction is long.
Returns: (bool) True if the open position is long.
isShort()
Check if the open trade direction is short.
Returns: (bool) True if the open position is short.
lastPrice()
Returns the entry price of the last openned trade.
Returns: (float) The last entry price.
barsSinceLastEntry()
Returns the number of bars since last trade was oppened.
Returns: (series int)
getBotNameFrosty()
Return the name of the FrostyBot Bot.
Returns: (string) A string containing the name.
getBotNameZig()
Return the name of the FrostyBot Bot.
Returns: (string) A string containing the name.
getTicksValue(_currencyValue)
Converts currency value to ticks
Parameters:
_currencyValue : (float) Value to be converted.
Returns: (float) Value converted to minticks.
getSymbol(_botName, _botCustomSymbol)
Formats the symbol string to be used with a bot
Parameters:
_botName : (string) Bot name constant. Either BOT_NAME_FROSTY or BOT_NAME_ZIG. Optional. Default is empty string.
_botCustomSymbol : (string) Custom string. Optional. Default is empy string.
Returns: (string) A string containing the symbol for the bot. If all arguments are empty, the current symbol is returned in Binance format.
showProfitLossBoard()
Calculates and shows a board of Profit/Loss through the years.
Returns: Nothing.
libKageBotLibrary "libKageBot"
Library of function to generate command strings for bots FrostyBot and Zignally. This version ONLY WORKS WITH FROSTYBOT.
strSize(_sizePercent, _sizeCurrency)
Converts a float to a formated string suitable to position size in percentage or currency. At leaste one parameter must be given
Parameters:
_sizePercent : (float) Position size in percent value. Optional. Default = na. Mandatory if _sizeCurrency is not given.
_sizeCurrency : (float) Position size in currency value. Optional. Default = na. Mandatory if _sizePercent is not given.
Returns: (string) A formated string containing the position size
entry(_bot, _direction, _sizePercent, _sizeCurrency)
Generates a simple entry command string for a bot
Parameters:
_bot : (TradeBot) Previously instancied bot type variable
_direction : (string) Flag to opena long or a short position. Must be either DIRECTION_LONG or DIRECTION_SHORT constant
_sizePercent : (float) Position size in percent value. Optional. Default = na. Mandatory if _sizeCurrency is not given.
_sizeCurrency : (float) Position size in currency value. Optional. Default = na. Mandatory if _sizePercent is not given.
Returns: (string) A string of a simple open position command
exit(_bot, _sizePercent, _sizeCurrency, _reduce)
Generates a simple exit command string for a bot
Parameters:
_bot : (TradeBot) Previously instancied bot type variable
_sizePercent : (float) Position size in percent value. Optional. Default = na. Mandatory if _sizeCurrency is not given.
_sizeCurrency : (float) Position size in currency value. Optional. Default = na. Mandatory if _sizePercent is not given.
_reduce : (bool) Flag to use Ruce Only option on Binance positions. Optional. Default = true
Returns: (string) A string of a simple close position command
cancelAll(_bot)
Generates a command string for a bot that cancels all open orders
Parameters:
_bot : (TradeBot) Previously instancied bot type variable
Returns: (string) A string of a command to cancel all open orders
leverage(_bot, _leverage, _type)
Generates a command string for a bot to set leverage
Parameters:
_bot : (TradeBot) Previously instancied bot type variable
_leverage : (int) The amount of leverage to be used when opening a position. Optional. If does not given, the bot's default will be used
_type : (string) Type of leverage. Must be either LEVERAGE_CROSS or LEVERAGE_ISOLATED. Optional. Default is LEVERAGE_CROSS.
Returns: (string) A string of a simple leverage command
entryLong(_bot, _leverage, _leverageType, _sizePercent, _sizeCurrency)
Generates a complete long entry command string for a bot
Parameters:
_bot : (TradeBot) Previously instancied bot type variable
_leverage : (int) The amount of leverage to be used when opening a position. Optional. If does not given, the bot's default will be used
_leverageType : (string) Type of leverage. Must be either LEVERAGE_CROSS or LEVERAGE_ISOLATED. Optional. Default is LEVERAGE_CROSS.
_sizePercent : (float) Position size in percent value. Optional. Default = na. Mandatory if _sizeCurrency is not given.
_sizeCurrency : (float) Position size in currency value. Optional. Default = na. Mandatory if _sizePercent is not given.
Returns: (string) A string of a complete open long position command
entryShort(_bot, _leverage, _leverageType, _sizePercent, _sizeCurrency)
Generates a complete short entry command string for a bot
Parameters:
_bot : (TradeBot) Previously instancied bot type variable
_leverage : (int) The amount of leverage to be used when opening a position. Optional. If does not given, the bot's default will be used
_leverageType
_sizePercent : (float) Position size in percent value. Optional. Default = na. Mandatory if _sizeCurrency is not given.
_sizeCurrency : (float) Position size in currency value. Optional. Default = na. Mandatory if _sizePercent is not given.
Returns: (string) A string of a complete open short position command
exitPosition(_bot, _sizePercent, _sizeCurrency, _reduce)
Generates a complete close position command string for a bot
Parameters:
_bot : (TradeBot) Previously instancied bot type variable
_sizePercent : (float) Position size in percent value. Optional. Default = na. Mandatory if _sizeCurrency is not given.
_sizeCurrency : (float) Position size in currency value. Optional. Default = na. Mandatory if _sizePercent is not given.
_reduce : (bool) Flag to use Ruce Only option on Binance positions. Optional. Default = true
Returns: (string) A string of a comlete close position command
printBot(_bot, _command)
Print bot's information for debug purposes
Parameters:
_bot : (TradeBot) Previously instancied bot type variable
_command : (string) A command string to be debugged
Returns: Nothing.
Constants
Constants to be used in both in internal and external code
Fields:
SERVER_FROSTBOT : (string) Identifier to FrostyBot
SERVER_ZIGNALY : (string) Identifier to Zignaly
DIRECTION_LONG : (string) Flag to open a long position
DIRECTION_SHORT
LEVERAGE_CROSS : (string) Flag to set leverage to cross
LEVERAGE_ISOLATED : (string) Flag to set leverage to isolated
TradeBot
Bot type to handle its essential information
Fields:
server : (string) Type o server. Must me one of the SERVER_* constant values
id : (string) Id of the account in the server (Stub for FrostyBot or Key to Zignally)
symbol : (string) Symbol of the pair to be negotiated (example: ETH/USDT)
leverage : (int) Leverage coeficient. Default is 1
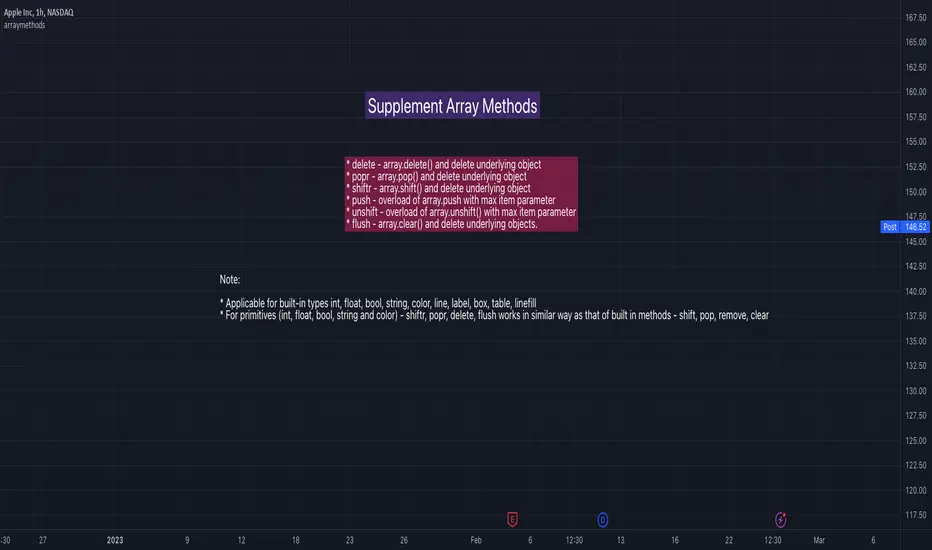
arraymethodsLibrary "arraymethods"
Supplementary array methods.
delete(arr, index)
remove int object from array of integers at specific index
Parameters:
arr : int array
index : index at which int object need to be removed
Returns: void
delete(arr, index)
remove float object from array of float at specific index
Parameters:
arr : float array
index : index at which float object need to be removed
Returns: float
delete(arr, index)
remove bool object from array of bool at specific index
Parameters:
arr : bool array
index : index at which bool object need to be removed
Returns: bool
delete(arr, index)
remove string object from array of string at specific index
Parameters:
arr : string array
index : index at which string object need to be removed
Returns: string
delete(arr, index)
remove color object from array of color at specific index
Parameters:
arr : color array
index : index at which color object need to be removed
Returns: color
delete(arr, index)
remove line object from array of lines at specific index and deletes the line
Parameters:
arr : line array
index : index at which line object need to be removed and deleted
Returns: void
delete(arr, index)
remove label object from array of labels at specific index and deletes the label
Parameters:
arr : label array
index : index at which label object need to be removed and deleted
Returns: void
delete(arr, index)
remove box object from array of boxes at specific index and deletes the box
Parameters:
arr : box array
index : index at which box object need to be removed and deleted
Returns: void
delete(arr, index)
remove table object from array of tables at specific index and deletes the table
Parameters:
arr : table array
index : index at which table object need to be removed and deleted
Returns: void
delete(arr, index)
remove linefill object from array of linefills at specific index and deletes the linefill
Parameters:
arr : linefill array
index : index at which linefill object need to be removed and deleted
Returns: void
popr(arr)
remove last int object from array
Parameters:
arr : int array
Returns: int
popr(arr)
remove last float object from array
Parameters:
arr : float array
Returns: float
popr(arr)
remove last bool object from array
Parameters:
arr : bool array
Returns: bool
popr(arr)
remove last string object from array
Parameters:
arr : string array
Returns: string
popr(arr)
remove last color object from array
Parameters:
arr : color array
Returns: color
popr(arr)
remove and delete last line object from array
Parameters:
arr : line array
Returns: void
popr(arr)
remove and delete last label object from array
Parameters:
arr : label array
Returns: void
popr(arr)
remove and delete last box object from array
Parameters:
arr : box array
Returns: void
popr(arr)
remove and delete last table object from array
Parameters:
arr : table array
Returns: void
popr(arr)
remove and delete last linefill object from array
Parameters:
arr : linefill array
Returns: void
shiftr(arr)
remove first int object from array
Parameters:
arr : int array
Returns: int
shiftr(arr)
remove first float object from array
Parameters:
arr : float array
Returns: float
shiftr(arr)
remove first bool object from array
Parameters:
arr : bool array
Returns: bool
shiftr(arr)
remove first string object from array
Parameters:
arr : string array
Returns: string
shiftr(arr)
remove first color object from array
Parameters:
arr : color array
Returns: color
shiftr(arr)
remove and delete first line object from array
Parameters:
arr : line array
Returns: void
shiftr(arr)
remove and delete first label object from array
Parameters:
arr : label array
Returns: void
shiftr(arr)
remove and delete first box object from array
Parameters:
arr : box array
Returns: void
shiftr(arr)
remove and delete first table object from array
Parameters:
arr : table array
Returns: void
shiftr(arr)
remove and delete first linefill object from array
Parameters:
arr : linefill array
Returns: void
push(arr, val, maxItems)
add int to the end of an array with max items cap. Objects are removed from start to maintain max items cap
Parameters:
arr : int array
val : int object to be pushed
maxItems : max number of items array can hold
Returns: int
push(arr, val, maxItems)
add float to the end of an array with max items cap. Objects are removed from start to maintain max items cap
Parameters:
arr : float array
val : float object to be pushed
maxItems : max number of items array can hold
Returns: float
push(arr, val, maxItems)
add bool to the end of an array with max items cap. Objects are removed from start to maintain max items cap
Parameters:
arr : bool array
val : bool object to be pushed
maxItems : max number of items array can hold
Returns: bool
push(arr, val, maxItems)
add string to the end of an array with max items cap. Objects are removed from start to maintain max items cap
Parameters:
arr : string array
val : string object to be pushed
maxItems : max number of items array can hold
Returns: string
push(arr, val, maxItems)
add color to the end of an array with max items cap. Objects are removed from start to maintain max items cap
Parameters:
arr : color array
val : color object to be pushed
maxItems : max number of items array can hold
Returns: color
push(arr, val, maxItems)
add line to the end of an array with max items cap. Objects are removed and deleted from start to maintain max items cap
Parameters:
arr : line array
val : line object to be pushed
maxItems : max number of items array can hold
Returns: line
push(arr, val, maxItems)
add label to the end of an array with max items cap. Objects are removed and deleted from start to maintain max items cap
Parameters:
arr : label array
val : label object to be pushed
maxItems : max number of items array can hold
Returns: label
push(arr, val, maxItems)
add box to the end of an array with max items cap. Objects are removed and deleted from start to maintain max items cap
Parameters:
arr : box array
val : box object to be pushed
maxItems : max number of items array can hold
Returns: box
push(arr, val, maxItems)
add table to the end of an array with max items cap. Objects are removed and deleted from start to maintain max items cap
Parameters:
arr : table array
val : table object to be pushed
maxItems : max number of items array can hold
Returns: table
push(arr, val, maxItems)
add linefill to the end of an array with max items cap. Objects are removed and deleted from start to maintain max items cap
Parameters:
arr : linefill array
val : linefill object to be pushed
maxItems : max number of items array can hold
Returns: linefill
unshift(arr, val, maxItems)
add int to the beginning of an array with max items cap. Objects are removed from end to maintain max items cap
Parameters:
arr : int array
val : int object to be unshift
maxItems : max number of items array can hold
Returns: int
unshift(arr, val, maxItems)
add float to the beginning of an array with max items cap. Objects are removed from end to maintain max items cap
Parameters:
arr : float array
val : float object to be unshift
maxItems : max number of items array can hold
Returns: float
unshift(arr, val, maxItems)
add bool to the beginning of an array with max items cap. Objects are removed from end to maintain max items cap
Parameters:
arr : bool array
val : bool object to be unshift
maxItems : max number of items array can hold
Returns: bool
unshift(arr, val, maxItems)
add string to the beginning of an array with max items cap. Objects are removed from end to maintain max items cap
Parameters:
arr : string array
val : string object to be unshift
maxItems : max number of items array can hold
Returns: string
unshift(arr, val, maxItems)
add color to the beginning of an array with max items cap. Objects are removed from end to maintain max items cap
Parameters:
arr : color array
val : color object to be unshift
maxItems : max number of items array can hold
Returns: color
unshift(arr, val, maxItems)
add line to the beginning of an array with max items cap. Objects are removed and deleted from end to maintain max items cap
Parameters:
arr : line array
val : line object to be unshift
maxItems : max number of items array can hold
Returns: line
unshift(arr, val, maxItems)
add label to the beginning of an array with max items cap. Objects are removed and deleted from end to maintain max items cap
Parameters:
arr : label array
val : label object to be unshift
maxItems : max number of items array can hold
Returns: label
unshift(arr, val, maxItems)
add box to the beginning of an array with max items cap. Objects are removed and deleted from end to maintain max items cap
Parameters:
arr : box array
val : box object to be unshift
maxItems : max number of items array can hold
Returns: box
unshift(arr, val, maxItems)
add table to the beginning of an array with max items cap. Objects are removed and deleted from end to maintain max items cap
Parameters:
arr : table array
val : table object to be unshift
maxItems : max number of items array can hold
Returns: table
unshift(arr, val, maxItems)
add linefill to the beginning of an array with max items cap. Objects are removed and deleted from end to maintain max items cap
Parameters:
arr : linefill array
val : linefill object to be unshift
maxItems : max number of items array can hold
Returns: linefill
flush(arr)
remove all int objects in an array
Parameters:
arr : int array
Returns: int
flush(arr)
remove all float objects in an array
Parameters:
arr : float array
Returns: float
flush(arr)
remove all bool objects in an array
Parameters:
arr : bool array
Returns: bool
flush(arr)
remove all string objects in an array
Parameters:
arr : string array
Returns: string
flush(arr)
remove all color objects in an array
Parameters:
arr : color array
Returns: color
flush(arr)
remove and delete all line objects in an array
Parameters:
arr : line array
Returns: line
flush(arr)
remove and delete all label objects in an array
Parameters:
arr : label array
Returns: label
flush(arr)
remove and delete all box objects in an array
Parameters:
arr : box array
Returns: box
flush(arr)
remove and delete all table objects in an array
Parameters:
arr : table array
Returns: table
flush(arr)
remove and delete all linefill objects in an array
Parameters:
arr : linefill array
Returns: linefill
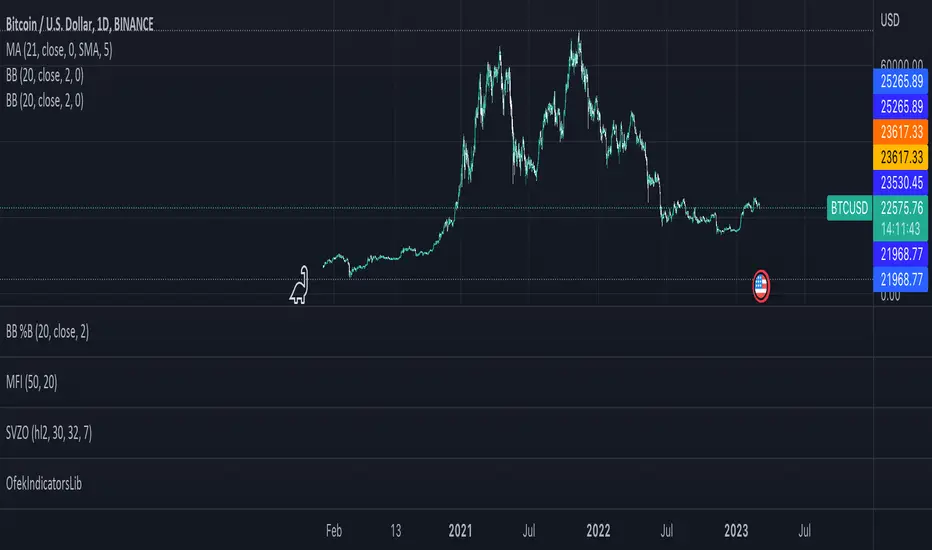
OfekIndicatorsLibLibrary "OfekIndicatorsLib"
TODO: add library description here
ichiClouds(conversionPeriods, basePeriods, laggingSpan2Periods)
Parameters:
conversionPeriods
basePeriods
laggingSpan2Periods
trama(tramaSrc, tramaLength)
Parameters:
tramaSrc
tramaLength
kdj(ilong, isig, startFrom)
Parameters:
ilong
isig
startFrom(look into history)
Linear_Regression_SlopeLibrary "Linear_Regression_Slope"
linreg_slope(a, b)
Parameters:
a
b
This library is available to anyone.
This library calculates the linear regression slope.
Be sure to use the source value for a.
(End price, high price, low price, market price)
Please set a period for b.
Overlay is set to false.

Vector2FunctionClipLibrary "Vector2FunctionClip"
Sutherland-Hodgman polygon clipping algorithm.
reference:
.
rosettacode.org
.
clip(source, reference)
Perform Clip operation on a vector with another.
Parameters:
source : array . Source polygon to be clipped.
reference : array . Reference polygon to clip source.
Returns: array.

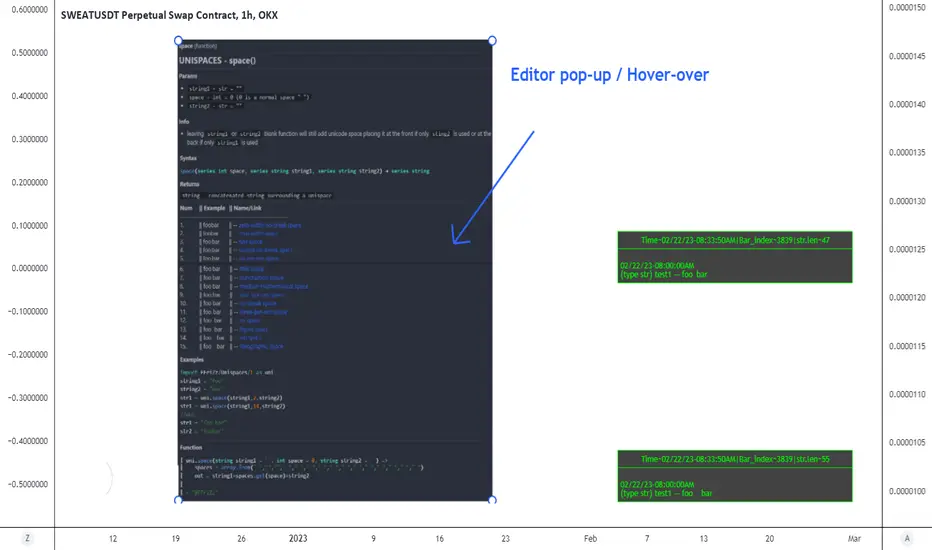
UnispacesLibrary "Unispaces"
Easier than looking up unicode spaces
spaces(sequence, string1, string2)
UNISPACES
Parameters:
sequence : (int) required | 123 = 3 spaces / 3 different sizes (one space per number can find spaces in hover over)
string1 : (str) optional | default = ""
string2 : (str) optional | default = ""
Returns: `string - concatenated string surrounding unispaces`
space(space, string1, string2)
UNISPACE
Parameters:
space : (int) optional | default = 0 | 0-15 (can find spaces in hover over)
string1 : (str) optional | default = ""
string2 : (str) optional | default = ""
Returns: `string - concatenated string surrounding a unispace `
Markdown: The Pine Editor's Hidden Gem💬 Markdown, a markup language
Markdown is a portable, lightweight markup language that can be used for everything whether you're building a website, documentation, or even presentations.
Platforms like Discord, Reddit, and GitHub support Markdown and is the widely go-to option for text formatting due to its simplicity. Pine Script is a language that also utilizes Markdown, specifically in the Pine Editor where it can really be used to some extent.
Since the release of libraries, user-defined types, and methods, Pine Script is entering an age where developers will be highly dependent on libraries due to the capabilities Pine has inherited recently. It would be no surprise if a few people got together and took their time to thoroughly develop an entire project/library centered around improving Pine Script's built-in functions and providing developers with easier ways of achieving things than they thought they could.
As you're all aware, hovering over functions (and more) in the editor pops up a prompt that specifies the parameters, types, and what the function returns. Pine Script uses Markdown for that, so I figured we could go ahead and push that feature to its limits and see what we can do.
Today we'll go over how we can utilize Markdown in Pine Script, and how you can make your library's built-in functions stand out more than they did previously.
For more information, visit www.markdownguide.org
📕 General Notes
Markdown syntax only works on functions and methods.
Using arrays as parameters as of 2/21/2023 breaks the Markdown system.
The prompt window holds a max of 166 characters on one line before overflowing.
There is no limit on how long the prompt window can be.
🔽 Getting Started 🔽
▶️ Headings
If you have experience in HTML, Markdown, or even Microsoft Word then you already have a grasp of how headings work and look.
To simplify it, headings make the given text either massive or tiny depending on how many number symbols are provided.
When defining headings, you must have a space between the number (#) symbol, and the text. This is typical syntax throughout the language.
Pine Script uses bold text by applying (**) for their titles on their built-ins (e.g. @returns) but you could also use heading level 4 (####) and have it look the same.
▶️ Paragraphs & Line Breaks
You may want to provide extensive details and examples relating to one function, in this case, you could create line breaks. Creating line breaks skips to the next line so you can keep things organized as a result.
To achieve a valid line break and create a new paragraph, you must end the line with two or more spaces.
If you want to have an empty line in between, apply a backslash (\).
Backslashes (\) are generally not recommended for every line break. In this case, I only recommend using them for empty lines.
▶️ Text Formatting
Markdown provides text formatting such as bold, italics, and strikethrough.
For bolding text, you can apply open and close (**) or (__).
For italicizing text, you can apply open and close (*) or (_).
For bolding and italicizing text, you can apply open and close (***) or (___).
For s̶t̶r̶i̶k̶e̶t̶h̶r̶o̶u̶g̶h̶, you need to apply open and close (~~).
This was mentioned in the Headers section, but Pine Script's main titles (e.g. @returns or @syntax) use bold (**) by default.
▶️ Blockquotes
Blockquotes in Pine Script can be visualized as a built-in indentation system.
They are declared using greater than (>) and everything will be auto-aligned and indented until closed.
By convention you generally want to include the greater than (>) on every line that's included in the block quote. Even when not needed.
If you would like to indent even more (nested blockquotes), you can apply multiple greater than symbols (>). For example, (>>)
Blockquotes can be closed by ending the next line with only one greater than (>) symbol, or by using a horizontal rule.
▶️ Horizontal Rules
Horizontal rules in Pine Script are what you see at the very top of the prompt in built-ins.
When hovering, you can see the top of the prompt provides a line, and we can actually reproduce these lines.
These are extremely useful for separating information into their own parts and are accessed by applying 3 underscores (___), or 3 asterisks (***).
Horizontal rules were mentioned above, when we were discussing block quotes. These can also be used to close blockquotes as well.
Horizontal rules require a minimum of 3 underscores (___) or 3 asterisks (***).
▶️ Lists
Lists give us a way to structure data in a somewhat neat way. There are multiple ways to start a list, such as
1. First Item (number followed by a period)
- First Item (dash)
+ First Item (plus sign)
* First Item (asterisk)
Using number-based lists provide an ordered list, whereas using (-), (+), or (*) will provide an unordered list (bullet points).
If you want to begin an unordered list with a number that ends with a period, you must use an escape sequence (\) after the number.
Standard indentation (tab-width) list detection isn't supported, so to nest lists you have to use blockquotes (>) which may not look as appealing.
▶️ Code Blocks
Using code blocks allows you to write actual Pine Script code inside the prompt.
It's a game changer that can potentially help people understand how to execute functions quickly.
To use code blocks, apply three 3 open and close backquotes (```). Built-in's use (```pine) but there's no difference when we apply it.
Considering that tab-width indentation isn't detected properly, we can make use of the blockquotes mentioned above.
▶️ Denotation
Denoting can also be seen as highlighting a background layer behind text. They're basically code blocks, but without the "block".
Similar to how code blocks work, we apply one backquote open and close (`).
Make sure to only use this on important keywords. There really isn't a conventional way of applying this.
It's up to you to decide what people should have their eyes tracked onto when they hover over your functions.
If needed, look at how Pine Script's built-in variables and functions utilize this.
▶️ Tables
Tables are possible in Markdown, although they may look a bit different in the Pine Editor.
They are made by separating text with vertical bars (|).
The headers are detected when there is a minimum of one hyphen (-) below them.
You can align text by using a colon as I do in the photo. Hyphens must be connected to the colon in order to display correctly.
Tables aren't ideal to use in the editor but are there if anyone wants to give it a go.
▶️ Links & Images
Markdown supports images and hyperlinks, which means we can also do that here in the Pine Editor. Cool right?
If you want to create a hyperlink, surround the displayed text in open and close brackets .
If you want to load a photo into your prompt, it's the same syntax as the hyperlink, except it uses a (!)
See syntax list below.
Here are realistic usage examples. (Snippets from code below)
These follow the same syntax as the built-ins.
I'm not using horizontal rules here, but it's entirely up to you.
▶️ Syntax List
Headings
Level 1: #
Level 2: ##
Level 3: ###
Level 4: ####
Level 5: #####
Level 6: ######
Line Breaks
Text (two spaces)
Text\ (backslash)
Text Formatting
Bold (**)
Italic (**)
Strikethrough (~~)
Blockquotes
Indent (>)
Double Indent (>>)
Triple Indent (>>>) and so on.
Horizontal Rules
(___) or (***)
Lists
Ordered List (1.)
Unordered List (-) or (+) or (*)
Code Blocks
(```) or (```pine)
Denotation
(`)
Tables
(|) and (-) and (:)
Hyperlinks
(URL)
Images
! (URL)
Hope this helps. 👍

ulibLibrary "ulib"
Stochastic(length, d_smooth)
Parameters:
length
d_smooth
bull_stoch_condition(k, d)
Parameters:
k
d
ema_condition(ema_1, ema_2, ema_3)
Parameters:
ema_1
ema_2
ema_3
bull_fractal_condition(n)
Parameters:
n
Bull(Fractal, ema, stochastic_osc)
Parameters:
Fractal
ema
stochastic_osc
Vector2ArrayLibrary "Vector2Array"
functions to handle vector2 Array operations.
.
references:
docs.unity3d.com
gist.github.com
github.com
gist.github.com
gist.github.com
gist.github.com
.
from(source, prop_sep, vect_sep)
Generate array of vector2 from string.
Parameters:
source : string Source string of the vectors.
prop_sep : string Separator character of the vector properties (x`,`y).
vect_sep : string Separator character of the vectors ((x,y)`;`(x,y)).
Returns: array.
max(vectors)
Combination of the highest elements in column of a array of vectors.
Parameters:
vectors : array, Array of Vector2 objects.
Returns: Vector2.Vector2, Vector2 object.
-> usage:
`a = Vector2.from(1.0) , b = Vector2.from(2.0), c = Vector2.from(3.0), d = max(array.from(a, b, c)) , plot(d.x)`
min(vectors)
Combination of the lowest elements in column of a array of vectors.
Parameters:
vectors : array, Array of Vector2 objects.
Returns: Vector2.Vector2, Vector2 object.
-> usage:
`a = Vector2.from(1.0) , b = Vector2.from(2.0), c = Vector2.from(3.0), d = min(array.from(a, b, c)) , plot(d.x)`
sum(vectors)
Total sum of all vectors.
Parameters:
vectors : array, ID of the vector2 array.
Returns: Vector2.Vector2, vector2 object.
-> usage:
`a = Vector2.from(1.0) , b = Vector2.from(2.0), c = Vector2.from(3.0), d = sum(array.from(a, b, c)) , plot(d.x)`
center(vectors)
Finds the vector center of the array.
Parameters:
vectors : array, ID of the vector2 array.
Returns: Vector2.Vector2, vector2 object.
-> usage:
`a = Vector2.from(1.0) , b = Vector2.from(2.0), c = Vector2.from(3.0), d = center(array.from(a, b, c)) , plot(d.x)`
rotate(vectors, center, degree)
Rotate Array vectors around origin vector by a angle.
Parameters:
vectors : array, ID of the vector2 array.
center : Vector2.Vector2 , Vector2 object. Center of the rotation.
degree : float , Angle value.
Returns: rotated points array.
-> usage:
`a = Vector2.from(1.0) , b = Vector2.from(2.0), c = Vector2.from(3.0), d = rotate(array.from(a, b, c), b, 45.0)`
scale(vectors, center, rate)
Scale Array vectors based on a origin vector perspective.
Parameters:
vectors : array, ID of the vector2 array.
center : Vector2.Vector2 , Vector2 object. Origin center of the transformation.
rate : float , Rate to apply transformation.
Returns: rotated points array.
-> usage:
`a = Vector2.from(1.0) , b = Vector2.from(2.0), c = Vector2.from(3.0), d = scale(array.from(a, b, c), b, 1.25)`
move(vectors, center, rate)
Move Array vectors by a rate of the distance to center position (LERP).
Parameters:
vectors : array, ID of the vector2 array.
center
rate
Returns: Moved points array.
-> usage:
`a = Vector2.from(1.0) , b = Vector2.from(2.0), c = Vector2.from(3.0), d = move(array.from(a, b, c), b, 1.25)`
to_string(id, separator)
Reads a array of vectors into a string, of the form ` `.
Parameters:
id : array, ID of the vector2 array.
separator : string separator for cell splitting.
Returns: string Translated complex array into string.
-> usage:
`a = Vector2.from(1.0) , b = Vector2.from(2.0), c = Vector2.from(3.0), d = to_string(array.from(a, b, c))`
to_string(id, format, separator)
Reads a array of vectors into a string, of the form ` `.
Parameters:
id : array, ID of the vector2 array.
format : string , Format to apply transformation.
separator : string , Separator for cell splitting.
Returns: string Translated complex array into string.
-> usage:
`a = Vector2.from(1.234) , b = Vector2.from(2.23), c = Vector2.from(3.1234), d = to_string(array.from(a, b, c), "#.##")`

Segment2Library "Segment2"
Structure representation of a directed straight line in two dimensions from origin to target vectors.
.
reference:
graphics.stanford.edu
.
new(origin, target)
Generate a new segment.
Parameters:
origin : Vector2 . Origin of the segment.
target : Vector2 . Target of the segment.
Returns: Segment2.
new(origin_x, origin_y, target_x, target_y)
Generate a new segment.
Parameters:
origin_x : float . Origin of the segment x coordinate.
origin_y : float . Origin of the segment y coordinate.
target_x : float . Target of the segment x coordinate.
target_y : float . Target of the segment y coordinate.
Returns: Segment2.
copy(this)
Copy a segment.
Parameters:
this : Vector2 . Segment to copy.
Returns: Segment2.
length_squared(this)
Squared length of the normalized segment vector. For comparing vectors this is computationaly lighter.
Parameters:
this : Segment2 . Sorce segment.
Returns: float.
length(this)
Length of the normalized segment vector.
Parameters:
this : Segment2 . Sorce segment.
Returns: float.
opposite(this)
Reverse the direction of the segment.
Parameters:
this : Segment2 . Source segment.
Returns: Segment2.
is_degenerate(this)
Segment is degenerate when origin and target are equal.
Parameters:
this : Segment2 . Source segment.
Returns: bool.
is_horizontal(this)
Segment is horizontal?.
Parameters:
this : Segment2 . Source segment.
Returns: bool.
is_horizontal(this, precision)
Segment is horizontal?.
Parameters:
this : Segment2 . Source segment.
precision : float . Limit of precision.
Returns: bool.
is_vertical(this)
Segment is vertical?.
Parameters:
this : Segment2 . Source segment.
Returns: bool.
is_vertical(this, precision)
Segment is vertical?.
Parameters:
this : Segment2 . Source segment.
precision : float . Limit of precision.
Returns: bool.
equals(this, other)
Tests two segments for equality (share same origin and target).
Parameters:
this : Segment2 . Source segment.
other : Segment2 . Target segment.
Returns: bool.
nearest_to_point(this, point)
Find the nearest point in a segment to another point.
Parameters:
this : Segment2 . Source segment.
point : Vector2 . Point to aproximate.
Returns: Vector2.
intersection(this, other)
Find the intersection vector of 2 lines.
Parameters:
this : Segment2 . Segment A.
other : Segment2 . Segment B.
Returns: Vector2.Vector2 Object.
extend(this, at_origin, at_target)
Extend a segment by the percent ratio provided.
Parameters:
this : Segment2 . Source segment.
at_origin : float . Percent ratio to extend at origin vector.
at_target : float . Percent ratio to extend at target vector.
Returns: Segment2.
to_string(this)
Translate segment to string format `( (x,y), (x,y) )`.
Parameters:
this : Segment2 . Source segment.
Returns: string.
to_string(this, format)
Translate segment to string format `((x,y), (x,y))`.
Parameters:
this : Segment2 . Source segment.
format : string . Format string to apply.
Returns: string.
to_array(this)
Translate segment to array format.
Parameters:
this : Segment2 . Source segment.
Returns: array.

PineTradingbotWebhookLibrary "PineTradingbotWebhook"
makeWebhookJson(webhookKey, direction, qty, entryLimit, entryStop, exitLimit, exitStop, orderRef, contract)
Creates a Webhook message for Tbot on Tradingboat
Parameters:
webhookKey : the unique key to the Flask (TVWB) server
direction : the same as the strategy's direction
qty
entryLimit
entryStop
exitLimit
exitStop
orderRef
contract
Returns: JSON as a string

Vector2DrawQuadLibrary "Vector2DrawQuad"
functions to handle vector2 Quad drawing operations.
new(a, b, c, d, xloc, bg_color, line_color, line_style, line_width)
Draws a quadrilateral with background fill.
Parameters:
a : v2 . Vector2 object, in the form `(x, y)`.
b : v2 . Vector2 object, in the form `(x, y)`.
c : v2 . Vector2 object, in the form `(x, y)`.
d : v2 . Vector2 object, in the form `(x, y)`.
xloc : string . Type of axis unit, bar_index or time.
bg_color : color . Color of the background.
line_color : color . Color of the line.
line_style : string . Style of the line.
line_width : int . Width of the line.
Returns: Quad object.
copy(this)
Copy a existing quad object.
Parameters:
this : Quad . Source quad.
Returns: Quad.
set_position_a(this, x, y)
Set the position of corner `a` (modifies source quad).
Parameters:
this : Quad . Source quad.
x : int . Value at the x axis.
y : float . Value at the y axis.
Returns: Source Quad.
set_position_a(this, position)
Set the position of corner `a` (modifies source quad).
Parameters:
this : Quad . Source quad.
position : Vector2 . New position.
Returns: Source Quad.
set_position_b(this, x, y)
Set the position of corner `b` (modifies source quad).
Parameters:
this : Quad . Source quad.
x : int . Value at the x axis.
y : float . Value at the y axis.
Returns: Source Quad.
set_position_b(this, position)
Set the position of corner `b` (modifies source quad).
Parameters:
this : Quad . Source quad.
position : Vector2 . New position.
Returns: Source Quad.
set_position_c(this, x, y)
Set the position of corner `c` (modifies source quad).
Parameters:
this : Quad . Source quad.
x : int . Value at the x axis.
y : float . Value at the y axis.
Returns: Source Quad.
set_position_c(this, position)
Set the position of corner `c` (modifies source quad).
Parameters:
this : Quad . Source quad.
position : Vector2 . New position.
Returns: Source Quad.
set_position_d(this, x, y)
Set the position of corner `d` (modifies source quad).
Parameters:
this : Quad . Source quad.
x : int . Value at the x axis.
y : float . Value at the y axis.
Returns: Source Quad.
set_position_d(this, position)
Set the position of corner `d` (modifies source quad).
Parameters:
this : Quad . Source quad.
position : Vector2 . New position.
Returns: Source Quad.
set_style(this, bg_color, line_color, line_style, line_width)
Update quad style options (modifies Source quad).
Parameters:
this : Quad . Source quad.
bg_color : color . Color of the background.
line_color : color . Color of the line.
line_style : string . Style of the line.
line_width : int . Width of the line.
Returns: Source Quad.
set_bg_color(this, bg_color)
Update quad style options (modifies Source quad).
Parameters:
this : Quad . Source quad.
bg_color : color . Color of the background.
Returns: Source Quad.
set_line_color(this, line_color)
Update quad style options (modifies Source quad).
Parameters:
this : Quad . Source quad.
line_color : color . Color of the line.
Returns: Source Quad.
set_line_style(this, line_style)
Update quad style options (modifies Source quad).
Parameters:
this : Quad . Source quad.
line_style : string . Style of the line.
Returns: Source Quad.
set_line_width(this, line_width)
Update quad style options (modifies Source quad).
Parameters:
this : Quad . Source quad.
line_width : int . Width of the line.
Returns: Source Quad.
move(this, x, y)
Move quad by provided amount (modifies source quad).
Parameters:
this : Quad . Source quad.
x : float . Amount to move the vertices of the quad in the x axis.
y : float . Amount to move the vertices of the quad in the y axis.
Returns: Source Quad.
move(this, amount)
Move quad by provided amount (modifies source quad).
Parameters:
this : Quad . Source quad.
amount : Vector2 . Amount to move the vertices of the quad in the x and y axis.
Returns: Source Quad.
rotate_around(this, center, angle)
Rotate source quad around a center (modifies source quad).
Parameters:
this : Quad . Source quad.
center : Vector2 . Center coordinates of the rotation.
angle : float . Value of angle in degrees.
Returns: Source Quad.
rotate_around(this, center_x, center_y, angle)
Rotate source quad around a center (modifies source quad).
Parameters:
this : Quad . Source quad.
center_x : int . Center coordinates of the rotation.
center_y : float . Center coordinates of the rotation.
angle : float . Value of angle in degrees.
Returns: Source Quad.
MathComplexNumbersThis is a Pine Script library for handling complex numbers without arrays. It contains several utility functions for performing various operations on complex numbers, including converting complex numbers into tuples, getting the real and imaginary parts of a complex number, adding and subtracting complex numbers, computing the conjugate, multiplying and dividing complex numbers, computing the reciprocal, the inverse, the negative, the exponential, the ceil and the radius of a complex number.
The library exports a complex data type which consists of two float values: re, the real part of the complex number, and im, the imaginary part of the complex number.
The complex_tuple function and ct function convert a complex number into a tuple, and the get_real, get_imaginary, re, and im functions return the real and imaginary parts of a complex number.
The add and subtract functions add and subtract two complex numbers, respectively, by performing the appropriate arithmetic operations on their real and imaginary parts. The conjugate function returns the complex conjugate of a given complex number, which is the same as the original number but with the sign of its imaginary part reversed. The multiply and divide functions multiply and divide two complex numbers, respectively, according to the rules of complex arithmetic. The reciprocal function computes the reciprocal or inverse of a given complex number, while the inverse function computes the inverse of a given complex number. The negative function returns the negative of a given complex number, and the exponential function computes the exponential of a given complex number. The ceil function rounds a given complex number up to a specified number of digits. The radius function computes the radius (magnitude) of a given complex number, which is defined as its distance from the origin (0,0) of the complex plane.