BasicVisibleChartBasic library for the visible range chart; with functions to allow plotting Fibs from body high/low as well as wick high/low
-Thanks to code from @PineCoders Visible Chart library (PineCoders/VisibleChart/4), which is a much more comprehensive library than this, but which does not include some functions that I find useful:
-Added the following exportable functions: highest/lowest body, highest/lowest close, highest/lowest open. These allow one to anchor fibs from bodies rather than wicks
-Added a Fib Box function in the example code
The above chart shows the example code plotting a Fib range drawn from bodies and a highlighted retracement zone (61.8 % - 78.6% )
~~All Exportable Functions~~
barIsVisible()
highestClose()
highestOpen()
highestBody()
lowestClose()
lowestOpen()
lowestBody()
high()
highBarTime()
low()
lowBarTime()
open()
close()
Penunjuk dan strategi

theme_presetsStyle Made Easy with 175 Reversable light/dark themes
Built on to of my theme engine, so any tools built with one
will work with the other.
getTheme(_input)
Get a theme by name. (see lib for copy/paste list)
Parameters:
_input : string Name of Theme to use.
apathy()
Theme preset -> "Apathy"
Returns: Theme object
apprentice()
Theme preset -> "Apprentice"
Returns: Theme object
ashes()
Theme preset -> "Ashes"
Returns: Theme object
atelier_cave()
Theme preset -> "Atelier Cave"
Returns: Theme object
atelier_dune()
Theme preset -> "Atelier Dune"
Returns: Theme object
atelier_estuary()
Theme preset -> "Atelier Estuary"
Returns: Theme object
atelier_forest()
Theme preset -> "Atelier Forest"
Returns: Theme object
atelier_heath()
Theme preset -> "Atelier Heath"
Returns: Theme object
atelier_lakeside()
Theme preset -> "Atelier Lakeside"
Returns: Theme object
atelier_plateau()
Theme preset -> "Atelier Plateau"
Returns: Theme object
atelier_savanna()
Theme preset -> "Atelier Savanna"
Returns: Theme object
atelier_seaside()
Theme preset -> "Atelier Seaside"
Returns: Theme object
atelier_sulphurpool()
Theme preset -> "Atelier Sulphurpool"
Returns: Theme object
atlas()
Theme preset -> "Atlas"
Returns: Theme object
ayu()
Theme preset -> "Ayu"
Returns: Theme object
ayu_mirage()
Theme preset -> "Ayu Mirage"
Returns: Theme object
bespin()
Theme preset -> "Bespin"
Returns: Theme object
black_metal()
Theme preset -> "Black Metal"
Returns: Theme object
black_metal_bathory()
Theme preset -> "Black Metal (bathory)"
Returns: Theme object
black_metal_burzum()
Theme preset -> "Black Metal (burzum)"
Returns: Theme object
black_metal_funeral()
Theme preset -> "Black Metal (dark Funeral)"
Returns: Theme object
black_metal_gorgoroth()
Theme preset -> "Black Metal (gorgoroth)"
Returns: Theme object
black_metal_immortal()
Theme preset -> "Black Metal (immortal)"
Returns: Theme object
black_metal_khold()
Theme preset -> "Black Metal (khold)"
Returns: Theme object
black_metal_marduk()
Theme preset -> "Black Metal (marduk)"
Returns: Theme object
black_metal_mayhem()
Theme preset -> "Black Metal (mayhem)"
Returns: Theme object
black_metal_nile()
Theme preset -> "Black Metal (nile)"
Returns: Theme object
black_metal_venom()
Theme preset -> "Black Metal (venom)"
Returns: Theme object
blue_forest()
Theme preset -> "Blue Forest"
Returns: Theme object
blueish()
Theme preset -> "Blueish"
Returns: Theme object
brewer()
Theme preset -> "Brewer"
Returns: Theme object
bright()
Theme preset -> "Bright"
Returns: Theme object
brogrammer()
Theme preset -> "Brogrammer"
Returns: Theme object
brush_trees()
Theme preset -> "Brush Trees"
Returns: Theme object
catppuccin()
Theme preset -> "Catppuccin"
Returns: Theme object
chalk()
Theme preset -> "Chalk"
Returns: Theme object
circus()
Theme preset -> "Circus"
Returns: Theme object
classic()
Theme preset -> "Classic"
Returns: Theme object
clrs()
Theme preset -> "Colors"
Returns: Theme object
codeschool()
Theme preset -> "Codeschool"
Returns: Theme object
cupcake()
Theme preset -> "Cupcake"
Returns: Theme object
cupertino()
Theme preset -> "Cupertino"
Returns: Theme object
da_one_black()
Theme preset -> "Da One Black"
Returns: Theme object
da_one_gray()
Theme preset -> "Da One Gray"
Returns: Theme object
da_one_ocean()
Theme preset -> "Da One Ocean"
Returns: Theme object
da_one_paper()
Theme preset -> "Da One Paper"
Returns: Theme object
da_one_sea()
Theme preset -> "Da One Sea"
Returns: Theme object
da_one_white()
Theme preset -> "Da One White"
Returns: Theme object
danqing()
Theme preset -> "Danqing"
Returns: Theme object
darcula()
Theme preset -> "Darcula"
Returns: Theme object
dark_violet()
Theme preset -> "Dark Violet"
Returns: Theme object
darkmoss()
Theme preset -> "Darkmoss"
Returns: Theme object
darktooth()
Theme preset -> "Darktooth"
Returns: Theme object
decaf()
Theme preset -> "Decaf"
Returns: Theme object
dirtysea()
Theme preset -> "Dirtysea"
Returns: Theme object
dracula()
Theme preset -> "Dracula"
Returns: Theme object
edge()
Theme preset -> "Edge"
Returns: Theme object
eighties()
Theme preset -> "Eighties"
Returns: Theme object
embers()
Theme preset -> "Embers"
Returns: Theme object
emil()
Theme preset -> "Emil"
Returns: Theme object
equilibrium()
Theme preset -> "Equilibrium"
Returns: Theme object
equilibrium_gray()
Theme preset -> "Equilibrium Gray"
Returns: Theme object
espresso()
Theme preset -> "Espresso"
Returns: Theme object
eva()
Theme preset -> "Eva"
Returns: Theme object
everforest()
Theme preset -> "Everforest"
Returns: Theme object
flat()
Theme preset -> "Flat"
Returns: Theme object
framer()
Theme preset -> "Framer"
Returns: Theme object
fruit_soda()
Theme preset -> "Fruit Soda"
Returns: Theme object
gigavolt()
Theme preset -> "Gigavolt"
Returns: Theme object
github()
Theme preset -> "Github"
Returns: Theme object
google()
Theme preset -> "Google"
Returns: Theme object
gotham()
Theme preset -> "Gotham"
Returns: Theme object
grayscale()
Theme preset -> "Grayscale"
Returns: Theme object
green_screen()
Theme preset -> "Green Screen"
Returns: Theme object
gruber()
Theme preset -> "Gruber"
Returns: Theme object
gruvbox_hard()
Theme preset -> "Gruvbox Dark, Hard"
Returns: Theme object
gruvbox_medium()
Theme preset -> "Gruvbox Dark, Medium"
Returns: Theme object
gruvbox_pale()
Theme preset -> "Gruvbox Dark, Pale"
Returns: Theme object
gruvbox_soft()
Theme preset -> "Gruvbox Dark, Soft"
Returns: Theme object
gruvbox_material_hard()
Theme preset -> "Gruvbox Material Dark, Hard"
Returns: Theme object
gruvbox_material_medium()
Theme preset -> "Gruvbox Material Dark, Medium"
Returns: Theme object
gruvbox_material_soft()
Theme preset -> "Gruvbox Material Dark, Soft"
Returns: Theme object
hardcore()
Theme preset -> "Hardcore"
Returns: Theme object
harmonic16()
Theme preset -> "Harmonic16"
Returns: Theme object
heetch()
Theme preset -> "Heetch"
Returns: Theme object
helios()
Theme preset -> "Helios"
Returns: Theme object
hopscotch()
Theme preset -> "Hopscotch"
Returns: Theme object
horizon()
Theme preset -> "Horizon"
Returns: Theme object
horizon_terminal()
Theme preset -> "Horizon Terminal"
Returns: Theme object
humanoid()
Theme preset -> "Humanoid"
Returns: Theme object
ia()
Theme preset -> "Ia"
Returns: Theme object
icy()
Theme preset -> "Icy"
Returns: Theme object
ir_black()
Theme preset -> "Ir Black"
Returns: Theme object
isotope()
Theme preset -> "Isotope"
Returns: Theme object
kanagawa()
Theme preset -> "Kanagawa"
Returns: Theme object
katy()
Theme preset -> "Katy"
Returns: Theme object
kimber()
Theme preset -> "Kimber"
Returns: Theme object
lime()
Theme preset -> "Lime"
Returns: Theme object
london_tube()
Theme preset -> "London Tube"
Returns: Theme object
macintosh()
Theme preset -> "Macintosh"
Returns: Theme object
marrakesh()
Theme preset -> "Marrakesh"
Returns: Theme object
materia()
Theme preset -> "Materia"
Returns: Theme object
material()
Theme preset -> "Material"
Returns: Theme object
materialdarker()
Theme preset -> "Material Darker"
Returns: Theme object
material_palenight()
Theme preset -> "Material Palenight"
Returns: Theme object
material_vivid()
Theme preset -> "Material Vivid"
Returns: Theme object
mellow_purple()
Theme preset -> "Mellow Purple"
Returns: Theme object
mocha()
Theme preset -> "Mocha"
Returns: Theme object
monokai()
Theme preset -> "Monokai"
Returns: Theme object
Nebula()
Theme preset -> "Nebula"
Returns: Theme object
nord()
Theme preset -> "Nord"
Returns: Theme object
nova()
Theme preset -> "Nova"
Returns: Theme object
ocean()
Theme preset -> "Ocean"
Returns: Theme object
oceanicnext()
Theme preset -> "Oceanicnext"
Returns: Theme object
onedark()
Theme preset -> "Onedark"
Returns: Theme object
outrun()
Theme preset -> "Outrun"
Returns: Theme object
pandora()
Theme preset -> "Pandora"
Returns: Theme object
papercolor()
Theme preset -> "Papercolor"
Returns: Theme object
paraiso()
Theme preset -> "Paraiso"
Returns: Theme object
pasque()
Theme preset -> "Pasque"
Returns: Theme object
phd()
Theme preset -> "Phd"
Returns: Theme object
pico()
Theme preset -> "Pico"
Returns: Theme object
pinky()
Theme preset -> "Pinky"
Returns: Theme object
pop()
Theme preset -> "Pop"
Returns: Theme object
porple()
Theme preset -> "Porple"
Returns: Theme object
primer()
Theme preset -> "Primer"
Returns: Theme object
purpledream()
Theme preset -> "Purpledream"
Returns: Theme object
qualia()
Theme preset -> "Qualia"
Returns: Theme object
railscasts()
Theme preset -> "Railscasts"
Returns: Theme object
rebecca()
Theme preset -> "Rebecca"
Returns: Theme object
rose_pine()
Theme preset -> "Rosé Pine"
Returns: Theme object
rose_pine_dawn()
Theme preset -> "Rosé Pine Dawn"
Returns: Theme object
rose_pine_moon()
Theme preset -> "Rosé Pine Moon"
Returns: Theme object
sagelight()
Theme preset -> "Sagelight"
Returns: Theme object
sakura()
Theme preset -> "Sakura"
Returns: Theme object
sandcastle()
Theme preset -> "Sandcastle"
Returns: Theme object
seti_ui()
Theme preset -> "Seti Ui"
Returns: Theme object
shades_of_purple()
Theme preset -> "Shades Of Purple"
Returns: Theme object
shadesmear()
Theme preset -> "Shadesmear"
Returns: Theme object
shapeshifter()
Theme preset -> "Shapeshifter"
Returns: Theme object
silk()
Theme preset -> "Silk"
Returns: Theme object
snazzy()
Theme preset -> "Snazzy"
Returns: Theme object
solar_flare()
Theme preset -> "Solar Flare"
Returns: Theme object
solarized()
Theme preset -> "Solarized"
Returns: Theme object
spaceduck()
Theme preset -> "Spaceduck"
Returns: Theme object
spacemacs()
Theme preset -> "Spacemacs"
Returns: Theme object
stella()
Theme preset -> "Stella"
Returns: Theme object
still_alive()
Theme preset -> "Still Alive"
Returns: Theme object
summercamp()
Theme preset -> "Summercamp"
Returns: Theme object
summerfruit()
Theme preset -> "Summerfruit"
Returns: Theme object
synth_midnight_terminal()
Theme preset -> "Synth Midnight Terminal"
Returns: Theme object
tango()
Theme preset -> "Tango"
Returns: Theme object
tender()
Theme preset -> "Tender"
Returns: Theme object
tokyo_city()
Theme preset -> "Tokyo City"
Returns: Theme object
tokyo_city_terminal()
Theme preset -> "Tokyo City Terminal"
Returns: Theme object
tokyo_night()
Theme preset -> "Tokyo Night"
Returns: Theme object
tokyo_night_storm()
Theme preset -> "Tokyo Night Storm"
Returns: Theme object
tokyo_night_terminal()
Theme preset -> "Tokyo Night Terminal"
Returns: Theme object
tokyo_night_terminal_storm()
Theme preset -> "Tokyo Night Terminal Storm"
Returns: Theme object
tokyodark()
Theme preset -> "Tokyodark"
Returns: Theme object
tokyodark_terminal()
Theme preset -> "Tokyodark Terminal"
Returns: Theme object
tomorrow()
Theme preset -> "Tomorrow"
Returns: Theme object
tomorrow_night()
Theme preset -> "Tomorrow Night"
Returns: Theme object
tomorrow_night_eighties()
Theme preset -> "Tomorrow Night Eighties"
Returns: Theme object
twilight()
Theme preset -> "Twilight"
Returns: Theme object
unikitty()
Theme preset -> "Unikitty"
Returns: Theme object
unikitty_reversible()
Theme preset -> "Unikitty Reversible"
Returns: Theme object
uwunicorn()
Theme preset -> "Uwunicorn"
Returns: Theme object
vice()
Theme preset -> "Vice"
Returns: Theme object
vulcan()
Theme preset -> "Vulcan"
Returns: Theme object
windows_10()
Theme preset -> "Windows 10"
Returns: Theme object
windows_95()
Theme preset -> "Windows 95"
Returns: Theme object
windows_high_contrast()
Theme preset -> "Windows High Contrast"
Returns: Theme object
windows_nt()
Theme preset -> "Windows Nt"
Returns: Theme object
woodland()
Theme preset -> "Woodland"
Returns: Theme object
xcode_dusk()
Theme preset -> "Xcode Dusk"
Returns: Theme object
theme_engineLibrary "theme_engine"
Theme Builder and Structure for live generative themes
init(_name)
New theme object.
Parameters:
_name : (string) opptional name
Returns: a VAR theme (holds it's vals when updated if not overwritten)
globals(theme, _h1, _h2, _h3, _h4, _s, _val, _contrast)
Create light/dark theme globals
Parameters:
theme : (theme) Theme to add theses to
_h1 : (float) Hue #1 for Template
_h2 : (float) Hue #2 for Template
_h3 : (float) Hue #3 for Template
_h4 : (float) Hue #4 for Template
_s : (float) Saturation of theme
_val : (float) Luminosity (light/dark)
_contrast : (float) Contrast to apply
Returns: Theme wwith adjusted colors
setConfig(theme, setting)
Apply a Settings object to a theme
Parameters:
theme : Theme object to apply settings to.
setting : settings to apply
Returns: theme
Types :
settings
Settings for a theme
Fields:
h1 : (float) Hue #1 for Template
h2 : (float) Hue #2 for Template
h3 : (float) Hue #3 for Template
h4 : (float) Hue #4 for Template
sat : (float) Saturation of theme
lum : (float) Luminosity (light/dark)
vib : (float) Vibrance (Contrast)
r : (float) Hue of Red
o : (float) Hue of Orange
y : (float) Hue of Yellow
g : (float) Hue of Green
a : (float) Hue of Aqua
b : (float) Hue of Blue
i : (float) Hue of Indigo
v : (float) Hue of Violet
satvals : (settings) Array for use if desired to customize Saturation per color
lumvals : (settings) Array for use if desired to customize Luminancce per color
mods
Modifiers Item for Use if desired
Fields:
val : (float)
size : (float)
depth : (float)
hue : (float)
sat : (float)
alpha : (float)
mix : (float)
emit : (float)
ch : (float)
step : (int)
dist : (int)
holds : (mods)
isin : (mods)
track : (color)
varient
Light/Dark/Custom Theme Varients
Fields:
bg : (color) Bacckground Color
fg : (color) Foreground Color
accent : (color) Accccent Color
secondary : (color) Secondary Color
txt : (color) Text Color
theme
Theme Object
Fields:
name : (string) Theme name
dark : (varient) Theme dark Varient
light : (varient) Theme light Varient
red : (color) Color for red
orange : (color) Color for orange
yellow : (color) Color for yellow
green : (color) Color for green
aqua : (color) Color for aqua
blue : (color) Color for blue
purple : (color) Color for purple
pink : (color) Color for pink
tweaks : (mods) Modifiers UDT to use for adjusters
themedict
Fields:
names : (string ) Names of themes
themes : (theme ) Theme Items
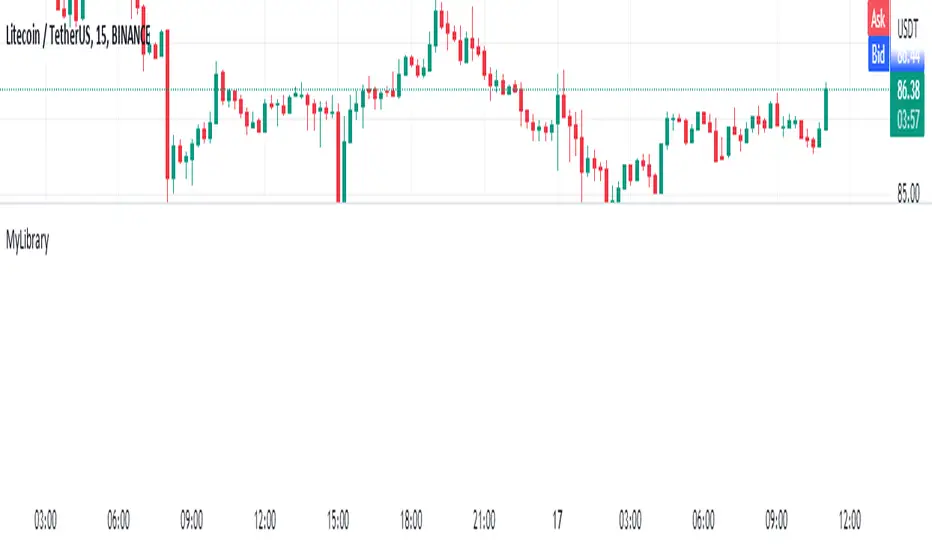
MyLibraryLibrary "MyLibrary"
TODO: add library description here
isHammer(fib, colorMatch)
TODO: add function description here
Parameters:
fib
colorMatch
Returns: TODO: add what function returns
eHarmonicpatternsLogScaleLibrary "eHarmonicpatternsLogScale"
Library provides functions to scan harmonic patterns both or normal and log scale
getSupportedPatterns()
get_prz_range(x, a, b, c, patternArray, errorPercent, start_adj, end_adj, logScale)
Provides PRZ range based on BCD and XAD ranges
Parameters:
x : X coordinate value
a : A coordinate value
b : B coordinate value
c : C coordinate value
patternArray : Pattern flags for which PRZ range needs to be calculated
errorPercent : Error threshold
start_adj : - Adjustments for entry levels
end_adj : - Adjustments for stop levels
logScale : - calculate on log scale. Default is false
Returns: Start and end of consolidated PRZ range
get_prz_range_xad(x, a, b, c, patternArray, errorPercent, start_adj, end_adj, logScale)
Provides PRZ range based on XAD range only
Parameters:
x : X coordinate value
a : A coordinate value
b : B coordinate value
c : C coordinate value
patternArray : Pattern flags for which PRZ range needs to be calculated
errorPercent : Error threshold
start_adj : - Adjustments for entry levels
end_adj : - Adjustments for stop levels
logScale : - calculate on log scale. Default is false
Returns: Start and end of consolidated PRZ range
get_projection_range(x, a, b, c, patternArray, errorPercent, start_adj, end_adj, logScale)
Provides Projection range based on BCD and XAD ranges
Parameters:
x : X coordinate value
a : A coordinate value
b : B coordinate value
c : C coordinate value
patternArray : Pattern flags for which PRZ range needs to be calculated
errorPercent : Error threshold
start_adj : - Adjustments for entry levels
end_adj : - Adjustments for stop levels
logScale : - calculate on log scale. Default is false
Returns: Array containing start and end ranges
isHarmonicPattern(x, a, b, c, d, flags, defaultEnabled, errorPercent, logScale)
Checks for harmonic patterns
Parameters:
x : X coordinate value
a : A coordinate value
b : B coordinate value
c : C coordinate value
d : D coordinate value
flags : flags to check patterns. Send empty array to enable all
defaultEnabled
errorPercent : Error threshold
logScale : - calculate on log scale. Default is false
Returns: Array of boolean values which says whether valid pattern exist and array of corresponding pattern names
isHarmonicProjection(x, a, b, c, flags, defaultEnabled, errorPercent, logScale)
Checks for harmonic pattern projection
Parameters:
x : X coordinate value
a : A coordinate value
b : B coordinate value
c : C coordinate value
flags : flags to check patterns. Send empty array to enable all
defaultEnabled
errorPercent : Error threshold
logScale : - calculate on log scale. Default is false
Returns: Array of boolean values which says whether valid pattern exist and array of corresponding pattern names.

E5TradingLibrary
This library replaces the previous MetaWorldEngineFilterLibrary3.
Library "E5TradingLibrary"
GetCandleStickSize(_src_high, _src_low)
returns size of the candle
Parameters:
_src_high
_src_low
Returns: candlestick size
GetCandleStickBodySize(_src_open, _src_close)
returns size of the candle body
Parameters:
_src_open
_src_close
Returns: candlestick body size
FilterLongerLowerWickCandles(_src_open, _src_close, _src_low)
Alters Candlestick Value to Magnify Candles with Long Wicks
Parameters:
_src_open
_src_close
_src_low
Returns: Midpoint of the candle body less the lower wick. If value returned has a large delta from midpoint of the body, then it is short wick
IsBullish(_src_open, _src_close)
Determine if Candle is Bullish or Bearish
Parameters:
_src_open
_src_close
Returns: True is Bullish
IsDoji(_candleIndex, _precision)
Determine if Candle is a Doji
Parameters:
_candleIndex
_precision
Returns: True if a Doji
MACD(_src, _fastLength, _slowLength, _signalLength)
Computes MACD
Parameters:
_src
_fastLength
_slowLength
_signalLength
Returns: Returns MACD and Signal Line
isFastSlowCrossed(SeriesA, SeriesB)
Computes if SeriesA crosses SeriesB
Parameters:
SeriesA
SeriesB
Returns: if SeriesA crosses SeriesB then true else false
isReversalUpTrend(SeriesA, SeriesB)
Computes if SeriesA crosses over SeriesB to determine reversal uptrend
Parameters:
SeriesA
SeriesB
Returns: if SeriesA crosses over SeriesB then true else false
isReversalDownTrend(SeriesA, SeriesB)
Computes if SeriesA crosses over SeriesB to determine reversal uptrend
Parameters:
SeriesA
SeriesB
Returns: if SeriesA crosses over SeriesB then true else false
SSMA(_src, smalength)
Computes smoothed SMA
Parameters:
_src
smalength
Returns: a single concatenated string for evaluation
GetTimeFrame()
Get Current timeframe in minutes
Returns: an integer value in minutes
getMA(_src, length, maType)
Gets a Moving Average based on type
Parameters:
_src
length
maType
Returns: A moving average with the given parameters
ATRSwitch(_src, _ATRMult, _ATRLength)
Average True Range Trailing Stops by Sylvain Vervoort
Parameters:
_src
_ATRMult
_ATRLength
Returns: upper ATR Line, lower ATR Line and the switch point

FibRatiosLibrary "FibRatios"
Library with calculation logic for fib retracement, extension and ratios
retracement(a, b, ratio, logScale, precision)
Calculates the retracement for points a, b with given ratio and scale
Parameters:
a : Starting point a
b : Second point b
ratio : Ratio for which we need to calculate retracement c
logScale : Flag to get calculations in log scale. Default is false
precision : rounding precision. If set to netagive number, round_to_mintick is applied. Default is -1
Returns: retracement point c for points a,b with given ratio and scale
retracementRatio(a, b, c, logScale, precision)
Calculates the retracement ratio for points a, b, c with given scale
Parameters:
a : Starting point a
b : Second point b
c : Retracement point. c should be placed between a and b
logScale : Flag to get calculations in log scale. Default is false
precision : rounding precision. If set to netagive number, round_to_mintick is applied. Default is 3
Returns: retracement ratio for points a,b,c on given scale
extension(a, b, c, ratio, logScale, precision)
Calculates the extensions for points a, b, c with given ratio and scale
Parameters:
a : Starting point a
b : Second point b
c : Retracement point. c should be placed between a and b
ratio : Ratio for which we need to calculate extension d
logScale : Flag to get calculations in log scale. Default is false
precision : rounding precision. If set to netagive number, round_to_mintick is applied. Default is -1
Returns: extensoin point d for points a,b,c with given ratio and scale
extensionRatio(a, b, c, d, logScale, precision)
Calculates the extension ratio for points a, b, c, d with given scale
Parameters:
a : Starting point a
b : Second point b
c : Retracement point. c should be placed between a and b
d : Extension point. d should be placed beyond a, c. But, can be with b,c or beyond b
logScale : Flag to get calculations in log scale. Default is false
precision : rounding precision. If set to netagive number, round_to_mintick is applied. Default is 3
Returns: extension ratio for points a,b,c,d on given scale

DataCorrelationLibrary "DataCorrelation"
Implementation of functions related to data correlation calculations. Formulas have been transformed in such a way that we avoid running loops and instead make use of time series to gradually build the data we need to perform calculation. This allows the calculations to run on unbound series, and/or higher number of samples
🎲 Simplifying Covariance
Original Formula
//For Sample
Covₓᵧ = ∑ ((xᵢ-x̄)(yᵢ-ȳ)) / (n-1)
//For Population
Covₓᵧ = ∑ ((xᵢ-x̄)(yᵢ-ȳ)) / n
Now, if we look at numerator, this can be simplified as follows
∑ ((xᵢ-x̄)(yᵢ-ȳ))
=> (x₁-x̄)(y₁-ȳ) + (x₂-x̄)(y₂-ȳ) + (x₃-x̄)(y₃-ȳ) ... + (xₙ-x̄)(yₙ-ȳ)
=> (x₁y₁ + x̄ȳ - x₁ȳ - y₁x̄) + (x₂y₂ + x̄ȳ - x₂ȳ - y₂x̄) + (x₃y₃ + x̄ȳ - x₃ȳ - y₃x̄) ... + (xₙyₙ + x̄ȳ - xₙȳ - yₙx̄)
=> (x₁y₁ + x₂y₂ + x₃y₃ ... + xₙyₙ) + (x̄ȳ + x̄ȳ + x̄ȳ ... + x̄ȳ) - (x₁ȳ + x₂ȳ + x₃ȳ ... xₙȳ) - (y₁x̄ + y₂x̄ + y₃x̄ + yₙx̄)
=> ∑xᵢyᵢ + n(x̄ȳ) - ȳ∑xᵢ - x̄∑yᵢ
So, overall formula can be simplified to be used in pine as
//For Sample
Covₓᵧ = (∑xᵢyᵢ + n(x̄ȳ) - ȳ∑xᵢ - x̄∑yᵢ) / (n-1)
//For Population
Covₓᵧ = (∑xᵢyᵢ + n(x̄ȳ) - ȳ∑xᵢ - x̄∑yᵢ) / n
🎲 Simplifying Standard Deviation
Original Formula
//For Sample
σ = √(∑(xᵢ-x̄)² / (n-1))
//For Population
σ = √(∑(xᵢ-x̄)² / n)
Now, if we look at numerator within square root
∑(xᵢ-x̄)²
=> (x₁² + x̄² - 2x₁x̄) + (x₂² + x̄² - 2x₂x̄) + (x₃² + x̄² - 2x₃x̄) ... + (xₙ² + x̄² - 2xₙx̄)
=> (x₁² + x₂² + x₃² ... + xₙ²) + (x̄² + x̄² + x̄² ... + x̄²) - (2x₁x̄ + 2x₂x̄ + 2x₃x̄ ... + 2xₙx̄)
=> ∑xᵢ² + nx̄² - 2x̄∑xᵢ
=> ∑xᵢ² + x̄(nx̄ - 2∑xᵢ)
So, overall formula can be simplified to be used in pine as
//For Sample
σ = √(∑xᵢ² + x̄(nx̄ - 2∑xᵢ) / (n-1))
//For Population
σ = √(∑xᵢ² + x̄(nx̄ - 2∑xᵢ) / n)
🎲 Using BinaryInsertionSort library
Chatterjee Correlation and Spearman Correlation functions make use of BinaryInsertionSort library to speed up sorting. The library in turn implements mechanism to insert values into sorted order so that load on sorting is reduced by higher extent allowing the functions to work on higher sample size.
🎲 Function Documentation
chatterjeeCorrelation(x, y, sampleSize, plotSize)
Calculates chatterjee correlation between two series. Formula is - ξnₓᵧ = 1 - (3 * ∑ |rᵢ₊₁ - rᵢ|)/ (n²-1)
Parameters:
x : First series for which correlation need to be calculated
y : Second series for which correlation need to be calculated
sampleSize : number of samples to be considered for calculattion of correlation. Default is 20000
plotSize : How many historical values need to be plotted on chart.
Returns: float correlation - Chatterjee correlation value if falls within plotSize, else returns na
spearmanCorrelation(x, y, sampleSize, plotSize)
Calculates spearman correlation between two series. Formula is - ρ = 1 - (6∑dᵢ²/n(n²-1))
Parameters:
x : First series for which correlation need to be calculated
y : Second series for which correlation need to be calculated
sampleSize : number of samples to be considered for calculattion of correlation. Default is 20000
plotSize : How many historical values need to be plotted on chart.
Returns: float correlation - Spearman correlation value if falls within plotSize, else returns na
covariance(x, y, include, biased)
Calculates covariance between two series of unbound length. Formula is Covₓᵧ = ∑ ((xᵢ-x̄)(yᵢ-ȳ)) / (n-1) for sample and Covₓᵧ = ∑ ((xᵢ-x̄)(yᵢ-ȳ)) / n for population
Parameters:
x : First series for which covariance need to be calculated
y : Second series for which covariance need to be calculated
include : boolean flag used for selectively including sample
biased : boolean flag representing population covariance instead of sample covariance
Returns: float covariance - covariance of selective samples of two series x, y
stddev(x, include, biased)
Calculates Standard Deviation of a series. Formula is σ = √( ∑(xᵢ-x̄)² / n ) for sample and σ = √( ∑(xᵢ-x̄)² / (n-1) ) for population
Parameters:
x : Series for which Standard Deviation need to be calculated
include : boolean flag used for selectively including sample
biased : boolean flag representing population covariance instead of sample covariance
Returns: float stddev - standard deviation of selective samples of series x
correlation(x, y, include)
Calculates pearson correlation between two series of unbound length. Formula is r = Covₓᵧ / σₓσᵧ
Parameters:
x : First series for which correlation need to be calculated
y : Second series for which correlation need to be calculated
include : boolean flag used for selectively including sample
Returns: float correlation - correlation between selective samples of two series x, y

HiveLibraryLibrary "HiveLibrary"
: Custom library
RoundDown(number, decimals)
RoundDown() rounds the specified number down to the given number
of decimal places.
Parameters:
number : is the argument for rounding down & decimals is the number of digits after dot
decimals
Returns: return is the rounded down value of the number

JeeSauceScriptsLibrary "JeeSauceScripts"
getupdnvol()
GetTotalUpVolume(upvolume)
Parameters:
upvolume
GetTotalDnVolume(downvolume)
Parameters:
downvolume
GetDelta(totalupvolume, totaldownvolume)
Parameters:
totalupvolume
totaldownvolume
GetMaxUpVolume(upvolume)
Parameters:
upvolume
GetMaxDnVolume(downvolume)
Parameters:
downvolume
Getcvd()
Getcvdopen(cvd)
Parameters:
cvd
Getcvdhigh(cvd, maxvolumeup)
Parameters:
cvd
maxvolumeup
Getcvdlow(cvd, maxvolumedown)
Parameters:
cvd
maxvolumedown
Getcvdclose(cvd, delta)
Parameters:
cvd
delta
CombineData(data1, data2, data3, data4, data5, data6)
Parameters:
data1
data2
data3
data4
data5
data6
FindData(data, find)
Parameters:
data
find

MyLibraryLibrary "MyLibrary"
TODO: add library description here
init(value)
Parameters:
value
set(source, value)
Parameters:
source
value
get(source)
Parameters:
source
Motion▮ FEATURES
Now as library version :)
String-based transition-effects
Performance optimization. Reduced memory consumption up to >90% by kicking the output to the "stdout".
Use marquee- or loader-effect on any possible string location.
Example: UI Price-Ticker
----------------------------------------------------------------------------
Library "Motion"
_getStringMono(_len, _str, _sep)
Parameters:
_len
_str
_sep
marquee(this, _extern, _ws, _subLen, _subStart)
Parameters:
this
_extern
_ws
_subLen
_subStart
transition(this, _subLen, _subStart)
Parameters:
this
_subLen
_subStart
hold(this)
Parameters:
this
keyframe
keyframe A keyframe object.
Fields:
seq
intv
step
length
update_no
frame_no
ltr
hold

Replica of TradingView's Backtesting Engine with ArraysHello everyone,
Here is a perfectly replicated TradingView backtesting engine condensed into a single library function calculated with arrays. It includes TradingView's calculations for Net profit, Total Trades, Percent of Trades Profitable, Profit Factor, Max Drawdown (absolute and percent), and Average Trade (absolute and percent). Here's how TradingView defines each aspect of its backtesting system:
Net Profit: The overall profit or loss achieved.
Total Trades: The total number of closed trades, winning and losing.
Percent Profitable: The percentage of winning trades, the number of winning trades divided by the total number of closed trades.
Profit Factor: The amount of money the strategy made for every unit of money it lost, gross profits divided by gross losses.
Max Drawdown: The greatest loss drawdown, i.e., the greatest possible loss the strategy had compared to its highest profits.
Average Trade: The sum of money gained or lost by the average trade, Net Profit divided by the overall number of closed trades.
Here's how each variable is defined in the library function:
_backtest(bool _enter, bool _exit, float _startQty, float _tradeQty)
bool _enter: When the strategy should enter a trade (entry condition)
bool _exit: When the strategy should exit a trade (exit condition)
float _startQty: The starting capital in the account (for BTCUSD, it is the amount of USD the account starts with)
float _tradeQty: The amount of capital traded (if set to 1000 on BTCUSD, it will trade 1000 USD on each trade)
Currently, this library only works with long strategies, and I've included a commented out section under DEMO STRATEGY where you can replicate my results with TradingView's backtesting engine. There's tons I could do with this beyond what is shown, but this was a project I worked on back in June of 2022 before getting burned out. Feel free to comment with any suggestions or bugs, and I'll try to add or fix them all soon. Here's my list of thing to add to the library currently (may not all be added):
Add commission calculations.
Add support for shorting
Add a graph that resembles TradingView's overview graph.
Clean and optimize code.
Clean up in a way that makes it easy to add other TradingView calculations (such as Sharpe and Sortino ratio).
Separate all variables, so they become accessible outside of calculations (such as gross profit, gross loss, number of winning trades, number of losing trades, etc.).
Thanks for reading,
OztheWoz

Library_SmoothersLibrary "Library_Smoothers"
CorrectedMA(Src, Len)
CorrectedMA The strengths of the corrected Average (CA) is that the current value of the time series must exceed a the current volatility-dependent threshold, so that the filter increases or falls, avoiding false signals when the trend is in a weak phase.
Parameters:
Src
Len
Returns: The Corrected source.
EHMA(src, len)
EMA Exponential Moving Average.
Parameters:
src : Source to act upon
len
Returns: EMA of source
FRAMA(src, len, FC, SC)
FRAMA Fractal Adaptive Moving Average
Parameters:
src : Source to act upon
len : Length of moving average
FC : Fast moving average
SC : Slow moving average
Returns: FRAMA of source
Jurik(src, length, phase, power)
Jurik A low lag filter
Parameters:
src : Source
length : Length for smoothing
phase : Phase range is ±100
power : Mathematical power to use. Doesn't need to be whole numbers
Returns: Jurik of source
SMMA(src, len)
SMMA Smoothed moving average. Think of the SMMA as a hybrid of its better-known siblings — the simple moving average (SMA) and the exponential moving average (EMA).
Parameters:
src : Source
len
Returns: SMMA of source
SuperSmoother(src, len)
SuperSmoother
Parameters:
src : Source to smooth
len
Returns: SuperSmoother of the source
TMA(src, len)
TMA Triangular Moving Average
Parameters:
src : Source
len
Returns: TMA of source
TSF(src, len)
TSF Time Series Forecast. Uses linear regression.
Parameters:
src : Source
len
Returns: TSF of source
VIDYA(src, len)
VIDYA Chande's Variable Index Dynamic Average. See www.fxcorporate.com
Parameters:
src : Source
len
Returns: VIDYA of source
VAWMA(src, len, startingWeight, volumeDefault)
VAWMA = VWMA and WMA combined. Simply put, this attempts to determine the average price per share over time weighted heavier for recent values. Uses a triangular algorithm to taper off values in the past (same as WMA does).
Parameters:
src : Source
len : Length
startingWeight
volumeDefault : The default value to use when a chart has no volume.
Returns: The VAWMA of the source.
WWMA(src, len)
WWMA Welles Wilder Moving Average
Parameters:
src : Source
len
Returns: The WWMA of the source
ZLEMA(src, len)
ZLEMA Zero Lag Expotential Moving Average
Parameters:
src : Source
len
Returns: The ZLEMA of the source
SmootherType(mode, src, len, fastMA, slowMA, offset, phase, power, startingWeight, volumeDefault, Corrected)
Performs the specified moving average
Parameters:
mode : Name of moving average
src : the source to apply the MA type
len
fastMA : FRAMA fast moving average
slowMA : FRAMA slow moving average
offset : Linear regression offset
phase : Jurik phase
power : Jurik power
startingWeight : VAWMA starting weight
volumeDefault : VAWMA default volume
Corrected
Returns: The MA smoothed source

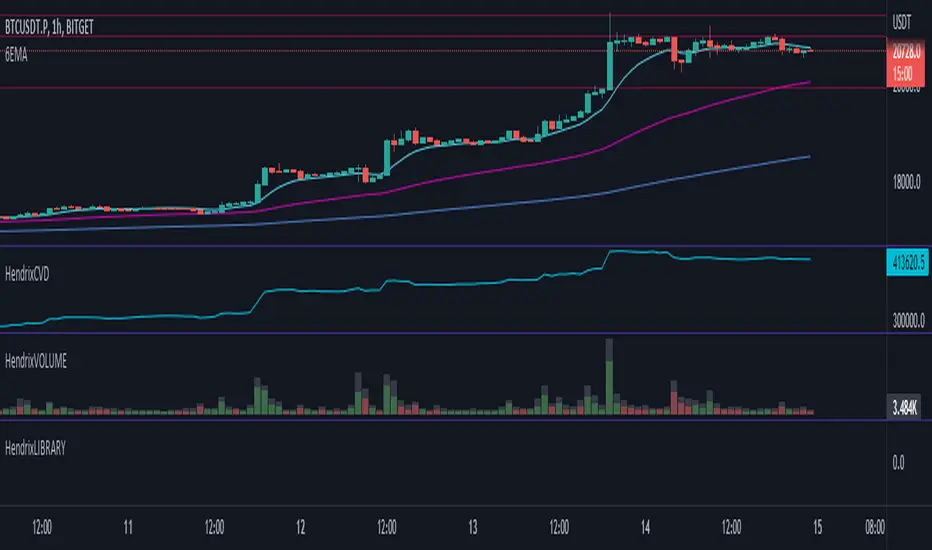
HendrixLIBRARY - utilsLibrary "HendrixLIBRARY"
getVolumeData()
getLTF(customTimeframe, ltf)
Parameters:
customTimeframe
ltf
sumArray(a)
Parameters:
a
arrs2vals(upVolumeArray, downVolumeArray, volArr)
Parameters:
upVolumeArray
downVolumeArray
volArr
getVolumesFromUpDownArrays(upVolumeArray, downVolumeArray)
Parameters:
upVolumeArray
downVolumeArray
getDeltaFromVolumes(upVolume, downVolume)
Parameters:
upVolume
downVolume
getDeltaFromUpDownArrays(upVolumeArray, downVolumeArray)
Parameters:
upVolumeArray
downVolumeArray
getUpColor()
getDownColor()
getBlackColor()
getColors()
printTableTR(txt)
Parameters:
txt
printTableBR(txt)
Parameters:
txt
printTableMR(txt)
Parameters:
txt
print(txt, lbl)
Parameters:
txt
lbl
printSyminfo(sym)
Parameters:
sym
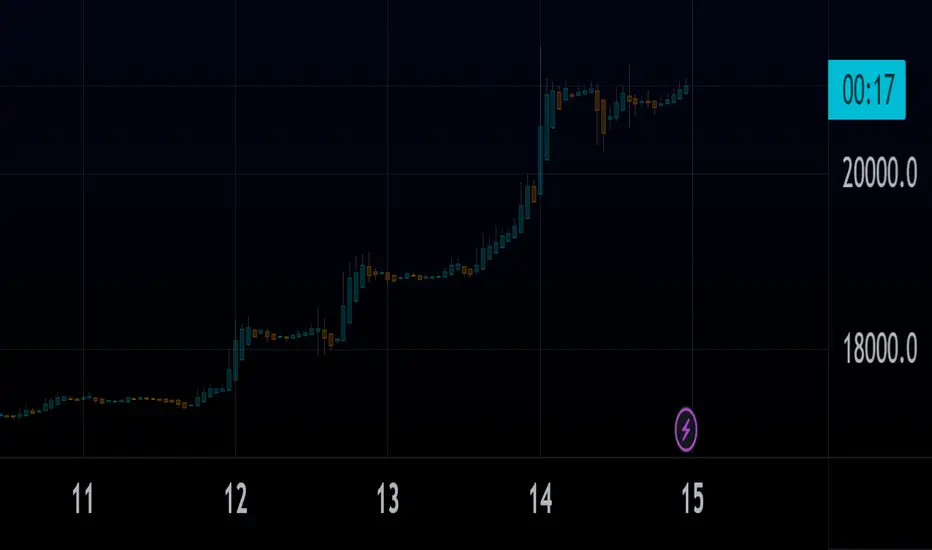
Profit EstimateLibrary "profitestimate"
Simple profit Estimatr. Engages when Position != 0
and holds until posittion is na/0...
if position changes sizes, it will update automatically and adjust.
it has an input for comission to estmate exit fees
update_avgprice(_sizewas, _delta, _pricewas, _newprice)
Get a new Average position Price
Parameters:
_sizewas : (float) the position prior
_delta : (float) the order amount
_pricewas : (float) the prior price
_newprice : (float) the price of order
Returns: New Avg Price
amount(_position, _close, _commission, _leverage, _fullqty)
Position Net Profit Net Commission, automatic on/off if position != 0
Parameters:
_position : (float) position size (total or margin size)
_close
_commission : (float) % where (0.1 = 0.1%)
_leverage : (float) optional if leveraged, default 1x
_fullqty : (bool) if position entered is tottal trade size default is margin qty (1/lev)
Returns: quote value of profit
percent(_position, _close, _commission, _leverage, _fullqty)
Position Net Profit, automatic on/off if position != 0
Parameters:
_position : (float) position size (total or margin size)
_close
_commission : (float) % where (0.1 = 0.1%)
_leverage : (float) optional if leveraged, default 1x
_fullqty : (bool) if position entered is tottal trade size, default is margin qty (1/lev)
Returns: percentage profit (1% = 1)
HeikinashiLibrary "Heikinashi"
This library calculates "Heikinashi".
calc(_o, _h, _l, _c, _my_close)
This function calculates "Heikinashi".
Parameters:
_o : open
_h : high
_l : low
_c : close
_my_close : Specify if you want to force only the closing price to a real value.
Returns: TODO: add what function returns

String Extra FunctionsLibrary "string_extras"
Additional String shortcuts, unshift and pop return the string ~without~ the first or last, so in use will still require to extract first or last character prior to overwriting a string with the output.
can be imported "as str" to work side by side with regular pine
last(_string)
last char of a string
Parameters:
_string
Returns: last char of a string
shift(_string)
string without first char
Parameters:
_string
Returns: string without first char
pop(_string)
string without last char
Parameters:
_string
Returns: string without last char
get(_string, _position)
get specific char of a string
Parameters:
_string
_position
Returns: string _string
push(_string, _char)
push to end of a string
Parameters:
_string
_char
Returns: string _string
unshift(_string, _char)
unshift char to prepend string
Parameters:
_string
_char
Returns: string _string

HSupertrendLibrary "HSupertrend"
Supertrend implementation based on harmonic patterns
hsupertrend(zProperties, pProperties, errorPercent, showPatterns, patternColor)
derives supertrend based on harmonic patterns
Parameters:
zProperties : ZigzagProperties containing Zigzag length and source array
pProperties : PatternProperties used for calculation
errorPercent : Error threshold for scanning patterns
showPatterns : Draw identified patterns structure on chart
patternColor : Color of the pattern lines to be drawn
Returns:
ZigzagProperties
ZigzagProperties contains values required for zigzag calculation
Fields:
length : Zigzag length
source : Array containing custom OHLC. If not set, array.from(high, low) is used
PatternProperties
PatternProperties are essential pattern parameters used for calculation of bullish and bearish zones
Fields:
base : Base for calculating entry and stop of pattern. Can be CD, minmax or correction. Default is CD
entryPercent : Distance from D in terms of percent of Base in the direction of pattern
stopPercent : Distance from D in terms of percent of Base in the opposite direction of pattern
useClosePrices : When set uses close price for calculation of supertrend breakout

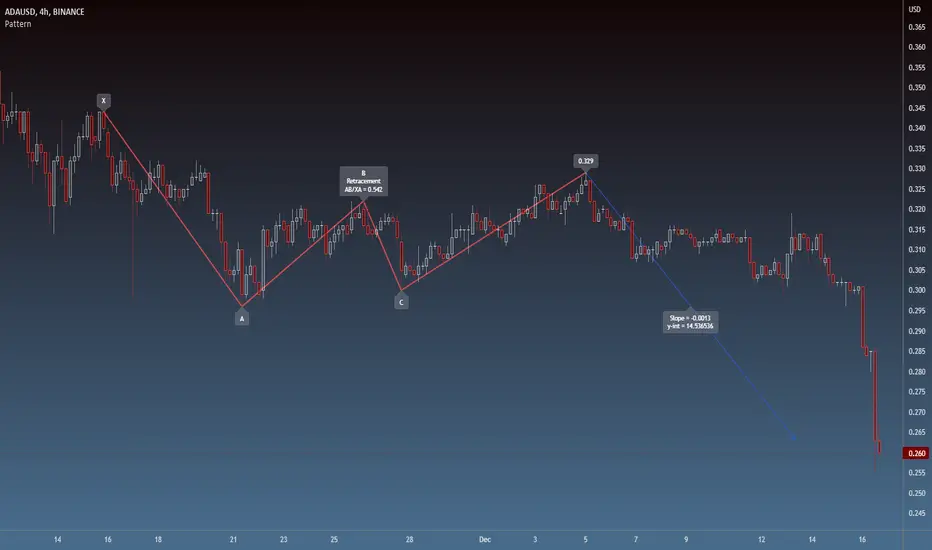
PatternLibrary "Pattern"
Pattern object definitions and functions. Easily draw and keep track of patterns, legs, and points.
Supported pattern types (as of Version 1):
Type Leg validation # legs
"xabcd" Direction 3 or 4 (point D not required)
"zigzag" Direction >= 2
"free" None >= 2
erase_label(this)
Delete the point label
Parameters:
this : Point
Returns: Void
draw_label(this, position, clr, transp, txt_clr, txt, tooltip, size)
Draw the point label
Parameters:
this : Point
position
clr
transp
txt_clr
txt
tooltip
size
Returns: line
leg_init(a, b, prev, next, line)
Initialize a pattern leg
Parameters:
a : Point A (required)
b : Point B (required)
prev : Previous leg
next : Next leg
line : Line
Returns: New instance of leg object
erase(this)
Delete the pattern leg
Parameters:
this : Leg
Returns: Void
erase(this)
Parameters:
this
draw(this, clr, style, transp, width)
Draw the pattern leg
Parameters:
this : Leg
clr : Color
style : Style ("solid", "dotted", "dashed", "arrowleft", "arrowright")
transp : Transparency
width : Width
Returns: line
draw(this, clr, style, transp, width)
Parameters:
this
clr
style
transp
width
leg_getLineTerms(this)
Get the slope and y-intercept of a leg
Parameters:
this : Leg
Returns:
leg_getPrice(this, index)
Get the price (Y) at a given bar index (X) within the leg
Parameters:
this : Leg
index : Bar index
Returns: Price (float)
pattern_init(legs, tp, name, subType, pid)
Initialize a pattern object from a given set of legs
Parameters:
legs : Array of pattern legs (required)
tp : Pattern type ("zigzag", "xabcd", or "free". dft = "free")
name : Pattern name
subType : Pattern subtype
pid : Pattern Identifier string
Returns: New instance of pattern object, if one was successfully created
pattern_init(points, tp, name, subType, pid)
Initialize a pattern object from a given set of points
Parameters:
points
tp : Pattern type ("zigzag", "xabcd", or "free". dft = "free")
name : Pattern name
subType : Pattern subtype
pid : Pattern Identifier string
Returns: New instance of pattern object, if one was successfully created
point
A point on the chart (x,y)
Fields:
x : Bar index (x coordinate)
y
label
leg
A pattern leg (point A to point B)
Fields:
a : Point A
b
deltaX
deltaY
prev
next
retrace
line
pattern
A pattern (set of at least 2 connected legs)
Fields:
legs
type
subType
name
pid
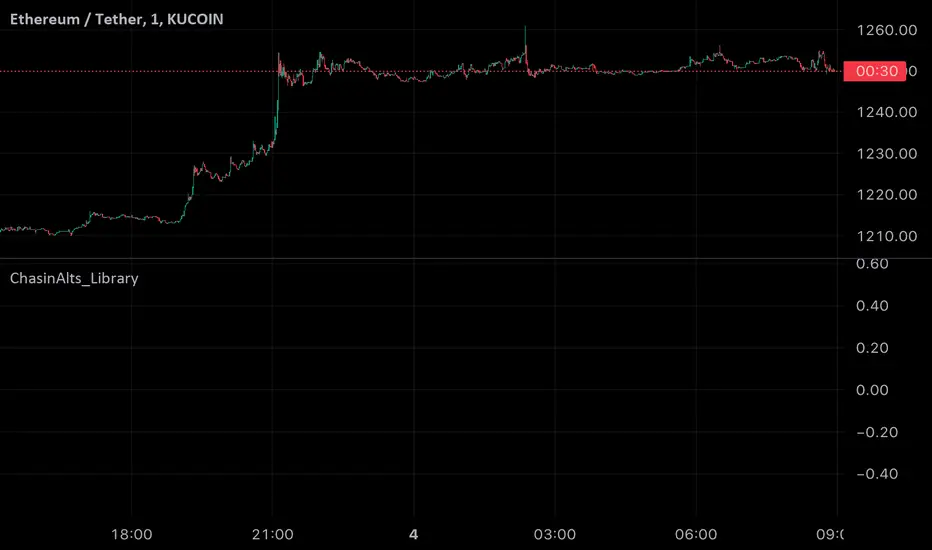
ChasinAlts_LibraryLibrary "ChasinAlts_Library"
rci(_BCgtg, _Tgtg, _close, _smaLen, _bar_index)
Parameters:
_BCgtg
_Tgtg
_close
_smaLen
_bar_index
printedBC(_time, _minPerc, _Tgtg, _lkbk)
Parameters:
_time
_minPerc
_Tgtg
_lkbk
form123(_ppLen, _BCgtg, _Tgtg, _high, _low, _close, _bar_index)
Parameters:
_ppLen
_BCgtg
_Tgtg
_high
_low
_close
_bar_index
obosCnt(_BCgtg, _Tgtg, _rci, _obosMin, _obosMax, _thresh)
Parameters:
_BCgtg
_Tgtg
_rci
_obosMin
_obosMax
_thresh
div(_thresh, _HLestLen, _Tgtg, _BCgtg, _rci, _time, _price, _LSL, _SSL, _LTP, _STP, _colorid, _long, _short)
Parameters:
_thresh
_HLestLen
_Tgtg
_BCgtg
_rci
_time
_price
_LSL
_SSL
_LTP
_STP
_colorid
_long
_short
tradeSim(_SL, _TP, _BCgtg, _Tgtg, _ppLen, _high, _low, _close, _bar_index, _time, _bull_rev, _bear_rev, _bull_obosCnt_gtg, _bear_obosCnt_gtg)
Parameters:
_SL
_TP
_BCgtg
_Tgtg
_ppLen
_high
_low
_close
_bar_index
_time
_bull_rev
_bear_rev
_bull_obosCnt_gtg
_bear_obosCnt_gtg
TrailingStopsLibrary "TrailingStops"
This library contains functions to output trailing stop lines.
f_marketStructureStop(_restartMode, _flipMode, _restartLowIn, _restartHighIn)
Parameters:
_restartMode - Defines how the stop lines persist. Allowed values are:
"Always On" - The stop lines are always present and they just reset when they're crossed.
"Flip" - The stop lines flip when they're crossed.
"Manual" - The stop lines turn off when they're crossed, and turn back on again when _restartLowIn or _restartHighIn are passed into the function as true.
_flipMode - Defines whether the stop lines are broken by wicks or closes. Allowed values are "Wick", and "Close".
_restartLowIn - If _restartMode is "Manual", passing this parameter as true restarts the Low stop line.
_restartHighIn - If _restartMode is "Manual", passing this parameter as true restarts the High stop line.
@returns - floats for the Low and High stop line.

SignalBuilderSignalBuilder
Utility for building a collection of signal values. Provides a default view for displaying signals.
Simplified API for aggregating signal values.
Flexible for use with indicators and strategies.
See the demo section for an example.
