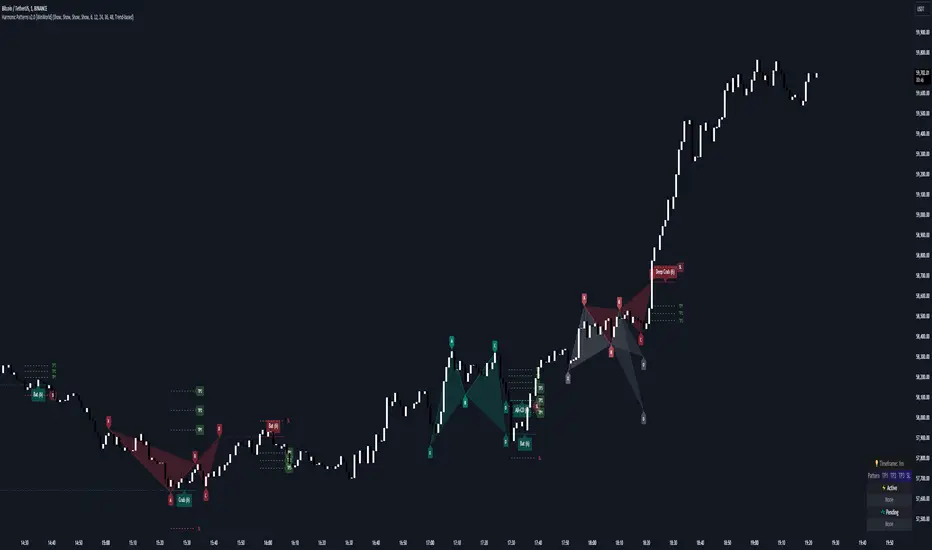
Harmonic Patterns [WinWorld]PREFACE
This indicator was made with the help of our team's fellow friend and harmonic patterns expert, whose support we deeply appreciate — @Muneer_Gove
DESCRIPTION
Harmonic patterns are one the most recognizable and popular trading concepts in the word of trading.
They are distinct formations, found in the financial markets, that predict potential price movements based on Fibonacci ratios. These patterns, which include the Gartley, Bat, Alt Bat, Butterfly and etc., identify specific and repetitive price structures that can forecast future price reversals. By incorporating these patterns into trading process, one does gain an opportunity to profit from repetetitve price movements.
The whole thing about harmonic pattern is the process of finding them. The basic step-by-step guide to build a harmonic pattern is this:
Locate significant highs and lows on the chart, which form the basis of the pattern. The best tools to use for this purple is zigzag, because zigzag indicator draw lines, which will be helpful quite helpful in the process and will save you a lot of time;
Use Fibonacci tools to measure the retracement and extension levels between legs of pattern — distances between pair of points . Each harmonic pattern has specific Fibonacci ratios that define its structure;
Draw lines connecting the pivot points according to the pattern's structure. For example, a Gartley pattern connects five points (X, A, B, C, D) in a specific sequence and ratio;
Ensure that the identified structure adheres to the harmonic pattern’s Fibonacci requirements. If the points align within the acceptable ranges, the pattern is valid.
In order to better understand this process let's see an example of the pattern from our indicator right away:
This is a Butterfly pattern. Its set of retracememt ratios is as follows:
AB/XA = 0.756 to 0.816
BC/AB = 0.382 to 0.990
CD/BC = 1.618 to 2.618
AD/XA = 1.27
Below you can see that each ratio of the pattern is successfully met:
* Note : white lines — ratio range, yellow line — point 's price level in between ranges.
AB/XA Ratio
BC/AB Ratio
CD/BC Ratio
AD/XA Ratio
SETTINGS
Main Settings
Failed Patterns — shows/hides patterns, which meet one of these conditions:
— Price crossed level of point C before reaching PRZ;
— New pattern appeared and PRZ of previous pattern was not reached;
Completed Patterns — shosw/hides patterns, whose PRZ was reached;
Dashboard — shows/hides dashboard, which displays active patterns (patterns, which can be used to trade).
Alert Settings
PRZ — enables/disables alert of event, when price reaches PRZ.
ZigZag Settings
Depth #1-9 — shows/hides patterns of the chosen zigzag copy. Here you can choose customize depth number.
Pattern Visual Controls
Bullish Patterns — shows/hides bullish patterns;
Bearish Patterns — shows/hides bearish patterns;
Pending Patterns — shows/hides patterns, whose PRZ has not been reached yet;
list of pattern names — hides/shows chosen pattern.
Colours
Bullish — colour of bullish patterns;
Bearish — colour of bearish patterns.
IMPORTANT CONCEPTS
PRZ — entry target level.
If its text near the line level is purple, it means that PRZ has NOT been reached yet.
If it is white, it means that PRZ has been reached.
In order for SL or TP to be counted when price reaches, price has to reach PRZ first with its high/low.
SL — stop-loss.
If its near the line level is red, it means that SL has NOT been reached yet.
If it is white, it means that SL has been reached.
If it is gray, it means that SL has been invalidated — price crossed with high/low the level of point C before reaching PRZ.
If SL is reached and price reaches TP targets, they will be counted.
SL of each pattern are built by individual ratio. For example, in Butterfly pattern SL ratio is 1.414 and it is calculated as (SL - A)/XA.
IMPORTANT NOTE : SL is reached when price crosses SL level with candle's close (!)
TP — take-profit.
If its near the line level is green, it means that TP has NOT been reached yet.
If it is white, it means that TP has been reached.
If one of the TP targets is reached and price reached SL, it will not be counted.
IMPORTANT NOTE : TP is reached when price crosses TP level with candle's high/low(!)
TP of each pattern are built by same the ratios for all patterns, but it is calculated by individual algorithm. For example, in the same Butterfly pattern TP ratio will be 0.382, 0.500 and 0.618 and they will be placed as Fibonacci retracement grid from point A to point D ( same for formula for all other patterns, excluding the ones listed next ), BUT on Shark , Muner and AB=CD pattern the same TP will be placed as Fibonacci retracement grid from point C to point D
WHY USE THIS INDICATOR?
Our Harmic Patterns indicator uses zigzag, which is based on depth mechanic. In order to identify the maximum possible amount of patterns this indicator runs 9 copies of the same zigzags with different depth values. Each copy of zigzag can be turned off in the settings individually.
At the moment of publishing, this indicator can autmatically identify 10 patterns:
Crab
Deep Crab
Gartley
Deep Gartley
Bat
Alt Bat
Muner
Butterfly
Shark
AB=CD
Things, that make this indicator different from other harmonic pattern indicator, are:
Advanced pattern recognition and validation process. We have implemeted special logic, which allows the indicator to draw fully accurate patterns, which satisfy industry standards.
For example, let's say we have a bearish pattern. We take points X an A. If there is a price's high, that is above X point's high, such pattern should be automatically invalidated. We have found even one indicator that does perform such validation process, and our indicator does that. . And this is just one example, we have much of such mechanics implemeted thanks to Mr. Muner's knowledge.
Advanced pattern extension mechanics . Right this mechanic applies to only one pattern — Shark. Its classic CD/BC ratio is 0.886, but when price moves in a way so this ratio now equals to 1.13, this signal the indicator to redraw the pattern, based on this new CD/BC ratio. We haven't found any indicator on the market that has such mechanic implemented.
Dashboard for displaying active patterns . On this dashboard you can find patterns, whose SL and TP have not been touched yet. If price touches the SL or TP of the pattern, this pattern is removed from the dashboard, because it is considered finished.
At the moment of publishing this dashboard only shows the patterns from the current timeframe.
Informative alert when price reaches PRZ of the pattern . Many other indicator do not provide details of this event, which requires trader to waste his time on opening up the chart and searching for this event. Our indicator allows trader to see the PRZ price right when alert happens and open up the trade much fastr.
Alert message is made by this template:
, : PRZ was reached at on
Example:
BTCUSDT, long Bat: PRZ was reached at 70,000 on 15m.
ALERTS
At the moment of publishing this indicator offers one alert, which happens when price reaches PRZ level.
HOW CAN I GET THE MOST OUT OF THIS INDICATOR?
This indicator can act as the standalone tool, because PRZ, TP and SL are assigned to each pattern and tracked during the pattern's life period.
You can this indicator with any other strategy or indicator, because this indicator is basically a tool that shows the trader repetitive price formations, after which price tends to go a certaion direction in the most cases, allowing trader to profit from it.
You can try combining Harmonic Patterns indicator with Smart Money tools, made by our team, because Smart Money strategies basically show the most liquid price zones and levels, which can be used to find an entry opportunity and Harmonic Patterns indicator can be added to make a final decision on the entry.
If you are interested in trying these two strategies together, feel free to learn Smart Money trading strategy by reading our Advanced SMC guide, which is available in our eductional materials.
SUMMARY
Harmonic Patterns indicator is an advanced tool of technical analysis, which automatically finds 10 most used harmonic patterns on the chart, assign PRZ, TP and SL targets to them and tracks them during each pattern 'life period'.
While searching for these patterns, this indicator performs series of validation techniques, that allow trader to see only the most valid patterns, which have a higher changes to succeed.
This indicator can be used both as a standalone tool and as 'team player' for any stategy by being the tool, which can be used for making a final decision on an entry target.
AFTERWORD
This indicator has been developed for more than 2 weeks, which consisted of everyday discussions, bug fixes and special additons to the algorithm in order to making patterns more valid, so we really hope you will find a great use of this indicator and it will help you recude time on the analysis and boost your profits :)
We want to express our gratitude to @Muneer_Gove once again, because he has done huge job helping us fine-tuning the algorithm, building complex pattern validatiom and extension logic and fixing bugs. Thank you!
Best of luck , traders!
— with love, WinWorld Team
Patterns
Reversal Candlestick Structure [LuxAlgo]The Reversal Candlestick Structure indicator detects multiple candlestick patterns occurring when trends are most likely to experience a reversal in real-time. The reversal detection method includes various settings allowing users to adjust the reversal detection algorithm more precisely.
A dashboard showing the percentage of patterns detected as reversals is also included.
🔶 USAGE
Candlestick patterns are ubiquitous to technical analysts, allowing them to detect trend continuations, reversals, and indecision.
The proposed tool effectively detects reversals by using the confluence between candlestick patterns and a reversal detection method based on the stochastic oscillator, acting as a filter for the patterns. If a candlestick pattern occurs while conditions suggest a potential reversal then the pattern is highlighted.
The displayed candle coloring allows users to observe the reversal detection method, with colored candles indicating potential reversals.
Users wanting to detect longer-term reversals can use a higher "Trend Length" setting, this can however lead to an increased amount of displayed candlestick patterns.
To prevent false positives users also have control over a "Threshold" setting in a range between (0, 100), with values closer to 100 preventing candlesticks from being detected at the start of trends.
The "Warmup Length" serves a similar purpose, and aims to prevent sudden moves to be classified as reversals. Higher values of this setting will require trends to be established for a longer period of time for reversal conditions to be detected.
🔹 Dashboard
To evaluate the role of individual candlestick patterns as potential reversal signals relative to the proposed reversal detection method, a dashboard displaying the percentage of candlestick patterns displayed (that occur when a potential reversal is detected) over the total amount detected.
Hovering on the dashboard cells of the "Reversal %" column allows displaying the total amount of patterns detected.
🔶 CANDLESTICKS PATTERNS
This tool detects 16 popular candlestick patterns, each listed in the sub-sections below.
🔹 Bullish Patterns
Hammer - A bullish reversal pattern that forms after a decline, characterized by a small body at the upper end of the trading range and a long lower shadow.
Inverted Hammer - A bullish reversal pattern that forms after a downtrend, featuring a small body at the lower end of the trading range and a long upper shadow.
Bullish Engulfing - A bullish reversal pattern where a small bearish candlestick is followed by a larger bullish candlestick that completely engulfs the previous candle.
Rising 3 - A bullish continuation pattern that consists of a long bullish candlestick followed by three smaller bearish candlesticks and then another long bullish candlestick.
3 White Soldiers - A bullish reversal pattern consisting of three consecutive long bullish candlesticks, each opening within the previous candle's body and closing higher.
Morning Star - A bullish reversal pattern made up of three candlesticks: a long bearish candlestick, followed by a short candlestick, and then a long bullish candlestick.
Bullish Harami - A bullish reversal pattern where a small bullish candlestick is completely within a previous larger bearish candlestick.
Tweezer Bottom - A bullish reversal pattern identified by an initial bullish candle, followed by a bearish candle, both having equal lows.
🔹 Bearish Patterns
Hanging Man - A bearish reversal pattern that forms after an uptrend, characterized by a small body at the upper end of the trading range and a long lower shadow.
Shooting Star - A bearish reversal pattern that forms after an uptrend, featuring a small body at the lower end of the trading range and a long upper shadow.
Bearish Engulfing - A bearish reversal pattern where a small bullish candlestick is followed by a larger bearish candlestick that completely engulfs the previous candle.
Falling 3 - A bearish continuation pattern that consists of a long bearish candlestick followed by three smaller bullish candlesticks and then another long bearish candlestick.
3 Black Crows - A bearish reversal pattern consisting of three consecutive long bearish candlesticks, each opening within the previous candle's body and closing lower.
Evening Star - A bearish reversal pattern made up of three candlesticks: a long bullish candlestick, followed by a short candlestick, and then a long bearish candlestick.
Bearish Harami - A bearish reversal pattern where a small bearish candlestick is completely within a previous larger bullish candlestick.
Tweezer Top - A bearish reversal pattern is identified by an initial bullish candle, followed by a bearish candle, both having equal highs."
🔶 SETTINGS
🔹 Patterns
Group including toggles for each of the supported candlestick patterns. Enabled toggles will allow detection of the associated candlestick pattern.
🔹 Reversal Detection
Trend Length: Determines the sensitivity of the reversal detection method to shorter-term variation, with higher values returning a detection method more sensitive to longer-term trends.
Threshold: Determines how easy it is for the reversal detection method to consider a trend at an extreme point.
Warmup Length: Warmup period in the reversal detection method, longer values will require a longer-term trend to detect potential reversals.
🔹 Style
Color Candles: Enable candle coloring on the user chart based on the reversal detection method.
Use Gradient: Use a gradient as candle coloring.
Label Size: Size of the labels displaying the detected candlesticks patterns.
🔹 Dashboard
Show Dashboard: Display the dashboard on the user chart when enabled.
Location: Dashboard location on the user chart.
Size: Size of the displayed dashboard.

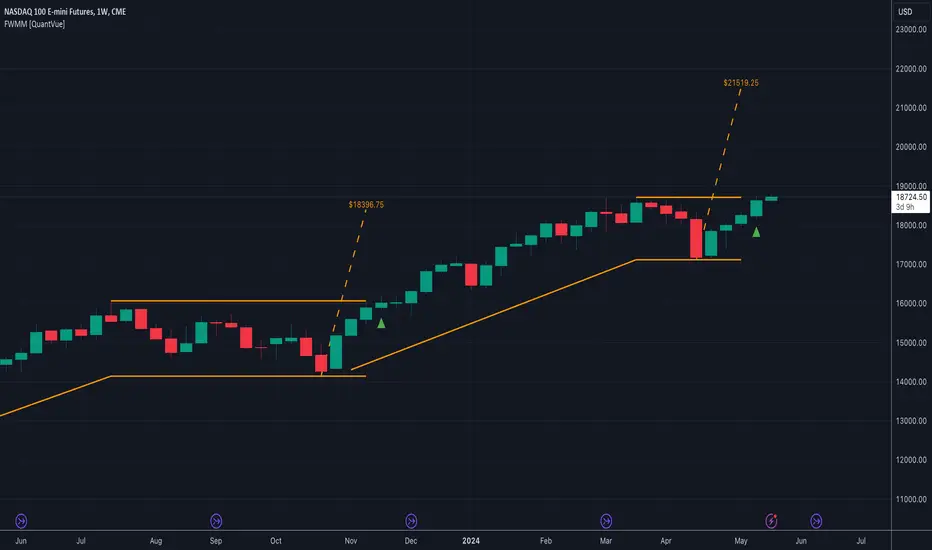
Flags With Measured Move [QuantVue]Flags with Measured Moves is a technical analysis tool that identifies bull flags and provides a measured move target.
A bull flag is a continuation pattern that occurs within the context of a general uptrend. It represents a pause or small consolidation before the price resumes its upward movement.
A bull flag consists of two sections: the flagpole and the flag.
The flagpole is the initial upward movement that occurs before the flag forms.
The flag forms as the price consolidates after the initial uptrend. During this phase, the price tends to drift downward or sideways, ideally with declining volume.
Once the flag has put in a low, the initial range of thrust is added to the flag low to form the measured move target.
Every element of the flag is customizable by the trader, including the size and length of the prior uptrend and the minimum and maximum flag depth and length.
The indicator also includes alerts for when new flags are formed, when a breakout from the flag occurs, and when the measured move target is reached.
By default, the indicator settings are set for use on a daily timeframe. If using the indicator on an intraday timeframe, you will need to adjust the settings.
Give this indicator a BOOST and COMMENT your thoughts!
We hope you enjoy.
Cheers!
Seasonality Widget [LuxAlgo]The Seasonality Widget tool allows users to easily visualize seasonal trends from various data sources.
Users can select different levels of granularity as well as different statistics to express seasonal trends.
🔶 USAGE
Seasonality allows us to observe general trends occurring at regular intervals. These intervals can be user-selected from the granularity setting and determine how the data is grouped, these include:
Hour
Day Of Week
Day Of Month
Month
Day Of Year
The above seasonal chart shows the BTCUSD seasonal price change for every hour of the day, that is the average price change taken for every specific hour. This allows us to obtain an estimate of the expected price move at specific hours of the day.
Users can select when data should start being collected using the "From Date" setting, any data before the selected date will not be included in the calculation of the Seasonality Widget.
🔹 Data To Analyze
The Seasonality Widget can return the seasonality for the following data:
Price Change
Closing price minus the previous closing price.
Price Change (%)
Closing price minus the previous closing price, divided by the
previous closing price, then multiplied by 100.
Price Change (Sign)
Sign of the price change (-1 for negative change, 1 for positive change), normalized in a range (0, 100). Values above 50 suggest more positive changes on average.
Range
High price minus low price.
Price - SMA
Price minus its simple moving average. Users can select the SMA period.
Volume
Amount of contracts traded. Allow users to see which periods are generally the most /least liquid.
Volume - SMA
Volume minus its simple moving average. Users can select the SMA period.
🔹 Filter
In addition to the "From Date" threshold users can exclude data from specific periods of time, potentially removing outliers in the final results.
The period type can be specified in the "Filter Granularity" setting. The exact time to exclude can then be specified in the "Numerical Filter Input" setting, multiple values are supported and should be comma separated.
For example, if we want to exclude the entire 2008 period we can simply select "Year" as filter granularity, then input 2008 in the "Numerical Filter Input" setting.
Do note that "Sunday" uses the value 1 as a day of the week.
🔶 DETAILS
🔹 Supported Statistics
Users can apply different statistics to the grouped data to process. These include:
Mean
Median
Max
Min
Max-Min Average
Using the median allows for obtaining a measure more robust to outliers and potentially more representative of the actual central tendency of the data.
Max and Min do not express a general tendency but allow obtaining information on the highest/lowest value of the analyzed data for specific periods.
🔶 SETTINGS
Granularity: Periods used to group data.
From Data: Starting point where data starts being collected
🔹 Data
Analyze: Specific data to be processed by the seasonality widget.
SMA Length: Period of the simple moving average used for "Price - SMA" and "Volume - SMA" options in "Analyze".
Statistic: Statistic applied to the grouped data.
🔹 Filter
Filter Granularity: Period type to exclude in the processed data.
Numerical Filter Input: Determines which of the selected hour/day of week/day of month/month/year to exclude depending on the selected Filter Granularity. Only numerical inputs can be provided. Multiple values are supported and must be comma-separated.

Fibonacci Timing Pattern IIThe Fibonacci Timing Pattern II is a price-based counter that seeks to determine medium-term reversals in price action. It is based on the following set of conditions:
* For a bullish Fibonacci timing signal II: The current close must be lower than the close prices from one and two periods ago. Simultaneously, the close price from two periods ago must be lower than the close price from three periods ago, and the close price from three periods ago must be lower than the close price from five periods ago. The Fibonacci sequence continues until the close price from thirty four periods ago which must be above the close price from fifty five periods ago.
* For a bearish Fibonacci timing signal II: The current close must be higher than the close prices from one and two periods ago. Simultaneously, the close price from two periods ago must be higher than the close price from three periods ago, and the close price from three periods ago must be higher than the close price from five periods ago. The Fibonacci sequence continues until the close price from thirty four periods ago which must be lower the close price from fifty five periods ago.
The signals of the pattern are ideally used in a sideways market or used in tandem with the trend (bullish signals are taken in a bullish market and bearish signals are taken in a bearish market).

Dip & Rip Patterns - The Quant Science🇺🇸
GENERAL OVERVIEW
This indicator detects Dip and Rip patterns by quickly highlighting them on the chart.
These patterns have become popular during the pandemic period mainly in the stock, ETF and cryptocurrency markets on which traders use two interesting strategies:
Buy The Dip
Sell The Rip
Before going into the merits of this technical indicator, let's understand what these two patterns mean and what they identify precisely.
Rip (Rise In Price) : wants to identify a market condition in which the price rises rapidly, for example from $100 to $110 in a few minutes or hours.
Dip (Drop In Price) : wants to identify a market condition in which the price drops rapidly, for example from $100 to $90 in a few minutes or hours.
HOW TO USE
For a better user experience, we recommend choosing a neutral colour for the candles while analysing with this indicator. You can quickly change the colour in Chart Settings > Symbol > Candles .
Depending on the configuration set by the user, the indicator will show Dip (Dip In Price) patterns in red and Rip (Rise In Price) patterns in green.
When the pattern forms, a circle will be displayed and a vertical line will be coloured on the chart along with the body of the candle. The user will then be able to quickly and easily track the configured market conditions.
In this example, we decided to use a 4H timeframe on the BTC/USDT pair (Binance).
Set in the user interface:
Period: 20
Dip (%): -25
Rip (%): 20
Price falls by 25% or more in 80 hours (Dip Pattern).
Price rise by 25% or more in 80 hours (Rip Pattern).
The user can easily configure the parameters via the user interface in the Inputs section (A) and change the indicator design in the Properties section (B).
🇮🇹
PANORAMICA GENERALE
Questo indicatore rileva i Dip e Rip patterns evidenziandoli velocemente sul grafico.
Questi patterns sono diventati famosi durante il periodo pandemico principalmente nel mercato delle azioni, ETF e Criptovalute su cui i trader utilizzano due interessanti strategie:
Buy The Dip
Sell The Rip
Prima di entrare nel merito di questo indicatore tecnico, comprendiamo il significato di questi due pattern e cosa identificano precisamente.
Rip (Rise In Price) : vuole identificare una condizione di mercato in cui il prezzo sale rapidamente, per esempio passando da 100$ a 110$ in pochi minuti o poche ore.
Dip (Drop In Price) : vuole identificare una condizione di mercato in cui il prezzo cala rapidamente, per esempio passando da 100$ a 90$ in pochi minuti o poche ore.
UTILIZZO
Per una migliore esperienza utente consigliamo di scegliere un colore neutro per le candele mentre si analizza con questo indicatore. Puoi cambiare velocemente il colore in Chart Settings > Symbol > Candles .
In base alla configurazione impostata dall'utente l'indicatore mostrerà in rosso i pattern Dip (Dip In Price) e in verde i pattern Rip (Rise In Price).
Quando il pattern si forma verrà visualizzato un cerchio e una linea verticale sul grafico che sarà colorata insieme al corpo della candela. L'utente quindi potrà tracciare facilmente e velocemente le condizioni di mercato configurate.
In questo esempio abbiamo deciso di utilizzare un timeframe 4H con l'obbiettivo di ricercare i patterns sul pair BTC/USDT (Binance).
Impostiamo nell'interfaccia utente:
Period: 20
Dip (%): -25
Rip (%): 20
Il prezzo diminuisce del 25% o più in 80 ore (Dip Pattern).
Il prezzo aumenta del 25% o più in 80 ore (Rip Pattern).
L' utente può configurare facilmente i parametri attraverso l'interfaccia utente nella sezione Inputs (A) e modificare il design dell'indicatore nella sezione Properties (B).

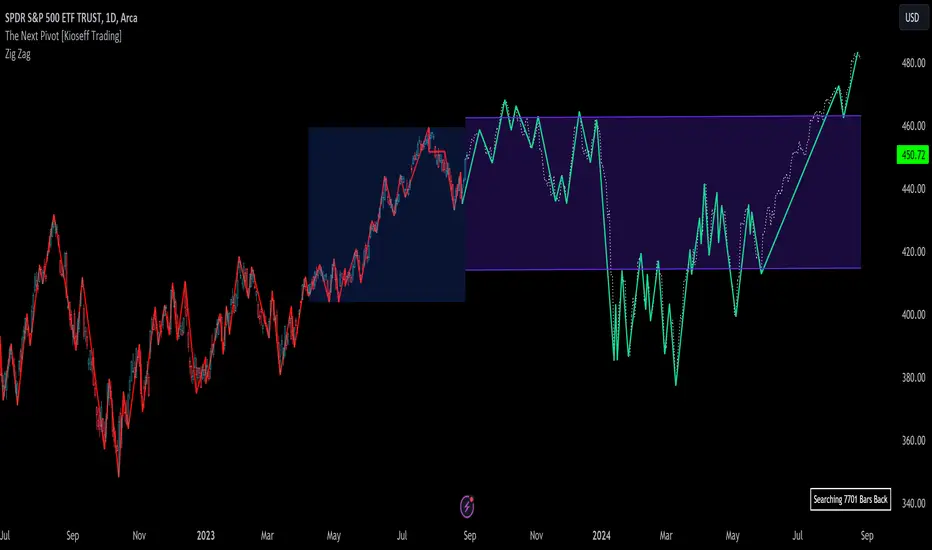
The Next Pivot [Kioseff Trading]Hello!
This script "The Next Pivot" uses various similarity measures to compare historical price sequences to the current price sequence!
Features
Find the most similar price sequence up to 100 bars from the current bar
Forecast price path up to 250 bars
Forecast ZigZag up to 250 bars
Spearmen
Pearson
Absolute Difference
Cosine Similarity
Mean Squared Error
Kendall
Forecasted linear regression channel
The image above shows/explains some of the indicator's capabilities!
The image above highlights the projected zig zag (pivots) pattern!
Colors are customizable (:
Additionally, you can plot a forecasted LinReg channel.
Should load times permit it, the script can search all bar history for a correlating sequence. This won't always be possible, contingent on the forecast length, correlation length, and the number of bars on the chart.
Reasonable Assessment
The script uses various similarity measures to find the "most similar" price sequence to what's currently happening. Once found, the subsequent price move (to the most similar sequence) is recorded and projected forward.
So,
1: Script finds most similar price sequence
2: Script takes what happened after and projects forward
While this may be useful, the projection is simply the reaction to a possible one-off "similarity" to what's currently happening. Random fluctuations are likely and, if occurring, similarities between the current price sequence and the "most similar" sequence are plausibly coincidental.
That said, if you have any ideas on cool features to add please let me know!
Thank you (:
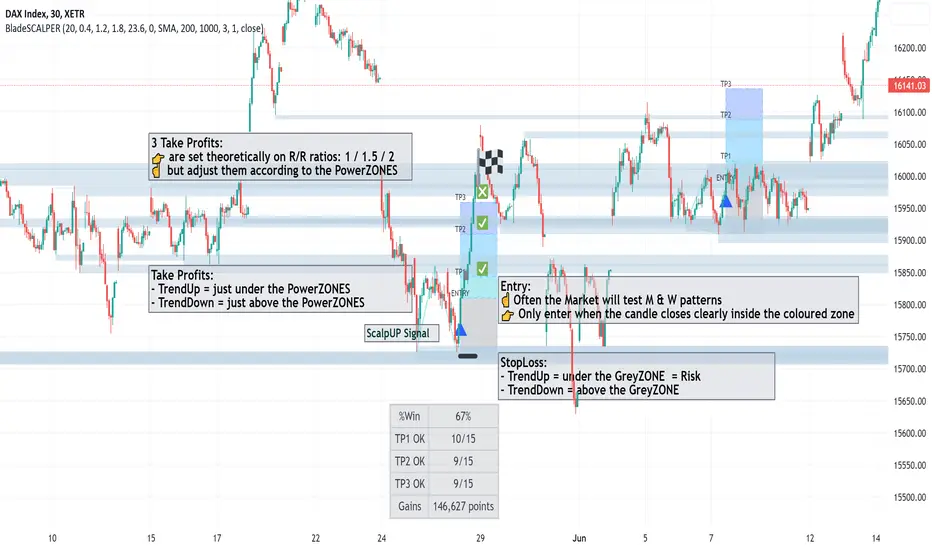
BladeSCALPER by MetaSignalsProBladeSCALPER
The sharpest tool to scalp M and W patterns
--------------------------------------------------------------------------
✔️ Get a clear signal of the next probable reversal move
✔️ Get instantly the zone where the price will probably get attracted to
✔️ Adjust TP1/TP2/TP3 accordingly to the PowerZONES
✔️ Check the winning rate of the M & W patterns on a time period
✔️ Optimize the probability of success of the M & W patterns
---------------------------------------------------------------------------
📌 For who?
---------------
Initialy, scalping is based on small moves, supposedly more predictable than big ones and repeating this operation many times.
For that, scalping means usally daytrading and not everybody can/want to be a daytrader: managing one's emotions is just critical;
But you can also use this indicator on a bigger time frame and trade when you want the M & Ws!
So basicaly BladeSCALPER is for anybody who wants to trade succesfully M&W patterns whatever Timeframe, whatever asset!
📌 For which asset?
-------------------------
BladeSCALPER is universal and works fine on all assets and all time-frames;
📌Why we made these innovations?
--------------------------------------------
"Double Tops" and "Double Bottoms", commonely called "M" and "W" as the letter explicitely shows these patterns, are some of the most predictive patterns you can find.
To exploit them, we needed to have an all in one tool:
◾ a very sharp scalping and innovative tool with embed statistics
◾ identify Risk/Reward ratio for TakeProfits
◾ and advanced Supports and Resistances information i.e the PowerZONES
📌 How to trade with BladeSCALPER ?
-----------------------------------------------
🔹 ScalpUP / ScalpDOWN Signals
The signals are given when the patterns of M and W are identified, in real time and do not repaint.
☝️ Quite often the Market will test the bottoms and the tops before validating such a figure;
👉 Only enter the trade when the candle closes clearly inside the coloured zone and not immediately on the signal.
🔹 PowerZONES
We innovated on the basic Supports and Resistances concept by adding new features with:
◾ zones that correspond better to real life trading than lines
◾ zones that change color depending of their position vs price : they turn red is the price is below them and blue if they are above.
◾ strength / attractivity of these zones = how many times the Support/Resistance have been touched in the past that will magnetize the price
◾ and distance between these zones to give a clear picture
Importance of the PowerZONES
In the current version, the TPs do not adjust to the PowerZONES, precisely to be able to keep a global statistical view;
☝️ But when you plan to trade on a signal, the real relevance is to adjust them according to the PowerZONES, of course;
👉 When buying, place your TPs just below the consecutive PowerZONES that the price could test
👉 When selling, place them just above the consecutive PowerZONES
🔹 TP1/TP2/TP3
TakeProfits are set theoretically and based on 3 risk/reward ratios: 1 / 1.5 / 2 ;
But of course this is just a setting to get an overall view of the effectiveness of the pattern on the current asset;
if you change these settings, you'll see that the Stats change accordingly.
☝️ Again, when you plan to trade on a signal, the real relevance is to adjust them according to the PowerZONES, of course;
🔹 StatsPANEL
With this innovative feature you can now see immediately
◾ the probability of win, based on the past patterns
◾ the exacts number of trades that have reached the TP1/TP2/TP3
◾ and more importantly the gains made by these trades in pips
We introduce also 2 important possibilities to improve the precision and relience of BladeSCALPER
◾ the PatternFACTOR can be changed; it defines a key percentage of the M & W patterns
◾ the MoveringAverageFILTER can be activated to
◽ suppress M patterns when the price is below the selected MovingAverage
◽ suppress W patterns when the price is over the selected MovingAverage
👉 Modifying these variables will change immediately the statistics just like the position of the TP1/TP2/TP3 and HistoryMax variables.
📌 Importance of setting up a Multi TimeFrame and doing a trend analysis
------------------------------------------------------------------------------------------
Even if you are on a scalping mode, it is crucial you set up a Multi Time Frame workspace and that you conduct a trend analysis before entering the market.
If you don't, you won't maximize your chances;
No indicator is 100% reliable, because the market cannot be modelized; anyone who tells you otherwise is lying to your face;
However, a statistical approach to the market is possible, because agents are not incoherent.
This is the meaning of stats we apply on double tops and double bottoms;
But to reinforce this point, you need to know what's happening on the next higher time unit to get a global view.
To do this, it's important to do a trend analysis or have a trend analysis tool.
---------------------------------------------------------------------------------------------------
🎛️ Configuration
----------------------
◾ Buy/Sell Signals: choose if you want to see only W or only M pattern signals
◾ PowerZones: uncheck if you don't want to see them (not recommanded)
◾ RewardBoxText: uncheck if you don't want to see the words "Entry, TP1, TP2, TP3"
◾ TakeProfit1/TakeProfit2/TakeProfit3: by default correspond to the multiple of the risk zone in grey under/above "Entry" i.e it is the classic concept of Risk/Reward ratio
◾ PowerZoneTouch: sets the number of time the zone has been touched
◾ PowerZoneDensity: increase this number if you want the number of zones to increase and reversely
◾ RewardBoxLength: adjust the standard number to the length of the anticipated move in duration
◾ StopLossExtraPoints: for a W pattern (ScalpUP) will bring lower the lower border of the RewardBOX; in a M pattern (ScalpDOWN) will bring higher the higher border of the RewardBOX; it will automatically move the distance of the TP1/TP2/TP3
◾ HistoryMax: the number of units taken into account to set the PowerZONES and the past M & W patterns
◾ PatternFactor: defines a key percentage of the M & W patterns
◾ MovingAverageFilter:
◽ untick (by default) : the filter is OFF
◽ ticked : the filter is ON
◾ MovingAveragePeriod: choose the speed of the average
◾ MovingAverageType: choose among all the types of averages available
◾ Applied to: define on which available moment of the Price the average is applied (close, open, highest...)
🛠️ Calculation & Precisions
------------------------------------
🔹 TP1/TP2/TP3
the 3 risk/reward ratios: 1 / 1.5 / 2 are multiples of the height of the grey zone = distance between your StopLoss and the entry line;
🔹 %WIN
Note that the % of success (%WIN) must be entered correctly;
Your risk/reward ratio is key and more important than the % success of the signal; you can have a % success of 30% (%WIN) which creates more points earned than a % success of 60% depending on your risk/reward ratio = the position of your TPs;
🔹 Calculation of points/pips
These are full points and we don't calculate partial outputs.
So if you have a tp1 at 20 and a tp2 at 100, if you get to tp2 you get 100 and not 20+100.
Stoplosses are of course calculated in negative.
🔹 PowerZONES
The originality of our concept is to test how many times a zone has been touched
The more the market has touched this zone the more probable it becomes a strategic zone where the liquidity will accumulate and thus will be chased!
NGL - Bar PatternsThe NGL - Bar Patterns Indicator is a user-friendly and intuitive tool designed for traders of all experience levels. It brings to the fore a unique approach to visualizing the price trends and identifying potential market zones.
This indicator paints the bars on your chart in a variety of colors, representing different price zones.
The changing colors offer an easy-to-understand visual representation of where the price is situated within a range derived from historical highs and lows.
This can help to quickly identify market conditions and potential trading opportunities.
Here's a quick rundown on how to interpret the colors:
Lime: Represents the price zones with the highest bullish momentum. A lime-colored bar indicates that the closing price is well above the historical range. It might be interpreted as a strong bullish momentum.
Green: Slightly less bullish than lime, but still signifies an upward momentum in the price.
Black: Indicates that the price is trending towards the middle of the historical range, possibly indicating a neutral market condition.
Navy: The price is below the middle but not exceedingly bearish.
Red: This color represents an area where the price is starting to show bearish momentum.
Orange: Indicates a stronger bearish momentum than red.
Purple: Represents the area where the price has strong bearish momentum.
Lime (at the bottom): This is the area with the most bearish momentum.
Please note, this indicator should not be used as a standalone decision-making tool, but in combination with other technical analysis methods or indicators. Always consider your risk tolerance and financial situation before entering trades.
Disclaimer: Past performance does not guarantee future results. The information provided by this indicator is for educational purposes only and should not be considered as financial advice. Always do your own research before making investment decisions.

Autocorrelation - The Quant ScienceAutocorrelation - The Quant Science it is an indicator developed to quickly calculate the autocorrelation of a historical series. The objective of this indicator is to plot the autocorrelation values and highlight market moments where the value is positive and exceeds the attention threshold.
This indicator can be used for manual analysis when a trader needs to search for new price patterns within the historical series or to create complex formulas in estimating future prices.
What is autocorrelation?
Autocorrelation in trading is a statistical measure used to determine the presence of a relationship or pattern of dependence between values in a financial time series over time. It represents the correlation of past values in a series with its future values. In other words, autocorrelation in trading aims to identify if there are systematic relationships between the past prices or returns of a security or market and its future prices or returns. This analysis can be helpful in identifying patterns or trends that can be leveraged for informed trading decisions. The presence of autocorrelation may suggest that market prices or returns follow a certain pattern or trend over time.
Limitations of the model
It is important to note that autocorrelation does not necessarily imply a causal relationship between past and future values. Other variables or market factors may influence the dynamics of prices or returns, and therefore autocorrelation could be merely a random coincidence. Therefore, it is essential to carefully evaluate the results of autocorrelation analysis along with other information and trading strategies to make informed decisions.
How to use
The usage is very simple, you just need to add it to the current chart to activate the indicator.
From the user interface, you can manage two important features:
1. Lenght: the delay period applied to the historical series during the autocorrelation calculation can be managed from the user interface. By default, it is set to 20, which means that the autocorrelation ratio within the historical series is calculated with a delay of 20 bars.
2. Threshold: the threshold value that the autocorrelation level must meet can be managed from the user interface. By default, it is set to 0.50, which means that the autocorrelation value must be higher than this threshold to be considered valid and displayed on the chart.
3. Bar color: the color used to display the autocorrelation data and highlight the bars when autocorrelation is valid can be managed from the user interface.
To set up the chart
We recommend disabling the 'wick' and 'border' of the candlesticks from the chart settings for a high-quality user experience.

[TTI] Zanger Volume Ratio - Intraday––––HISTORY & CREDITS 🏦
The Zanger Volume Ratio - Intraday indicator is inspired by the work of Dan Zanger, a renowned trader and creator of the Zanger Volume Ratio tool. This specific adaptation of the ratio is designed for the TradingView platform and focuses on intraday trading. Dan Zanger used this same method of reading the chart to establish a world record in turning HKEX:10 ,775 into HKEX:18 ,000,000 in under 2 years.
––––WHAT IT DOES 💡
The Zanger Volume Ratio - Intraday indicator measures the estimated end-of-day volume percentage based on intraday (depending on the timeframe of your chart) comparisons for the last X days (input in the settings). It provides insights into the stock's trading volume in real-time throughout the trading day, giving traders an idea of the stock's relative volume compared to its recent trading history. For instance if you add it to a 5min chart the ratio represents the estimated end of day volume percent based on the last 3 days, the indicator will compare the cumulative volume of the current day to the X days back cumulative average up to that same point in time and tell you how it is around the thresholds.
The indicator categorizes the volume into five levels: Extreme, High, Average, Light, and Dry Up, each represented by different colors on the chart. It also displays a pace indicator, which shows whether the volume is increasing or decreasing during the trading session.
There is also a label that shows the current reading and its pace. The pace is the indication wether the volume ratio pace is increasing and picking up or it is slowing down.
Thesholds
👉EXTREME (red): >200, means "Volume is 200% of average daily volume
👉HIGH (magenta): 110
👉AVERAGE (peach): 85
👉LIGHT (orange): 60
👉DRY (gray): <60
––––HOW TO USE IT 🔧
To use the Zanger Volume Ratio - Intraday indicator effectively, follow these steps:
1️⃣ Apply the indicator to your TradingView chart with an intraday timeframe (>=1min and less than 1 day).
2️⃣Observe the real-time volume levels and their corresponding categories (Extreme, High, Average, Light, and Dry Up) to understand the current volume dynamics.
3️⃣Keep an eye on the pace indicator (arrows) to see if the volume is increasing or decreasing during the session.
4️⃣Use the information provided by the indicator to confirm trade setups, identify potential breakouts, or detect possible reversals. For example, a stock breaking out of a key area with high or extreme volume and an increasing pace arrow may indicate a strong upward move. Conversely, a stock pulling back on light or dry up volume could signal a continuation of the trend once the volume picks up again.
Remember to combine the Zanger Volume Ratio - Intraday indicator with other technical analysis tools and your own trading strategy to make informed decisions.

Candlestick Patterns indicator V1 This indicator detects 4 candlestick patterns on the chart with confluences of EMA and market trend.
The indicator first considers the body percentages for candles and then checks the conditions for the formation of candlestick patterns.
This indicator detects the following patterns.
Pinbar
Morning & Evening Doji star
Engulfing Pattern
Tweezer Pattern
Let's talk about how the indicator detects these patterns.
Pinbar:
For Pinbar, the indicator takes the following inputs for body analysis.
Body above or below %: Using this parameter, the indicator looks for pin bar formation in which the candle's body is at specifying distance form the high or low of the candles.
Body Upper Limit: This specifies the maximum size for the body of pinbar relative to its total range.
Body Lower Limit: This specifies the minimum size for the body of pinbar relative to its total range.
Engulfing Candle:
For Engulfing Candle, the indicator takes the following inputs for body analysis.
Body Percentage of Big Candle: This specifies the size of the body of a bigger candle or the latest candle
Body Percentage of Small Candle: This specifies the size of the body for small candle that is being engulfed.
Tweezer Candle:
For Tweezer Candle, the indicator takes the following inputs for body analysis.
At what percentage should the second candle close: This specifies the close of the latest candle relative to the first candle
Body Percentage of First Candle: This specifies the size of the body of first or former candle
Body Percentage of Second Candle: This specifies the size of the body for the second or latest candle
Doji Star Candle:
For Doji Star Candle, the indicator takes the following inputs for body analysis.
Body Percentage of First Candle: This specifies the size of the body of the first candle
Body Percentage of Second Candle: This specifies the size of the body of the Second or middle candle
Body Percentage of Third Candle: This specifies the size of the body for the Third or latest candle
At what percentage should the last candle close: This specifies the close of the latest candle relative to the first candle
Also, for each candlestick, there is an option to show or hide the label and change the colour of the labels

Elliott Wave Theory [Alerts]This indicator may be one of the first to provide signals & alerts for the Elliott Wave Theory Pattern. Unfortunately, there are few, if any, indicators that are public which allow the Elliott Wave Theory to be plotted+with alerts.
Because this is experimental, I'm going to offer access to it free of charge. Send me a direct message requesting access.
Elliott Wave Theory is a complex chart pattern to learn, and even harder to master. It requires being able to identify the wave lengths of price history and using various tools to plot and assess the price structure in order to find the wave counts. Whilst there are many ways to compute the waves apart of the pattern, there is no universal method that everyone would agree upon. For this indicator, I am using the traditional method.
The different colors represent different cycle types. Using it on a higher timeframe is strongly encouraged for best results.
This version currently provides alerts for the final wave, wave 5. I WILL BE ADDING MORE TO THIS INDICATOR SHORTLY, SEE BELOW:
-Will be adding the other counts to display all the waves
-Will be adding 'correction wave' alerts
-Will be adding 'inverse' pattern alerts
-Will be improving the the labels to include their cycle type
This is not a buy & sell indicator.. This is a TOOL to help analyze the market using Elliott Wave Theory.
The indicator should be used for the following:
-Aiding with EWT analysis
-Helping find potential exit points
-Assist with learning EWT by using this as a template
-Timing trades and improving risk management
-Plotting the overall market

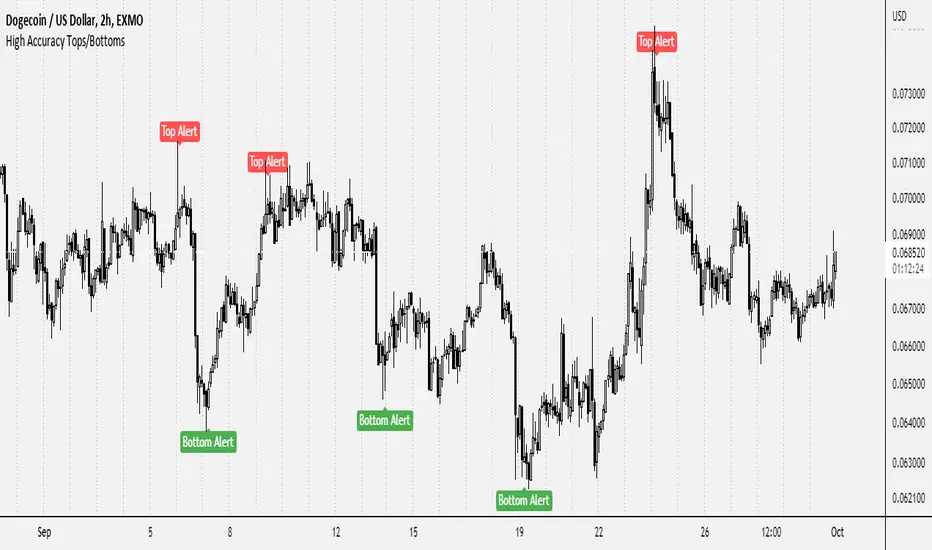
High Accuracy Tops/BottomsThis script may be TradingView's most accurate tops & bottoms indicator ever published.
Since it's experimental, I'm going to offer access to it free of charge. Send me a direct message requesting access.
5 years ago I joined TradingView and began studying price and the factors behind what causes bottoms and tops to form as well as how to find them. Fascinated by it, I spent years researching and discovered lot of different concepts that play an instrumental role with tops and bottoms: Market structure, price reactions, S/R , and much more. Through tons of experimenting, I ended up discovering a variety of NEW methods of identifying tops & bottoms. Through the years I've built up a script that has enabled the process for identifying tops and bottoms within the market to be much more convenient.
This is currently experimental and still has a lot of potential for improvement. The objective of the indicator is to help identify absolute tops and bottoms, and so far it does a great job whenever it provides a signal. It works for practically all types of securities, and surprisingly, even if they are in illiquid markets.
This indicator does NOT repaint whatsoever.
Below are a few examples of it across different security types as well as different timeframes:
Bitcoin
Gamestop (GME)
Luna / TetherUS
Crude Oil (Commodities)
Even spanning back centuries:
The indicator should be used for the following:
-Helping find potential entry points
-Timing trades and improving risk management
-Assisting with plotting top/bottom support and resistance levels
-For higher timeframes, use in conjunction with market news or global headlines
-For lower timeframes, use in conjunction with other indicators/trading tools
This is not a buy & sell indicator.. This is a TOOL to help identify accurate entry points and craft decisions based upon it.
Soon, I will be providing an updated version of it. It will include explicit details surrounding how it works and it's functions. My aim is to provide some level of value to the TradingView community in return for the great insight Tradingview and other platforms have insighted me with over price action.
Fractal Basic Chart Patterns [MyTradingCoder]This script is something that I made a long time ago in my early days of learning Pine. It is not in development anymore but has some unique and impressive utility that will help the community. This script will fractally identify chart patterns(iH&S,H&S,W,M) on any chart and timeframe. Most scripts have limitations that make the user have to adjust various parameters to get the desired result to show up on the chart. Lower input values may show smaller patterns, whereas vise versa, higher input values may show larger patterns, but you never seem to get the best of both worlds with these types of scripts. Some users may appreciate the vast majority of input parameters that most scripts provide, but others like myself may find it restrictive and annoying, as you wont get large patterns AND small patterns simultaneously.
All details needed to understand how to use the script are listed below. I will be creating new and well written scripts in the near future moving forward to help the community as best as I can, and just wanted to make it clear that this particular script is just something that I had on the backburner from a very long time ago, before I was a "Pinescript Maven" :) Enjoy!
Available Patterns:
- W Pattern
- M Pattern
- Head and Shoulders Pattern
- Inverse Head and Shoulder Pattern
Customizable inputs:
- Option to specify minimum bars required to consider a pattern.(Can be helpful if you don't want to see lower timeframe patterns, as some may not look like patterns, but if you drop the timeframe and go to the same time, there will be a pattern there on a lower scale)
- Boolean Inputs to Enable/Disable Certain Patterns
Available Alert Options:
- W Pattern Alert
- M Pattern Alert
- H&S Pattern Alert
- iH&S Pattern Alert
User Manual:
- Patterns will be drawn/detected/finalized on the bar close when the neckline is broken
- Green/Red lines represent the historical structure used to identify each pattern
- Blue dashed lines represent the projected price action based on the pattern completing
- Alerts/Indicator will not repaint(Can use 'once per bar' or 'once per bar close' and behavior will be identical. Code is optimized.)
- May have trouble on assets with daily/weekend time gaps with the projected price action dashed line due to time being used as the xloc. If this becomes a problem, leave a comment below and I will consider bringing this back into development and convert to bar_index as xloc to fix the issue.
- Patterns can be all shapes and sizes, hence the beauty of this indicator
- Leave a comment below for any questions or requests and give the indicator a like if you find it useful

Fibonacci Timing PatternThe Fibonacci Timing Pattern is a price-based counter that seeks to determine short-term and medium-term reversals in price action. It is based on the following set of conditions:
* For a bullish Fibonacci timing signal: The market must shape 8 consecutive close prices where each close price is lower than the close prices from 3 and 5 periods ago.
* For a bearish Fibonacci timing signal: The market must shape 8 consecutive close prices where each close price is higher than the close prices from 3 and 5 periods ago.
The signals of the pattern are ideally used in a sideways market or used in tandem with the trend (bullish signals are taken in a bullish market and bearish signals are taken in a bearish market).


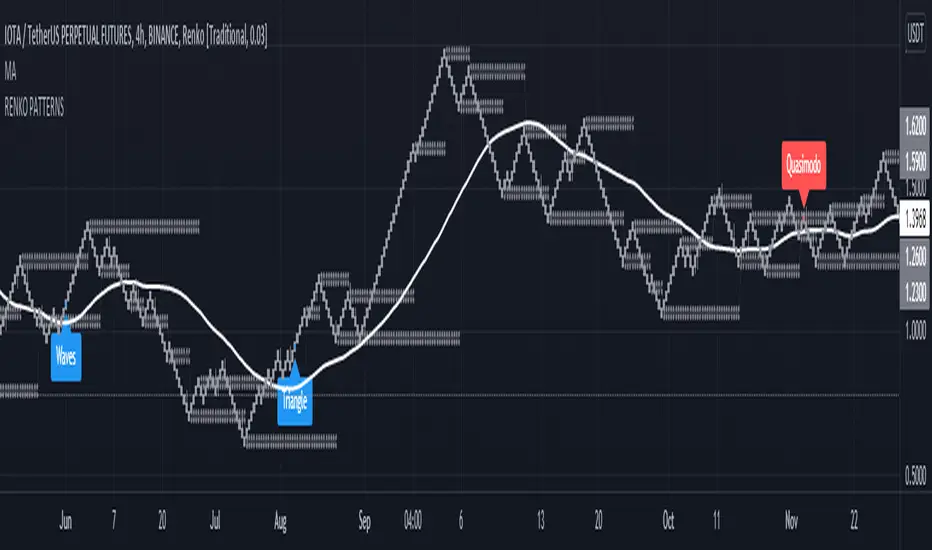
Head and Shoulders - Quasimodo etc Pattern Recognition RENKODisclaimer: Only use this pattern recognition on a RENKO chart. Renko charts plot different than traditional candles and therefore do not represent all price moves. There is a possibility of repainting while using ATR based renko charts so past results are not a 100% accurate representation of future results. Use this indicator as a part of your strategy and not as your only means of obtaining gains in the market.
Hello traders, it has been said time and time again that algorithmic software is unable to identify complex market structure like head and shoulders, quasimodo, triangle patterns and other methods humans use to base their trading decisions on. With this indicator I intend to completely crush that assumption and prove that it actualy is possible. Ofcourse an indicator is less likely to find all variation on a chart pattern and a human is probably still your best bet in finding these patterns early.
That is wy this indicator does not only use textbook patterns and has 7 variation on head and shoulders build into it. I will keep updating this indicator if I see it missed some crucial patterns. Right now it has a total of 38 patterns build into it with them being grouped under specific names. Feel free to turn off any pattern you do not like to see.
Renko patterns solve the problem of time and chaos in the markets which have been the biggest hurdle in pattern recognition software as the amount of variations to account for is just too great a number. With this script using renko it will soon be able to identify any pattern in the market and I plan to add Wyckoff to it in the future, right now I have a beta version of Wyckoff build into it but planning to add better version of it in the future. The amount of variations on Wyckoff is quite extreme so it will take a very long time to get an optimised Wyckoff identification system.
If you do not want to miss patterns I recommend to use a multi chart aproach so that you can find patterns in multiple renko brick sizes at the same time to find more entrys.
Feel free to comment any pattern you want me to add and let's make the most dedicated pattern recognition software on this platform.
Regards
HonestCowboy
Naked Bar Upward ReversalAMEX:SPY
The Naked Bar Upward Reversal is a three bar candlestick pattern with an inside candle as a entry point. This pattern is bullish since it has a candle closing red from the previous candle; the most bearish pattern possible. The following inside candle is a reversal of its previous candle with an open above the previous candle's close. Look to buy the next open above the inside candle's close.
This is a bullish reversal pattern and should be used in this context. Successful entries are found in corrections along an upward trend, or buying into a dip. Performance drops when the pattern appears at tops. To improve profitability, use a cluster of evidence to enhance the performance of this pattern. The intended time frame is within the daily and weekly.

Harmonic Pattern Detection [LuxAlgo]Harmonic patterns make up a major part of the many patterns traders use to make investment decisions. The following tool aims to automatically categorize which XABCD harmonic pattern is highlighted by the user and to alert when the price reaches the PRZ or D point.
The tool can categorize Bat, Gartley, Butterfly, and Crab patterns.
Settings
XA Precision: The Gartley and Butterfly patterns require precise ratios for the XA segment, this setting allows giving some headroom for the detection of these patterns. For example, the Gartley pattern requires a ratio for the XA segment of 0.618, using an XA precision of 0.01 will allow the segment to be considered correct if above 0.608 and under 0.628.
Bullish: Color of a bullish pattern
Bearish: Color of a bearish pattern
The X, A, B, C, D settings determine the location of the harmonic pattern vertices. The user does not need to change them from the settings, instead only requiring adjusting their location on the chart like with a regular drawing tool. Setting these vertices is required when adding the indicator to your chart.
Usage
Upon setting the harmonic pattern vertices, the segments, as well as each ratio and PRZ, will be displayed. A dashboard in the top right displays which harmonic pattern has been detected.
Detected bearish crab pattern on BTCUSD15.
Bullish butterfly pattern on MATICUSD15. It is important not to use an XA precision value that would return overlapping ranges between the Gartley/Harmonic and other patterns. Using the default value is recommended.
The upper limit of the PRZ is determined as vertex D plus 38.2% of segment DX, while the lower limit is the vertex D minus 38.2% of segment DX. Various methods exist for the determination of the PRZ, this one is general but the user can use one proper to the detected harmonic pattern.
Finally hovering on the label highlighting the segment ratios return the proper ratio used by each harmonic pattern for that precise segment.

Harmonic Scanner ProHarmonic Scanner Pro is a more advanced version of the standard Harmonic Scanner . It lets you customize almost every parameter, check for harmonic patterns much further in the past, and detect multiple patterns at once. It's a great tool to see how specific security reacts to harmonic patterns (some stocks are a textbook example of harmonic patterns , others - not really).
Some of it's features:
You can check an unlimited number of the high/low points (the free version only checks the last 5 points). Use the "Number of points to check" option to configure how many points to check.
Configurable error tolerance - you can set how many % the detected formation can differ from the "ideal" formation. (the free version uses the hardcoded 5% value)
Formations displayed on top of each other can be moved using the "Move chart" option. When two or more formations share the same points on the chart, only the topmost is visible. With the "move chart" option enabled (it's enabled by default), we move all those points up/down a bit to make all the lines nicely visible and easy to follow
Each formation uses different color on the chart, so it's easier to follow them
You can change the width of the ZigZag and formation lines
Detects the Gartley , Butterfly , Bat, Alternate Bat , Crab , Deep Crab , and Cypher .
Important: Checking for more than 200 points and displaying the ZigZag pattern + "No formation" labels at the same time might make the script too slow to render and result in a "Script error". When that happens, disable the ZigZag /"No formation" labels or decrease the number of points to check.
To get 7 days of free access to the script, just leave a comment.
Works for different types of commodities:
Works for different intervals:
Some securities work better than others with harmonic patterns:

All Candlestick Patterns - ExportThis is a copy of the built-in All Candlestick Patterns indicator, but with an additional plot for each indicator to support exporting. When exporting, each candlestick pattern will have its own column, with a 1 indicating the candlestick pattern was detected, and 0 indicating it wasn't. The plots are all overlaid, so are they are not useful for viewing, they are only used to generate values to export. This indicator also does not include alerts, so the built-in indicator should be used for everything except exporting.

[TS] S/R TweezersThe Tweezers pattern is a minor trend reversal pattern that consists of two candlesticks with more or less the same high or the same low or some variation thereof. The user can adjust this variation by changing the 'Tweezer Wick Percentage' input.
The Tweezers Bottom pattern generally appears in a downtrend with the first candlestick being a bearish candlestick, followed by a bullish candlestick.
The Tweezers Top pattern generally appears in an uptrend. The first candlestick in this pattern is a bullish candlestick followed by a bearish candlestick.
To further confirm the trend reversal, we've added an Engulfing filter. If this option is enabled, the indicator will only show Tweezer signals that also engulf the previous 1 or 2 candles.
We've also included a S/R Lookback Filter that will search for previous Support/Resistance Zones and only display those Tweezers that are within those zones. The candle lookback period is fully adjustable.
The Support/Resistance zones are based on Swing Points, which length can be adjusted by the user.
The user can also change the width of the S/R zones, by adjusting the input 'S/R Zone ATR Multiplier'
