Hooke's Law: Market ElasticityHooke's Law: Market Elasticity is a physics-based mean reversion system that models price action using the principles of Classical Mechanics.
Most technical indicators treat the market as a purely statistical entity. This script takes a different approach, treating the market as a physical object with Mass (Volume) and Stiffness (Volatility) . By adapting Hooke’s Law of Elasticity (𝐹=−𝑘𝑋), it visualizes the "Tensile Stress" between price and its equilibrium, identifying the exact moment when a trend becomes unsustainable and must "snap back."
The Physics of Trading
In physics, Hooke's Law states that the force needed to extend a spring is proportional to the distance it is stretched. We map this to financial markets using four key components:
Equilibrium (𝑋=0): The "Resting State" of the market, calculated using a Volume-Weighted Moving Average (VWMA) . This represents the fair value where buyers and sellers agree.
2. Displacement (𝑋): The distance price travels away from this equilibrium.
3. Spring Constant (𝑘): We use Volatility (Standard Deviation) to measure the market's "stiffness."
• Low Volatility: The spring is loose; price can wander far without snapping.
• High Volatility: The spring is stiff; even small deviations create massive tension.
4. Force (𝐹): The calculation is weighted by Relative Volume . A price spike on low volume has low force (easy to reverse), while a spike on high volume carries high momentum (harder to reverse).
Visual Guide & Signals
The indicator uses a hierarchy of visuals to guide you through the trade lifecycle:
1. The Elastic Ribbon (Heatmap)
Connects Price to the Baseline. As the ribbon turns Solid White , the market has reached its Elastic Limit (Critical Zone). This is your warning that a move is overextended.
2. The "Golden" Labels (LONG / SHORT)
These are your Entry Signals . They appear only when the physics "snap" is confirmed by an internal momentum filter and price action.
3. The Small Circles (Minor Reversions)
These dots represent "Minor Snaps." They occur when the elastic tension releases, but the momentum filter hasn't fully confirmed a major reversal.
• Usage: These are excellent Early Warning signs or Scale-In points for aggressive traders.
Strategy: Entries, Exits & Take Profits
This script is designed as a complete system. Here is how to manage the trade using the visual cues:
• Entry: Wait for a LONG or SHORT label to appear.
• Stop Loss: Use the Solid White Line that appears automatically with the signal. If price touches this line, the physics setup has failed—exit immediately.
• Take Profit 1 (The Equilibrium): The Gray Baseline represents the market's center of gravity. In mean reversion trading, price tends to snap back to this line. This is the statistically highest-probability target.
• Take Profit 2 (The Circles): If you are in a trade and a Circle appears in the opposite direction, it indicates the market is experiencing counter-tension. This is an ideal place to secure partial profits or trail your stop.
Settings & Configuration
• Baseline Length (Default: 34): The lookback period for the Center of Gravity.
• Elasticity Limit (Default: 2.618): The Golden Ratio is used as the standard deviation threshold for the "Critical Zone."
• Volume Weighting (Default: True): Recommended. Adds the "Mass" component to the physics calculation.
• Stop Loss Buffer (Default: 0.5): The distance (in Sigma) for the Stop Loss placement.
Risk Disclaimer
Not Financial Advice: This indicator is designed for educational and analytical purposes only. It visualizes market data based on mathematical formulas (Hooke's Law and Statistical Deviation) and does not guarantee future performance or profits.
Market Risks: Financial trading involves significant risk. The "Critical Zones" and "Signals" generated by this script identify statistical extremes, but markets can remain irrational or overextended for long periods ("Plastic Deformation").
Usage: Do not trade blindly based on these signals. Always use this tool in conjunction with your own analysis, risk management, and stop-losses. The author assumes no responsibility for any trading losses incurred while using this script.
Physics

Velocity Divergence Radar [JOAT]
Velocity Divergence Radar - Momentum Physics Edition
Overview
Velocity Divergence Radar is an open-source oscillator indicator that applies physics concepts to market analysis. It calculates price velocity (rate of change), acceleration (rate of velocity change), and jerk (rate of acceleration change) to provide a multi-dimensional view of momentum. The indicator also includes divergence detection and force vector analysis.
What This Indicator Does
The indicator calculates and displays:
Velocity - Rate of price change over a configurable period, smoothed with EMA
Acceleration - Rate of velocity change, showing momentum shifts
Jerk (3rd Derivative) - Rate of acceleration change, indicating momentum stability
Force Vectors - Volume-weighted acceleration representing market force
Kinetic Energy - Calculated as 0.5 * mass (volume ratio) * velocity squared
Momentum Conservation - Tracks momentum relative to historical average
Divergence Detection - Identifies when price and velocity diverge at pivots
How It Works
Velocity is calculated as smoothed rate of change:
calculateVelocity(series float price, simple int period) =>
float roc = ta.roc(price, period)
float velocity = ta.ema(roc, period / 2)
velocity
Acceleration is the change in velocity:
calculateAcceleration(series float velocity, simple int period) =>
float accel = ta.change(velocity, period)
float smoothAccel = ta.ema(accel, period / 2)
smoothAccel
Jerk is the change in acceleration:
calculateJerk(series float acceleration, simple int period) =>
float jerk = ta.change(acceleration, period)
float smoothJerk = ta.ema(jerk, period / 2)
smoothJerk
Force is calculated using F = m * a (mass approximated by volume ratio):
calculateForceVector(series float mass, series float acceleration) =>
float force = mass * acceleration
float forceDirection = math.sign(force)
float forceMagnitude = math.abs(force)
Signal Generation
Signals are generated based on velocity behavior:
Bullish Divergence: Price makes lower low while velocity makes higher low
Bearish Divergence: Price makes higher high while velocity makes lower high
Velocity Cross: Velocity crosses above/below zero line
Extreme Velocity: Velocity exceeds 1.5x the upper/lower zone threshold
Jerk Extreme: Jerk exceeds 2x standard deviation
Force Extreme: Force magnitude exceeds 2x average
Dashboard Panel (Top-Right)
Velocity - Current velocity value
Acceleration - Current acceleration value
Momentum Strength - Combined velocity and acceleration strength
Radar Score - Composite score based on velocity and acceleration
Direction - STRONG UP/SLOWING UP/STRONG DOWN/SLOWING DOWN/FLAT
Jerk - Current jerk value
Force Vector - Current force magnitude
Kinetic Energy - Current kinetic energy value
Physics Score - Overall physics-based momentum score
Signal - Current actionable status
Visual Elements
Velocity Line - Main oscillator line with color based on direction
Velocity EMA - Smoothed velocity for trend reference
Acceleration Histogram - Bar chart showing acceleration direction
Jerk Area - Filled area showing jerk magnitude
Vector Magnitude - Line showing combined vector strength
Radar Scan - Oscillating pattern for visual effect
Zone Lines - Upper and lower threshold lines
Divergence Labels - BULL DIV / BEAR DIV markers
Extreme Markers - Triangles at velocity extremes
Input Parameters
Velocity Period (default: 14) - Period for velocity calculation
Acceleration Period (default: 7) - Period for acceleration calculation
Divergence Lookback (default: 10) - Bars to scan for divergence
Radar Sensitivity (default: 1.0) - Zone threshold multiplier
Jerk Analysis (default: true) - Enable 3rd derivative calculation
Force Vectors (default: true) - Enable force analysis
Kinetic Energy (default: true) - Enable energy calculation
Momentum Conservation (default: true) - Enable momentum tracking
Suggested Use Cases
Identify momentum direction using velocity sign and magnitude
Watch for divergences as potential reversal warnings
Use acceleration to detect momentum shifts before price confirms
Monitor jerk for momentum stability assessment
Combine force and kinetic energy for conviction analysis
Timeframe Recommendations
Works on all timeframes. Higher timeframes provide smoother readings; lower timeframes show more granular momentum changes.
Limitations
Physics analogies are conceptual and not literal market physics
Divergence detection uses pivot-based lookback and may lag
Force calculation uses volume ratio as mass proxy
Kinetic energy is a derived metric, not actual energy
Open-Source and Disclaimer
This script is published as open-source under the Mozilla Public License 2.0 for educational purposes. It does not constitute financial advice. Past performance does not guarantee future results. Always use proper risk management.
- Made with passion by officialjackofalltrades

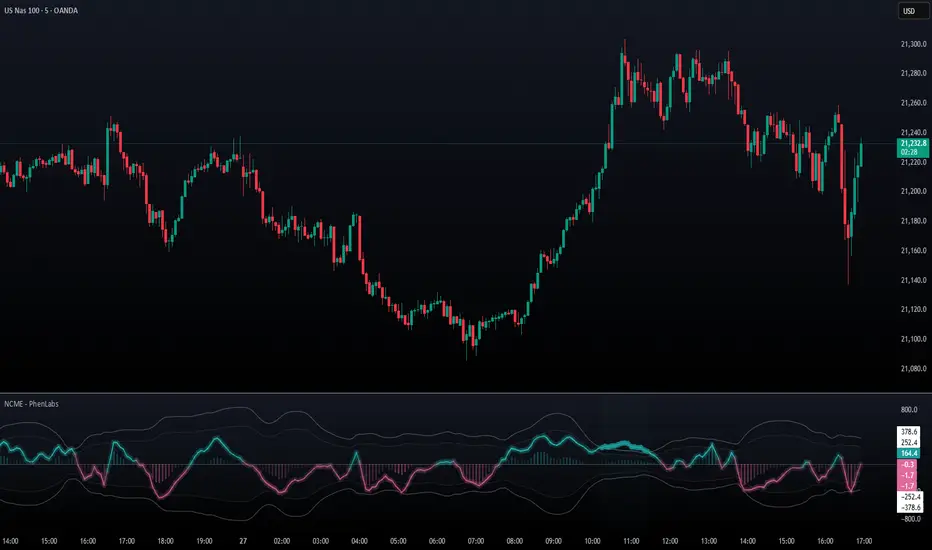
Navier-Cauchy Market Elasticity [PhenLabs]📊 Navier-Cauchy Market Elasticity
Version: PineScript™ v6
📌 Description
The Navier-Cauchy Market Elasticity (NCME) indicator takes a new step into technical analysis by applying materials science principles to financial markets. Similar to last weeks release utilizing Navier-Stokes dynamics equation this indicator focuses on the elastic interaction of virtual “solids”. Based on elasticity theory used in engineering, NCME treats price movements as material deformations, calculating market stress and strain using proven physics formulas. This unique approach reveals hidden market dynamics invisible to traditional indicators.
By implementing Lamé parameters and Young’s modulus calculations, NCME identifies critical stress points where markets exhibit extreme tension or compression. These zones often precede significant price movements, providing traders with advanced warning of potential reversals or breakouts.
🚀 Points of Innovation
• First indicator to apply Navier-Cauchy elasticity equations to market analysis
• Dynamic stress tensor calculations adapted for one-dimensional price movements
• Real-time Poisson ratio adjustments for market-specific elasticity modeling
• Gradient-based coloring system that visualizes stress intensity variations
• Advanced display modes with customizable visual layers for professional analysis
• Physics-based volatility normalization using Young’s modulus principles
🔧 Core Components
• Elasticity Engine: Calculates market elasticity using volatility-adjusted Young’s modulus
• Stress Tensor System: Computes normal stress values using Lamé parameters (λ and μ)
• Strain Measurement: Tracks price displacement relative to historical movement patterns
• Dynamic Bands: Statistical deviation bands that adapt to market elasticity changes
🔥 Key Features
• Four Display Modes: Choose between Histogram, Line, Both, or Advanced visualization
• Five Color Schemes: Modern, Classic, Neon, Ocean, and Fire themes with gradient support
• Background Stress Zones: Five distinct zones showing market stress levels visually
• Customizable Smoothing: Adjustable period for noise reduction without signal lag
• Extreme Value Detection: Automatic marking of critical stress points with visual alerts
• Advanced Mode Options: Glow effects, momentum ribbon, and extreme dots toggles
🎨 Visualization
• Stress Line: Primary indicator showing real-time market stress with gradient coloring
• Histogram Bars: Normalized stress values with dynamic opacity based on magnitude
• Reference Bands: Primary and secondary deviation bands for context
• Background Zones: Color-coded regions indicating stress intensity levels
• Signal Dots: Markers appearing at extreme stress points for easy identification
📖 Usage Guidelines
Display Settings
• Display Style
○ Default: Advanced
○ Options: Histogram, Line, Both, Advanced
○ Description: Controls visual presentation mode. Advanced offers the most comprehensive view with multiple layers
• Smoothing Period
○ Default: 3
○ Range: 1-50
○ Description: Moving average periods for noise reduction. Higher values create smoother signals but may introduce lag
Elasticity Parameters
• Displacement Length
○ Default: 14
○ Range: 1-100
○ Description: Lookback period for strain calculation. Shorter periods detect rapid stress changes
• Elasticity Length
○ Default: 30
○ Range: 1-200
○ Description: Period for volatility-based elasticity calculation. Longer periods provide more stable readings
• Poisson Ratio
○ Default: 0.3
○ Range: 0-0.5
○ Description: Theoretical elasticity ratio. 0.3 works well for most markets; adjust for specific asset classes
✅ Best Use Cases
• Identifying market tension before major breakouts
• Detecting compression zones during accumulation phases
• Confirming trend strength through stress persistence
• Timing reversals at extreme stress levels
• Multi-timeframe stress analysis for comprehensive market view
⚠️ Limitations
• Requires sufficient price history for accurate elasticity calculations
• May produce false signals during unprecedented market events
• Works best in liquid markets with consistent volume
• Not suitable as a standalone trading system
💡 What Makes This Unique
• Physics-Based Foundation: First indicator to properly implement elasticity theory
• Academic Rigor: Based on proven Navier-Cauchy equations from materials science
• Visual Innovation: Multiple display modes with professional-grade aesthetics
• Adaptive Technology: Self-adjusting parameters based on market conditions
🔬 How It Works
1. Strain Calculation:
• Measures price displacement over specified period
• Normalizes displacement relative to price level
2. Elasticity Determination:
• Calculates Young’s modulus using inverse volatility
• Updates Lamé parameters based on Poisson ratio
3. Stress Computation:
• Applies elasticity theory formula: σ = (λ + 2μ) × ε
• Scales result for visual clarity
• Applies smoothing to reduce noise
💡 Note: NCME represents a breakthrough in applying physics principles to market analysis. While based on proven scientific formulas, remember that markets are complex systems influenced by human psychology and external factors. Use NCME as part of a comprehensive trading strategy with proper risk management.
Particle Physics Moving AverageThis indicator simulates the physics of a particle attracted by a distance-dependent force towards the evolving value of the series it's applied to.
Its parameters include:
The mass of the particle
The exponent of the force function f=d^x
A "medium damping factor" (viscosity of the universe)
Compression/extension damping factors (for simulating spring-damping functions)
This implementation also adds a second set of all of these parameters, and tracks 16 particles evenly interpolated between the two sets.
It's a kind of Swiss Army Knife of Moving Average-type functions; For instance, because the position and velocity of the particle include a "historical knowlege" of the series, it turns out that the Exponential Moving Average function simply "falls out" of the algorithm in certain configurations; instead of being configured by defining a period of samples over which to calculate an Exponential Moving Average, in this derivation, it is tuned by changing the mass and/or medium damping parameters.
But the algorithm can do much more than simply replicate an EMA... A particle acted on by a force that is a linear function of distance (force exponent=1) simulates the physics of a sprung-mass system, with a mass-dependent resonant frequency. By altering the particle mass and damping parameters, you can simulate something like an automobile suspension, letting your particle track a stock's price like a Cadillac or a Corvette (or both, including intermediates) depending on your setup. Particles will have a natural resonance with a frequency that depends on its mass... A higher mass particle (i.e. higher inertia) will resonate at a lower frequency than one with a lower mass (and of course, in this indicator, you can display particles that interpolate through a range of masses.)
The real beauty of this general-purpose algorithm is that the force function can be extended with other components, affecting the trajectory of the particle; For instance "volume" could be factored into the current distance-based force function, strengthening or weakening the impulse accordingly. (I'll probably provide updates to the script that incoroprate different ideas I come up with.)
As currently pictured above, the indicator is interpolating between a medium-damped EMA-like configuration (red) and a more extension-damped suspension-like configuration (blue).
This indicator is merely a tool that provides a space to explore such a simulation, to let you see how tweaking parameters affects the simulations. It doesn't provide buy or sell signals, although you might find that it could be adapted into an MACD-like signal generator... But you're on your own for that.

Newton Force and MomentumThis indicator is meant to show the Force of price, based on Newton's Second Law of Motion; and the momentum of price. Force is the value on the left, and momentum on the right.
Originally this was supposed to only be an indicator looking at Force, but because the already popular indicator called "Momentum" does not calculate the momentum of price, but rather the change of price depending on how far back you want to look; I decided to add the Momentum aspect to the indicator.
*BTW if you find this script useful thank and follow @overttherainbow, because they are the one who gave me the idea for this script.*

Mathematical Derivatives of PriceThis indicator is meant to show the Velocity (1st order derivative), Acceleration (2nd order derivative), Jerk (3rd order derivative), Snap (4th order derivative), Crackle (5th order derivative), & Pop (6th order derivative) of price. The values at the top of the indicator window are in this order from left to right. I don't particularly know how this would be used in a trading strategy, but if you're ever curious about how quickly price is moving and how much it is accelerating, then you could use this tool.
*If you only care about velocity and acceleration, and don't like how squished the window is because of the long decimal numbers then edit the "precision" value in the first line of the script to a smaller number of your choosing.*
