Pivot Average [Misu]█ This Indicator is based on Pivot Points.
It aggregates closed Pivot Points to determine a " Pivot Average " line.
Pivot Points here refer to highs and lows.
█ Usages:
Pivot Average can be used as resistance or breakout area.
It is also very usefull to find battle zones.
It can also be used as a trend indicator: when the price is below, trend is down, when price is above, trend is up.
Mixed with momentum/volatility indicator it is very powerfull.
█ Parameters:
Deviation: Parameter used to calculate pivots.
Depth: Parameter used to calculate pivots.
Length: History Lenght used to determine Pivot Average.
Smoothing MA Lenght: MA lenght used to smooth Pivot Average.
Close Range %: Define price percentage change required to determine close pivots.
Color: Color of the Pivot Average.
Titik Pivot

Cup & HandleHi, here is my take on 'Cup & Handle'
Pivot Points - ph (highest points in a certain period) are stored in an array
When there is a new ph , previous ph's are compared to the latest one.
A temporary test line is drawn between these 2 points.
The script checks if a close (between these 2 points) doesn't break above this test line.
(test line is deleted afterwards)
If it doesn't, and the '% max breaks' are not breached, 2 circle shaped lines are drawn
(Top & Bottom line of the cup) which forms the Cup, together with the Handle.
The red box (Handle) is the maximum 33-50% retracement (% of cup height)
-> Only the latest pattern is shown, enabling 'Show Cup labels' shows the position of cup patterns in history.
They can be visualised by using 'Bar Replay'
'% max breaks' -> 'maximum highs/lows breaking through the Top/Bottom line
(% of bars between left & right extreme points of the Cup)
Settings:
- 'Left', 'Right' -> regulates Pivot Point values
- 'PP back' -> max lookback for Pivot High
More explanation can be found in following print screens,
or by checking the tooltips in the settings
Cheers!

Monthly Returns of a Strategy in a ChartIt's a simple example of how you can present your strategy's monthly performance in a chart.
You maybe know that there is no support of these kind of charts in TradingView so this chart is actually a table object under the hood.
Table visual appearance is customizable, you can change:
Location
Bar Width / High
Colors
Thanks to @MUQWISHI for hard work, for helping me coding it.
It's not about the strategy itself but the way you display returns on your chart. So pls don't critique my choice of the strategy and its performance 🙂
Disclaimer
Please remember that past performance may not be indicative of future results.
Due to various factors, including changing market conditions, the strategy may no longer perform as well as in historical backtesting.
This post and the script don’t provide any financial advice.

Mark StructureMark Structure is building the market swing structure, minor and sub structure and marks all possible insignificant pivots
Building such structure is really complex task to do, that has a lot of obstacles and challenges. I'm doing my best to develop this indicator behaving in absolutely expectable and right way. Fill free to leave any comments or bug reports.
it supports:
- Marking all pivots with labels or join them continuously with trend lines.
- Marking minor and sub structured swings with labels or join them continuously with trend lines. Marking BOS or SMS BOS, which are mbos. Minor and substructure are structures inside swing structure and it can differ from the structure of lower timeframe
- Marking swings of swing structure with labels or join them continuously with trend lines. Marking BOS or SMS BOS of swing structure
- Changing bullish and bearish colors of each kind of structures
- Changing pivot labelings
- Changing colors of BOSs
Remarks:
- As I told you guys before, it has a lot of challenging cases. eg we have swing low and high on the same candle and in order to decide which pivot goes first I take lower time frame data to figure out what pivot is the first, but it happens that on lower time frame the same issue takes place, due to limitation of TradingView I can't go infinitely to lower timeframes to solve this issue, so I mark those cases with labels
- Another issue is very beginning of the trend its hard to detect swing structure there due to missing historical data. so skip a few waves in the very beginning
- Don't expect to have minor and sub structure in each swing waves, its totally fine when you don't have them at all
- Swing structure is the most significant structure and shows real price direction. Trend change is confirmed when for bull->bear the last HLbull LH>HH and HH-HL-HH are confirmed. You can change labelling for unconfirmed swing trend in the settings. By default its already done

Mark LevelsMark Levels is marking liquidity pools by drawing lines on their pivots and labelling them so that you can instantly detect them on your realtime chart
It supports:
- marking previous and current day lows and highs
- marking previous and current week lows and highs
- marking previous and current month lows and highs
- marking equal lows and highs
technically it re-builds them on the last bar or as soon as new realtime bar is updated. it looks with 1k bars back to find higher timeframe ranges and find lows and highs there
Adjustments:
- changing the line style of the group
- changing the lines color and the labels on the groups
- currently pools are split on 2 groups Period Liquidity and Equal Pivots Liquidity.
Unraided Liquidity and S/R PivotsThis indicator is designed to show key pivot points, also known as levels, which could provide good trade entries.
Utilising liquidity concepts, untested pivot levels can be a good place to enter a trade after the pivot is tested, liquidity is taken and the direction reverses.
Alternatively, utilising the option of viewing already tested levels, you can easily see the key support and resistance areas that price is likely to have a strong reaction to, whether it wants to go toward or bounce away from these levels.
The indicator does not give buy and sell signals, it is up to you to use the levels to form your trading plan.
Oorah.

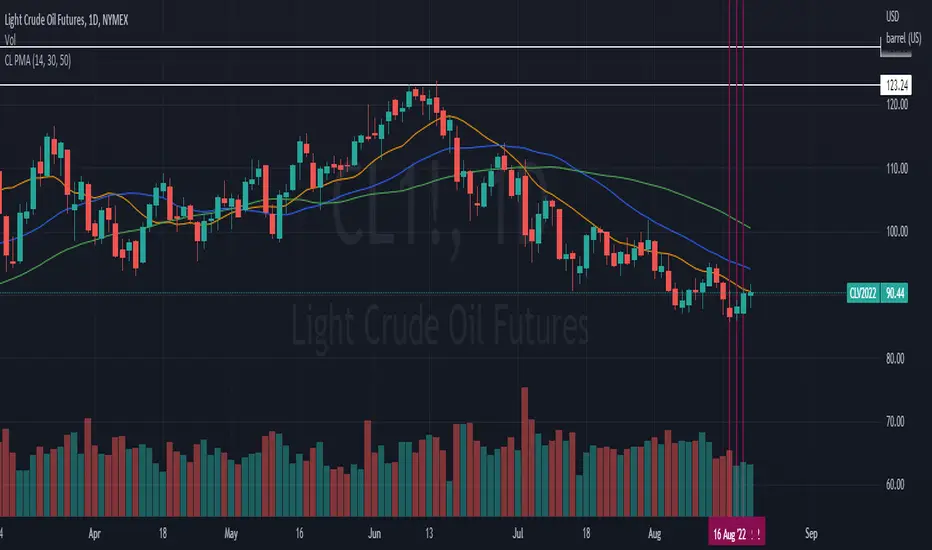
CL PMAPivot moving averages useing SMA's. This study is just a tweak from the study already done by @QUANTCT. I just cleaned it up and used SMAs instead of EMAs so he deserves most credit.
TriexDev - SuperBuySellTrendMinimal but powerful.
Have been using this for myself, so thought it would be nice to share publicly. Of course no script is correct 100% of the time, but this is one of if not the best in my basic tools.
Two indicators will appear, the default ATR multipliers are already set for what I believe to be perfect for this particular (double indicator) strategy.
If you want to break it yourself (I couldn't find anything that tested more accurately myself), you can do so in the settings.
Basic rundown:
A single Buy/Sell indicator in the dim colour; may be setting a direction change, or just healthy movement.
When the brighter Buy/Sell indicator appears; it often means that a change in direction (uptrend or downtrend) is confirmed.
You can see here, there was a (brighter) green indicator which flipped down then up into a (brighter) red sell indicator which set the downtrend. Once you understand the basics of how it works - it can become a very useful tool in your trading arsenal.
Typically I will use this and other indicators to confirm likeliness of a direction change prior to the brighter/confirmation one appearing - but just going by the 2nd(brighter) indicators, have found it to be surprisingly accurate.
Tends to work well on virtually all timeframes, but personally prefer to use it on 5min,15min,1hr, 4hr, daily, weekly. Will still work for shorter/other timeframes, but may be more accurate on mid ones.

Price Pivots for NASDQ 100 StocksPrice Pivots for NASDQ 100 Stocks
What is this Indicator?
• This indicator calculates the price range a Stock can move in a Day.
Advantages of this Indicator
• This is a Leading indicator, not Dynamic or Repaint.
• Helps to identify the tight range of price movement.
• Can easily identify the Options strike price.
• Develops a discipline in placing Targets.
Disadvantages of this Indicator
• The indicator is specifically made for NASDQ 100 stocks. The levels won't work for other stocks.
• The indicator shows nothing for other indexes and stocks other than above mentioned.
• The data need to be entered manually.
Who to use?
Highly beneficial for Day Traders, it can be used for Swing and Positions as well.
What timeframe to use?
• Any timeframe.
• The highlighted levels in Red and Green will not show correct levels in 1 minute timeframe.
• 5min is recommended for Day Traders.
When to use?
• Wait for proper swing to form.
• Recommended to avoid 1st 1 hour or market open, that is 9.15am to 10.15 or 10.30am.
• Within this time a proper swing will be formed.
What are the Lines?
• The concept is the price will move from one pivot to another.
• Entry and Exit can be these levels as Reversal or Retracement.
Gray Lines:
• Every lines with price labels are the Strike Prices in the Option Chain.
• Price moves from 1 Strike Price level to another.
• The dashed lines are average levels of 2 Strike Prices.
Red & Green Lines:
• The Red and Green Lines will appear only after the first 1 hour.
• The levels are calculated based on the 1st 1 hour.
• Red Lines are important Resistance levels, these are strong Bearish reversal points. It is also a breakout level, this need to be figured out from the past levels, trend, percentage change and consolidation.
• Green Lines are important Support levels, these are strong Bullish reversal points. It is also a breakdown level, this need to be figured out from the past levels, trend, percentage change and consolidation.
What are the Labels?
• First Number: Price of that level.
• Numbers in (): Percentage change and Change of price from LTP (Last Traded Price) to that Level.
How to use?
Entry:
• Enter when price is closer to the Red or Green lines.
• Enter after considering previous Swing and Trend.
• Note the 50% of previous Swing.
• Enter Short when price reverse from each level.
• If 50% of swing and the pivot level is closer it can be a good entry.
Exit:
• Use the logic of Entry, each level can be a target.
• Exit when price is closer to the Red or Green lines.
Indicator Menu
Source
• Custom: Enter the price manually after choosing the Source as Custom to show the Pivots at that price.
• LTP: Pivot is calculated based on Last Traded Price.
• Day Open: Pivot is calculated based on current day opening price.
• PD Close: Pivot is calculated based on previous day closing price.
• PD HL2: Pivot is calculated based on previous day average of High and Low.
• PD HLC3: Pivot is calculated based on previous day average of High, Low and Close.
"Time (Vertical Lines)"
• This is a marker of every 1 hour.
• Usually major price movement happen between previous day last 1 hour to today first 1 hour.
• Two swings can happen between first 2 hour of current day.
• At the end of the day last 1 hour another important movement will happen.
• Usually rest of the time won't show any interesting movement.
To the Users
• Certain symbols may show the levels as a single line. For such symbols choose a different Source or Timeframe from the indicator menu.
• Please inform if any of the Symbol's price levels don't react to the pivots , include the Symbol a well.
• Also inform if you notice any wrong values, errors or abnormal behavior in the indicator.
• Feel free to suggest or adding new features and options.
General Tips
• It is good if Stock trend is same as that of Index trend.
• Lots of indicators creates lots of confusion.
• Keep the chart simple and clean.
• Buy Low and Sell High.
• Master averages or 50%.
• Previous Swing High and Swing Low are crucial.
Important Note
• Currently the levels are in testing stage.
• Eventually the levels of certain symbols will be corrected after each update and test.

Average Daily Range (ADR) (Multi Timeframe, Multi Period)Average Daily Range (ADR)
(Multi Timeframe, Multi Period, Extended Levels)
Tips
• Narrow Zones are an indication of breakouts. It can be a very tight range as well.
• Wider Zones can be Sideways or Volatile.
What is this Indicator?
• This is Average Daily Range (ADR) Zones or Pivots.
• This have Multi Timeframe, Multi Period (Up to 3 Levels) and Extended Target Levels.
Advantages of this Indicator
• This is a Leading indicator, not Dynamic or Repaint.
• Helps to identify the reversal points.
• The levels are more accurate and not like the old formulas.
• Can practically follow the Buy Low and Sell High principle.
• Helps to keep minimum Stop Loss.
Who to use?
• Highly beneficial for Day Traders
• It can be used for Swing and Positions as well.
What timeframe to use?
• Any timeframe.
When to use?
• Any market conditions.
How to use?
Entry
• Long entry when the Price reach at or closer to the Green Support zone.
• Long entry when the Price retrace to the Red Resistance zone.
• Short entry when the Price reach at or closer to the Red Resistance zone.
• Short entry when the Price retrace to the Green Support zone.
• Long or Short at the Pivot line.
Exit
• Use past ADR levels as targets.
• Or use the Target levels in the indicator for breakouts.
• Use the Pivot line as target.
• Use Support or Resistance Zones as targets in reversal method.
What are the Lines?
Gray Line:
• It the day Open or can be considered as Pivot.
Red & Green ADR Zones:
• Red Zone is Resistance.
• Green Zone is Support.
• Mostly price can reverse from this Zones.
• Multiple Red and Green Lines forms a Zone.
• These lines are average levels of past days which helps to figure out the maximum and minimum price range that can be moved in that day.
• The default number of days are 5, 7 and 14. This can be customized.
Red & Green Target Lines:
• These are Target levels.
What are the Labels?
• First Number: Price of that level.
• Numbers in (): Percentage change and Change of price from LTP (Last Traded Price) to that Level.
General Tips
• It is good if Stock trend is same as that of the Index trend.
• Lots of indicators creates lots of confusion.
• Keep the chart simple and clean.
• Buy Low and Sell High.
• Master averages or 50%.

50% Strat RetracementThe purpose of this script is to show/alert you when there is a 50% Strat Reversal. It works very well to find possible 3 candles.
The arrows, and line can be turned on and off.
You can change the 50% to say 45% so that you will be alerted before it actually hits the 50% retracement.
The script will only alert if the reversal is a 2up red candle, a 2up green candle which will hopefully turn into a 3 candle.

Auto Round levels by Script051This indicator is designed to show psychological levels/round levels.
The difference between this version and the others is that :
It will automatically show round levels for each symbol you select without having to enter "tick value" manually.
Settings
Gap : If the value is equal to zero, the round levels will be found automatically, but if you change the value, the gap between the lines will be adjusted based on the value you specified.
X2 and /2 : doubles or halves the distance between round lines
Number of lines : Specifies the number of lines to be displayed

Customizable Pivot Support/Resistance Zones [MyTradingCoder]This script uses the standard pivot-high/pivot-low built-in methods to identify pivot points on the chart as a base calculation for the zones. Rather than displaying basic lines, it displays a zone from the original pivot point to the closest part of the available body on the same candle. The script comes in handy by utilizing Pinescripts available input.source() function to allow for an external indicators output value to be used within the indicator. Make sure to read all of the TOOLTIPS in the indicator settings menu to get a full understanding of what each setting does, and how it can affect the results that end up on the chart.
By enabling the custom filter in the indicator settings, you will notice you have the ability to filter out zones using an external indicator such as an RSI. Maybe you only want zones to be calculated/drawn when the RSI is overbought or oversold, or maybe you only want the zones to calculate/draw if the Supertrend is green or red. The list of possible filters that you can implement is too many to count. Feel free to play around with the indicator however you like, and configure something that you find to be the most useful for your trading.
On top of everything listed above, the indicator has pre-programmed built-in alertconditions so that you can potentially automate trading, or get a notification to your cell phone when a zone is being touched/broken.

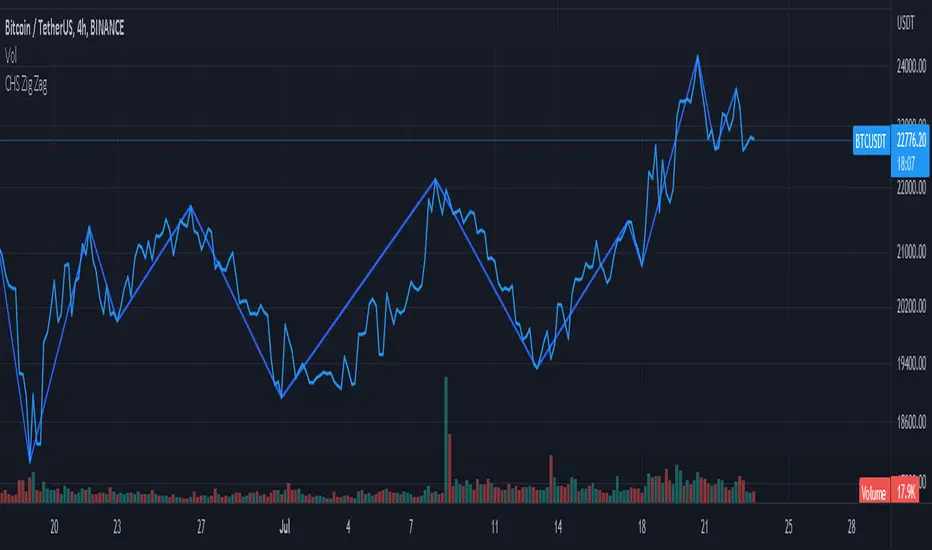
CHS Zig ZagCHS ZigZag stands for Changeable Source ZigZag
The original ZigZag indicator offered by TradingView doesn't have the ability to measure the tips and troughs based on closing prices (line chart), however, this indicator is capable of receiving an input from user that determines the price source used for further calculations.
The default inputs of the original ZigZag indicator have been also changed in order to make it adapt to pivots formed on line chart but users can change arbitrarily.
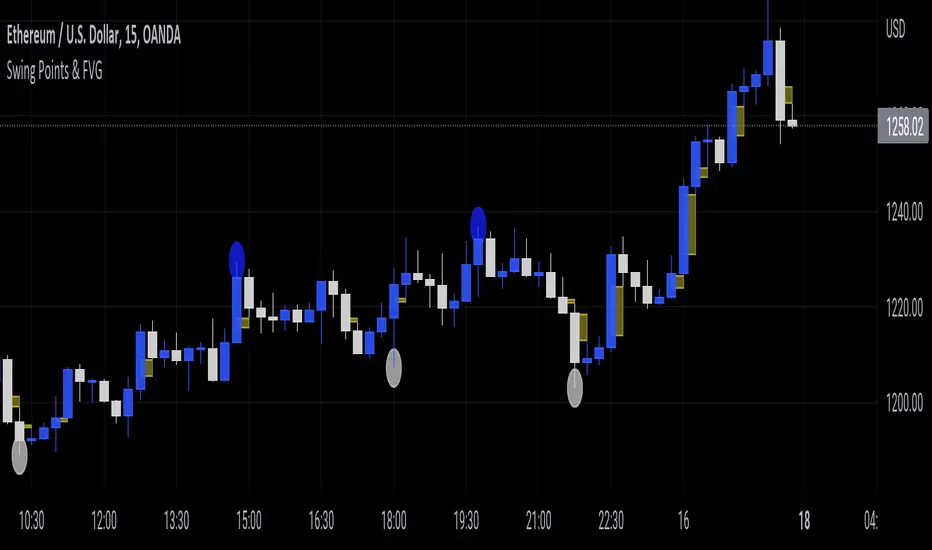
Swing Points & FVGClassic ITH/ITL
Intermediate Term High - High that has short term high on either of it's side.
Intermediate Term Low - Low that has short term low on either of it's side.
FVG
The indicator also marks Fair Value Gaps which is a very important concept in price action trading. FVGs are formed when there is ineffeciency,or imbalance, in the market.
Rebalanced ITH/ITL
Rebalanced ITH - A short term high that rebalanced the ineffeciency in price can be considered as an Intermediate Term High.
Rebalanced ITL - A short term low that rebalanced the ineffeciency in price can be considered as an Intermediate Term Low.
Use the ITH and ITL points marked by the indicator to determine the structure of the market.
Indicator repaints only when it tries to identify the latest ITH/ITL.
Pre Market \ Opening Range High LowGreen vertical lines are showing pre market open and then the opening range as the first hour of market NYSE market open
Pre market high and low are blue lines | intraday opening range high low are in white
Trades are taken in the current direction above | below range breaks with the direction of price action using the moving averages
Price breaking through moving averages and a range is the optimal trade to enter - exit at next range for target - stop loss below the lower | higher moving average depending on short or long
A break above or below the intraday high or low and pre market high or low can give massive profits trailing your stop loss as price runs
Using MA 5 and 12 to filter out entries and exits above or below the ranges short or long is also another strategy to implement
BEST TIME FRAME TO USE IS 5 MINUTE

Price Pivots for NSE Index & F&O StocksPrice Pivots for NSE Index & F&O Stocks
What is this Indicator?
• This indicator calculates the price range a Stock or Index can move in a Day, Week or Month.
Advantages of this Indicator
• This is a Leading indicator, not Dynamic or Repaint.
• Helps to identify the tight range of price movement.
• Can easily identify the Options strike price.
• The levels are more reliable and authentic than Gann Square of 9 Levels.
• Develops a discipline in placing Targets.
Disadvantages of this Indicator
• The indicator is specifically made for National Stock Exchange of India (NSE) listed index and stocks.
• The indicator is calculated only for index NIFTY, BANKNIFTY, FINNIFTY, MIDCPNIFTY and Stocks listed in Futures and Options.
• The indicator shows nothing for other indexes and stocks other than above mentioned.
• The data need to be entered manually.
• The data need to be updated manually when the F&O listed stocks are updated.
Who to use?
Highly beneficial for Day Traders, it can be used for Swing and Positions as well.
What timeframe to use?
• Any timeframe.
• The highlighted levels in Red and Green will not show correct levels in 1 minute timeframe.
• 5min is recommended for Day Traders.
When to use?
• Wait for proper swing to form.
• Recommended to avoid 1st 1 hour or market open, that is 9.15am to 10.15 or 10.30am.
• Within this time a proper swing will be formed.
How to use?
Entry
• Enter when the Price reach closer to the Blue line.
• Enter Long when the Price takes a pullback or breakout at the Red lines.
Exit
• Exit position when the Price reach closer to the Red lines in Long positions.
What are the Lines?
Gray Lines:
• Every lines with price labels are the Strike Prices in the Option Chain from NSE website.
• Price moves from 1 Strike Price level to another.
• The dashed lines are average levels of 2 Strike Prices.
Red & Green Lines:
• The Red and Green Lines will appear only after the first 1 hour.
• The levels are calculated based on the 1st 1 hour.
• Red Lines are important Resistance levels, these are strong Bearish reversal points. It is also a breakout level, this need to be figured out from the past levels, trend, percentage change and consolidation.
• Green Lines are important Support levels, these are strong Bullish reversal points. It is also a breakdown level, this need to be figured out from the past levels, trend, percentage change and consolidation.
What are the Labels?
• First Number: Price of that level.
• Numbers in (): Percentage change and Change of price from LTP(Last Traded Price) to that Level.
How to use?
Entry:
• Enter when price is closer to the Red or Green lines.
• Enter after considering previous Swing and Trend.
• Note the 50% of previous Swing.
• Enter Short when price reverse from each level.
• If 50% of swing and the pivot level is closer it can be a good entry.
Exit:
• Use the logic of Entry, each level can be a target.
• Exit when price is closer to the Red or Green lines.
Indicator Menu
Source
• Custom: Enter the price manually after choosing the Source as Custom to show the Pivots at that price.
• LTP: Pivot is calculated based on Last Traded Price.
• Day Open: Pivot is calculated based on current day opening price.
• PD Close: Pivot is calculated based on previous day closing price.
• PD HL2: Pivot is calculated based on previous day average of High and Low.
• PD HLC3: Pivot is calculated based on previous day average of High, Low and Close.
"Time (IST) (Vertical)"
• This is a marker of every 1 hour.
• Usually major price movement happen between previous day last 1 hour (2:15 pm) to today first 1 hour (10:15 pm).
• Two swings can happen between first 2 hour of current day.
• At the end of the day last 1 hour from 2.15 pm another important movement will happen.
• Usually rest of the time won't show any interesting movement.
To the Users
• Certain symbols may show the levels as a single line. For such symbols choose a different Source or Timeframe from the indicator menu.
• Please inform if any of the Symbol's price levels don't react to the pivots, include the Symbol a well.
• Also inform if you notice any wrong values, errors or abnormal behavior in the indicator.
• Feel free to suggest or adding new features and options.
General Tips
• It is good if Stock trend is same as that of NIFTY trend.
• Lots of indicators creates lots of confusion.
• Keep the chart simple and clean.
• Buy Low and Sell High.
• Master averages or 50%.
• Previous Swing High and Swing Low are crucial.

Fibonacci Pivot Points UltimateA better version of the Fibonacci Pivot Points . I added 100, 138, 161 and 200 support/resistance pivots , lookback function and now you can use daily/weekly/monthly/yearly fibonacci pivot points .

Support and Resistance Multiperiod (Zig Zag Based)Support and Resistance Multiperiod (Zig Zag Based)
What is the indicator?
• The indicator is a multi period (up to 5 lengths) Support and Resistance indicator calculated based on Zig Zag.
Who can use?
Scalpers to Long term investors
What timeframe to use?
• Any timeframe
What are the lines?
• Green lines are Support levels.
• Orange lines are Resistance levels.
How to use?
• Buy Low and Sell High.
• Brighter zones means strong Support or Resistance.
• Weaker zones appear lighter.
• Brighter zones are formed by overlapping of lines from multiple levels of support or resistance.
Indicator Menu
• The indicator can input 5 different Lengths.
• The default settings uses 13, 21, 52, 100 & 200.
• Every option are customizable.

Waddah Attar Weekly Camarilla Pivots [Loxx]Waddah Attar Weekly Camarilla Pivots is an indicator built by Ahmad Waddah Attar that draws weekly Camarilla over lower timeframes.
What are Camarilla pivots?
Camarilla Pivot Points is a math-based price action analysis tool that generates potential intraday support and resistance levels. Similar to classic pivot points, it uses the previous day's high price, low price, and closing price.
Camarilla Pivot Points is a modified version of the classic Pivot Point. Camarilla Pivot Points were introduced in 1989 by Nick Scott, a successful bond trader. The basic idea behind Camarilla Pivot Points is that price has a tendency to revert to its mean until it doesn’t. What makes it different than the classic pivot point formula is the use of Fibonacci numbers in its calculation of pivot levels. Camarilla Pivot Points is a math-based price action analysis tool that generates potential intraday support and resistance levels.
Details
-Used for intraday trading to identify support/resistance levels
-Restricted to timeframes 4 hours and below
-Unlike most versions of Weekly Camarilla Pivots, this version allows you to customize the Fibonacci levels

Pivot Points Standard Higher Timeframe█ OVERVIEW
This indicator was intended as educational purpose only and alternative way to write pine script in version 5 for Pivot Points Standard.
█ CREDITS
Credits to TradingView for original built-in source code.
█ FEATURES
Display price or percentage.
Change color for labels and lines.
█ USAGE EXAMPLES

Relative Strength Index - Divergences - LibertusHello all,
To ease everyone's trading experience I made this script which colors RSI overbought and oversold conditions and as a bonus displays bullish or bearish divergences in last 50 candles (by default, you can change it).
Script is open source, part of code is from Trading View examples. If you have suggestions or you already made some improvements, please report in comment.
Happy trading and good luck!

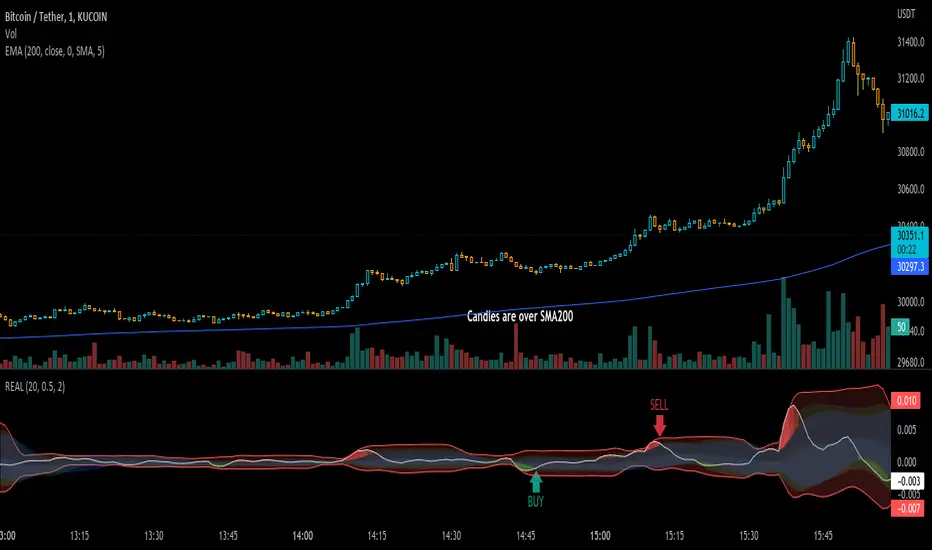
Real IndicatorReal indicator is an indicator to convert ohlcv charts to one oscilator!
there is an effective thing in all charts: "Volume", and I used this thing to mix it by price
Buy: on crossing above to Bollinger-lower-band (on Up-trends)
Sell: on crossing under Bollinger-upper-band (on Down-Trends)
use an SMA-200 to determine trends ;)