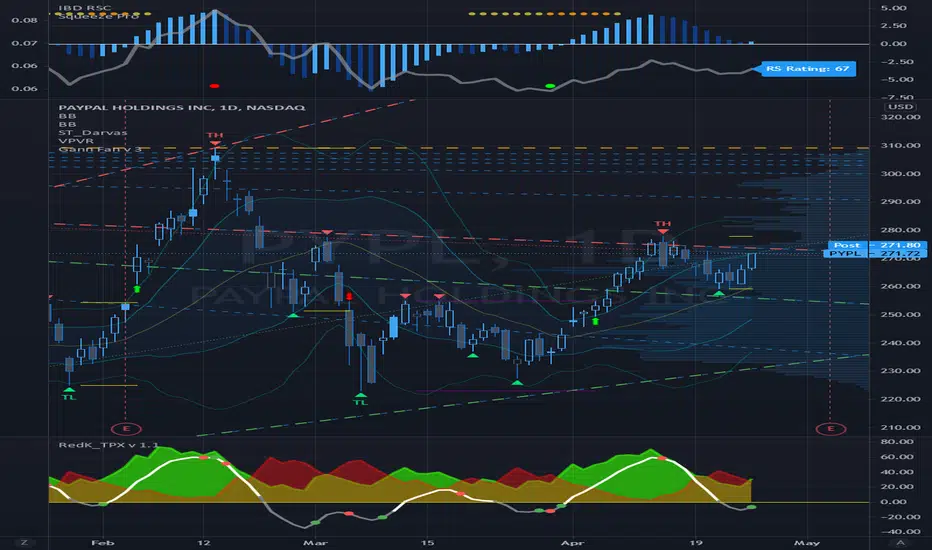
Gann Fan Analysis v 3.0The openness of this community is amazing and I have gained a lot from being a member. Hopefully you think this is useful so I can give something back.
This indicator constructs a reference framework of Support and Resistance levels based on Gann Fan ratios. Two fans are created: Support or Bullish fan, and a Resistance or Bearish fan. The origin of the analysis is the lowest pivot in the analysis window set by the length input. The upper bound of the analysis is the highest pivot in the analysis window. This is the only user input that affects the fan calculation. The remaining user input controls the visualization of the fans. The fan calculations are updated as the high and low within the analysis window change. The resistance fan range is based on an assumed 70% retracement.
Indicator also highlights the active Support and Resistance lines of each fan. An alert is also included, based on the price crossing one of these active levels.
Currently I can't figure out how to get the analysis to extend beyond 278 or so bars (not sure what the limitation is) so it isn't really useful for intraday timeframes, but it is reliable on daily and above. I use it on a Weekly view with the analysis length set to 52, and on a daily timeframe with the length set to 260.
I included fractal visualization using Ricardo Santos' Fractals v9 script as a means of confirming the Gann Fan pivots. The two methods seems to correlate well, in my opinion.
The coding is terrible, I'm sure, so please overlook that as this my first complex effort. I'm a total amateur!
Titik Pivot
Daily Pivot (Traditional)Hello all
-
This code is for daily pivot points, support and resistance with pivot labels and value.
simple code with no bugs.
this code use previous day values on online chat and current day values on offline chat.
pivot values are placed on right side, so no overlapping with other values.
.
.
Thank you Trading View for other educational script to make this possible.

Example - Switching LineExample of manipulating a float series to:
• switch from one source to another
• maintain a level by referencing itself
This script publication is intended for:
• Educational Purposes
Who is it for?
Anyone who wants to learn how to change the position or state of an active float series.

FIBS S/R IndicatorHello,
I've decided to publish a new script. The previous version of this script was removed by admins for breaking community rules.
So I present to you the Fibonacci Support / Resistance.
1. How does it work
Ratio plots
I first take the input of pivot look back and search for pivots high and low.
And then it takes a second look back to search highest high and lowest low to establish the top bottom range.
Then using the top and bottom I plot ratios provided as input. Defaults to most relevant 5 ratios I've found (Fibonacci):
Ratio 0 = 0 - can't be changed
Ratio 1 = 0.5
Ratio 2 = 0.618
Ratio 3 = 1
Ratio 4 = 1.618
Ratio 5 = 2.618
Any changes done to these ratios should be in order, otherwise conditions could get messed up. So R1 needs to the lowest and R5 the highest.
Also the same ratios are used in reverse as negative ratios.
There is a option to plot all ratios but gets really confusing for me but maybe for you it works. By default there are certain conditions set so that as we go up new resistance ratio get displayed and as we go down we see new resistance plots.
Trendlines
I've also added some automatic trendline plots with breakout warning labels based on the pivots high and low. Start and end for trendlines can be changed via inputs.
Labels can be deactivated via input. On a older version the trendlines and labels where not removed from the chart but I felt like there was to much information.
Overcooked/Undercooked
I've also added some fills and background colors that indicate if the price action is over R5 or under Negative R5 ratios. This usually indicates some "overcooking" or "undecooking".
I've notices that after "crossunder"/"crossover" top bottom ratios it goes in consolidation or it dumps. So then I plot a bgcolor to signal that.
2. How to use it
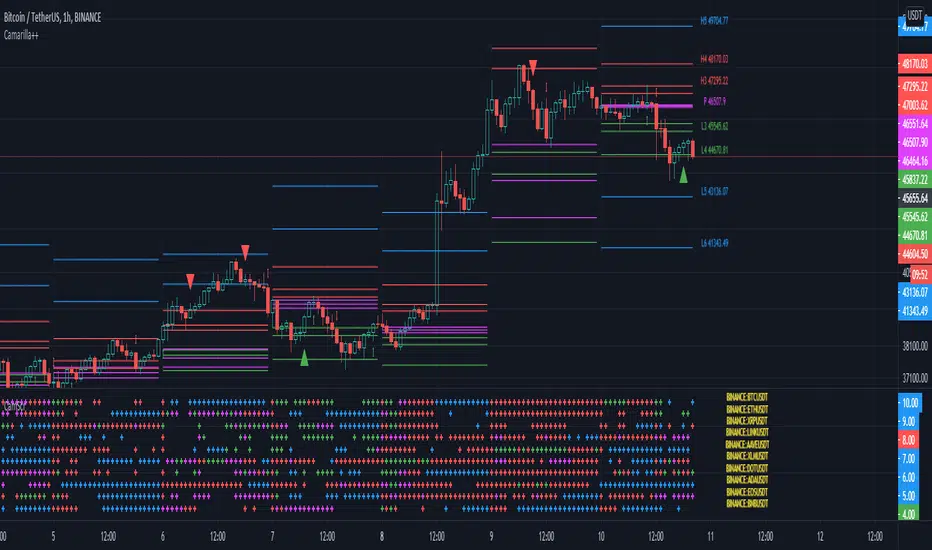
Using plot lines we can determine where we have support and resistance. I found that the best way to use the default ratios values is on the 1H chart. Very good for trading on crypto because of current situation in the market where there is a lot of new people entering the space and volatility and sentiment make swings respect the Fibonacci ratios.
3. Examples
For instance lets look at BINANCE:BTCUSDT .
On the left we see that the price action between 20 and 21 February was "overcooked". So after we got the signal that we "crossunder" the R5 the signal was triggered and we got a small red candle followed by a small dip and after that we got a small bounce and a dump.
If we also look at MF-RSI we can also see we got multiple bear divs.
Lets entertain the idea that we went short at ~57.1k as soon as we get signaled and it starts dumping.
Where does it stop ?
We can see it went all the way down to Negative R5 ratio. Normally that should signal "undercooking" but this was not triggered as it did not close under it (signaled in green).
We can also see that previous support now becomes resistance (signaled in red).
If we take a look at BINANCE:ETHUSDT , we do see that the "undercooking" was triggered here.
I will be publishing a more detailed Idea with examples of using this on the BINANCE:BTCUSDT chart in combination with Volume and other technical analysis.
Use with caution, this is not 100% signal indicator as the markets do what they want. But by using this in combination with other indicators like MF-RSI, EMAs and regular patterns we can get some targets for Support/Resistance.
I'm trying to create a strategy based on this indicator but I'm not getting very good results. Best results were on the 15 min chart with gross profits around ~50%.
Please try to play around with the inputs and let me know if you find something interesting, maybe I can incorporate new features in the indicator.
You can find the MF-RSI indicator here

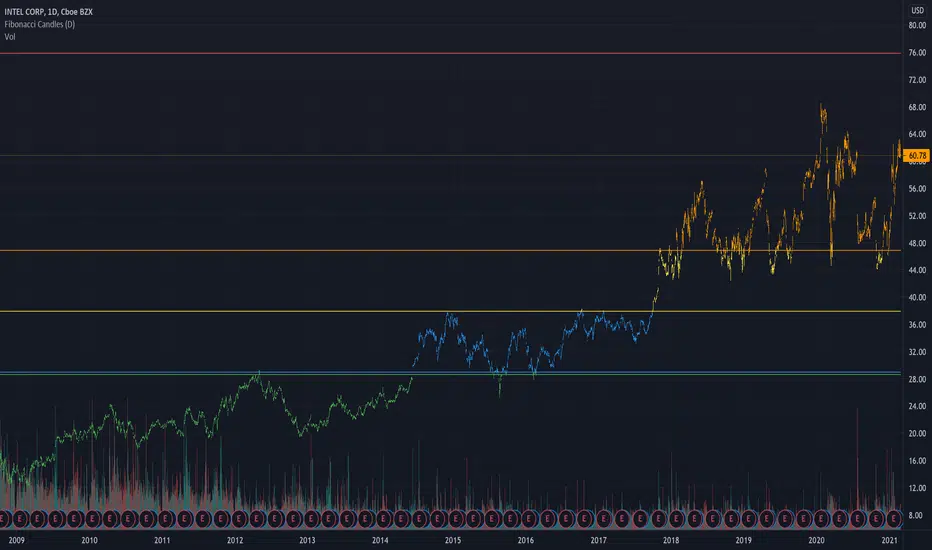
Simple Fibonacci Candles + LevelsThis is a simpler alternative to the auto-fibonacci indicators. Calculates the fibonacci levels based on the all-time high and all-time low prices. Candles are then colored based on the current closing price's relation to the 5 levels.
Donchian Channel - CustomThis is an extension to Donchian Channel - Pivot High Low indicator. Creating new version as the new type added isn't related to pivot high/low.
New type added is based on moving average. Instead of using highest and lowest of n bars, here, we are using lowest and highest of moving average of highs and lows for n bars.
Previous version of Donchian channel pivot points can be found here:

ACD - Layers 1 & 2An implementation of layers 1 & 2 of ACD strategy of Mark Fisher, based on the book "The Logical Trader".
This implementation contains:
- OR lines
- A lines
- C lines
- Daily pivot range
- N days pivot range
- Customizable trading session
Strategy summary (This implementation):
There is 3 main concepts, each of which represented as two price levels.
1) OR (Opening Range) is the range of the first bar of the day. In other words, it's just "high - low" of the first resolution (usually 15min.) bar of the day. So, OR lines (Aqua color) visualize this range for each trading session.
As stated by Mark Fisher in his book, this range is meant to be a statistically significant range such that when price breaks the range in one direction, This is UNUSUAL to infiltrate it again AND break through the other side. So we can consider it as a potential enter signal (long or short).
2) A lines (Blue color) are drawn above and below OR lines with difference of 10% 0f 10 days ATR. The ATR period and the A multiplier (usually 10%) is customizable.
3) C lines (Gray color) are drawn above and below OR lines at 15% of 10 Days ATR difference. These lines help detecting AND confirming that UNUSUAL situation.
These concepts form the layer 1, which you can spot potential opportunities with it.
There is also two ranges to show support and resistance levels based on price action of previous days. Pivot ranges are rolling ranges that calculated and last for each day separately. They only differ in calculation period - the first one is daily (yellow color area) and the other one (red color area) is customizable, but is usually 3 or 5 days.
Each range consists of two price levels, valid for the current trading session. One of theme is HL2 , and the other one is "HLC3 + abs(HLC3 - HL2 )".
These two ranges, "Daily pivot range" and "N days pivot range", form the layer 2, which you can see them as two dynamic support/resistance ranges - one for daily, and the other for N days. They help filtering opportunities spotted from layer 1.
There is 2 more layers in the ACD strategy, which is omitted in this free implementation.

NSDT Daily Key LevelsSimple script to show key levels of current day and previous day. Labels can be turned on and off as needed. Line colors, thickness and style can be changed. Modified the "M/W/D Level" script from paaax. Credit for original code goes to him. Link to script and profile posted in code of this script.

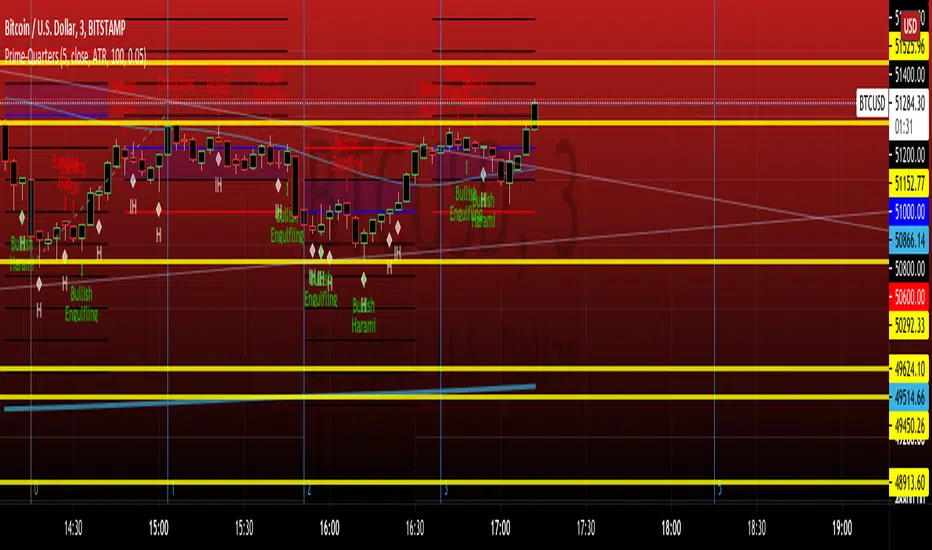
PRIME-QUARTERS W-XsThis script applies both the Quaters theory for easy analysis of market structure, as well as a 50 and 800 SMA to be used in conjunction with the 4 and 21 SMA found in Prime-Pulse, to pin point sniper entries. $auceCamp
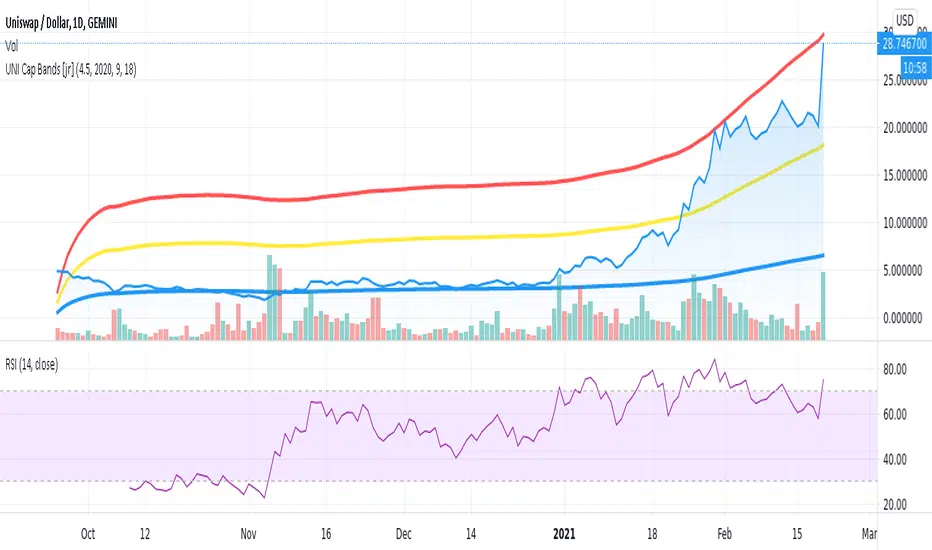
UNI Top Cap [jcray]Top cap indicator for UNI, the Uniswap Protocol token. Modified from BTC Top Cap by aamonkey

Camarilla screenerBasic script to screen up to 10 tickers with regards to their central pivot range and camarilla pivots.
Same color layout as the Danarilla script ().
The colors in the screener mean the following:
Blue : bar close price is > H4 or < L4
Red : bar close price is < H3 and > CPR top
Fuchsia : bar close price is < CPR top and > CPR bottom
Green : bar close price is < CPR bottom and > L3
No color means it is between H4/H3 or L3/L4
Resolution can be changed for the calculation of the pivots.
Script contains snippets from other screeners and the Danarilla script so many thanks to all who publish their scripts.
ETH Top Cap [jamesray]This script is modified from Top Cap , as published here.
Historically it matches market tops for ETH

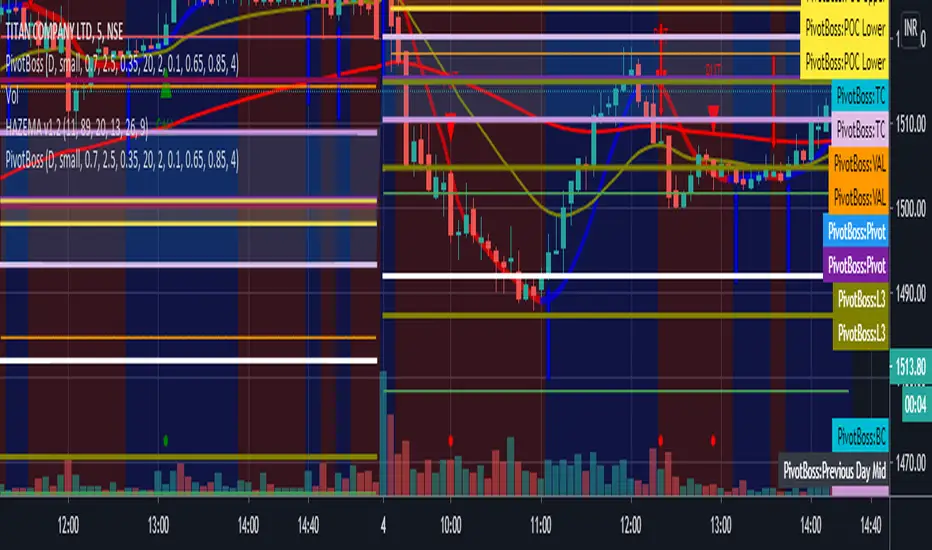
Floor Pivots With CPR and Camarilla 3 LevelsThis script plots floor pivots with the central pivot range and camarilla R3/S3 pivots, to spot with ease the Golden Pivot Zone (GPZ). As described in the book *Secret of a pivot Boss* by Franklin Ochoa, the Golden Pivot Zone occurs when R3 or S3 pivot from the Camarilla Equation or from lies within the central pivot range. This combination can be simply profitable.
A bearish GPZ occurs when R3 of the Camarilla Equation is mixed within the central pivot range, therefore we should look for sells in that zone.
A bullish GPZ occurs when S3 of the Camarilla Equation is mixed within the central pivot range, therefore we should look for buys in that zone.
Here are some examples on Gold
Good luck !
Ps* i got part of the code from @cristian.d script

All in one pivot by AkhileshCamarilla Trade Setup:
Sell Opportunity:
H3 Reversal Trade
Entry - H3
Stop Loss - H4
Target - L3
L4 Breakout Trade
Entry - L4
Stop Loss - L3
Target - L5
Buy Opportunity:
L3 Reversal Trade
Entry - L3
Stop Loss - L4
Target - H3
H4 Breakout Trade
Entry - H4
Stop Loss - H3
Target - H5
Trade Type:
Scalping trading
Intraday trading
CPR Trade Setup:
1. Narrow CPR indicates Trending market
2. Wide CPR indicates Sideways market
Volume-Supported Linear Regression TrendHello Traders,
Linear Regression gives us some abilities to calculate the trend and if we combine it with volume then we may get very good results. Because if there is no volume support at up/downtrends then the trend may have a reversal soon. we also need to check the trend in different periods. With all this info, I developed Volume-Supported Linear Regression Trend script. The script checks linear regression of price and volume and then calculates trend direction and strength.
You have option to set Source, Short-Term Period and Long-Term Period. you can set them as you wish.
By default:
Close is used as "Source"
Short-Term Period is 20
Long-Term Period is 50
in following screenshot I tried to explain short term trend (for uptrend). Volume supports the trend? any volume pressure on trend? possible reversal? same idea while there is downtrend.
in following screenshot I tried to explain long term trend:
You can also check Positive/Negative Divergences to figure out possible reversals (to automate it, you can use Divergence for Many Indicators v4 , it has ability to check divergences on external indicators)
Enjoy!

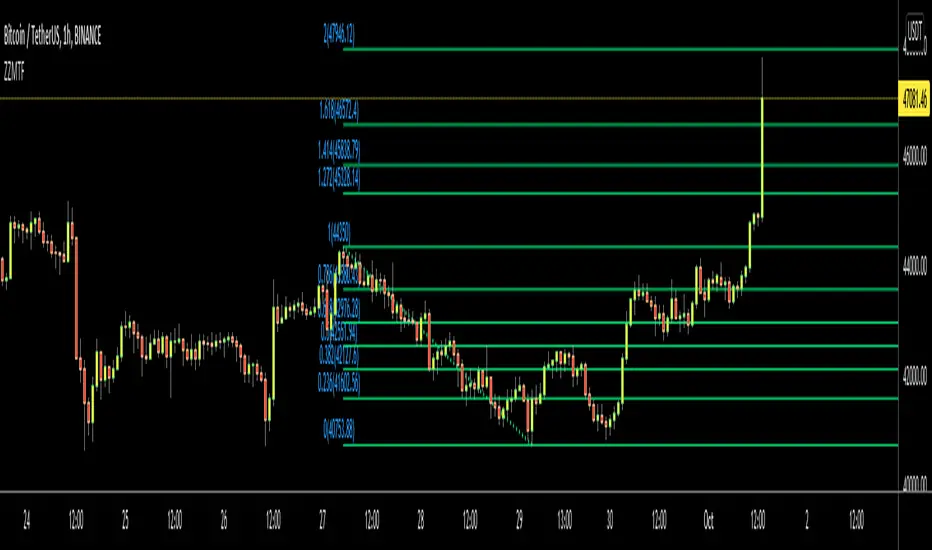
ZigZag Multi Time Frame with Fibonacci RetracementHello Traders,
This is ZigZag Multi Time Frame with Fibonacci Retracement script. It calculates the ZigZag using Higher Time Frame, draw Fibonacci Retracement lines and put labels accordingly. I already published Zigzag with Fibonacci Levels script but this one is Multi Time Frame and I didn't want to change/update it.
You can set ZigZag Period and Resolution as you wish. Zigzag is calculated using higher time frames (ex: 1day) so you better choose small numbers as Zigzag Period, such 2, 3 etc. you should choose higher time frame wisely, meaning that you should not set 1Day while chart resolution is 1min ;)
It draws Fibonacci levels between 0%-100% and If the price goes higher/lower than 100% level than the script draws Fibonacci Levels accordingly. This means it draws Fibonacci levels until this levels get higher/lower than the price.
"Show Zig Zag" is not enabled by default, you can enable it if you want to see ZigZag as well.
You have options to set Text Color, Line Color, Zigzag Up Color and Zigzag Down Color.
You can set the location of the Fibonnaci Levels -> Left or Right
You also have option to enable/disable following Fibonnaci Levels:
---> 0.236
---> 0.382
---> 0.500
---> 0.618
---> 0.786
I added "Colorful Fibonacci Levels" for fun. if you enable it then Fibonacci line colors will be different randomly on each move, see it for yourself :)
Some Screenshots:
if you enable "Show Zigzag Option":
how the script adjust levels automatically:
if you set Label Location as "Right":
if you enable "Colorful Fibonacci Levels" then Line colors will be changed on each move randomly ;)
Enjoy!
Intraday Multi timeframe CPRDue to the request of some users and inspired by "Intraday CPR " I updated "CPR for Intraday Trading " and added extra functionality for your convenience.
Intraday CPR levels are changed according to timeframe instead of previous day high, low and close
This indicator you can change timeframe : Week ,Day, 240 min ,180in, 120 min, 60 min
code credit : ThePivotTrader

Wick Stop ZonesCount how many wicks bottom out in each price zone. Specify the following inputs.
Lookback: How far back from the latest candle to look for wick intersects.
Zone Size: The price range size for zone. Wicks tips that fall into each zone will be counted.
Minimum Intersects: Specifies how many wick tips must intersect with the zone before the zone is allowed to plot.

Beacon - Anthony Crudele's IndicatorBeacon uses the current volatility of the market based on your trading time frame to determine support and resistance levels, whether a trend is intact or ready to revert back in the range. One of the most difficult things I went through as a trader was determining whether we are in a trend day or if we are in grind up or grind down mode. I created Beacon to give me a simple look at the market to determine what type of environment we are in. I use Bollinger Bands (3 standard deviation) to determine the volatility cycle. Once the BB make peaks I took my Fibonacci Retracement tool and did a retracement from the peak high of the BB to the peak low. I use 70%, 50% and 30% for my support and resistance levels. I use those levels because I tested pretty much every percent level and those percentages averaged the highest performance on all tick charts and time charts. You can use Beacon on whatever time frame or tick chart you are trading on and it will determine that specific volatility cycle.

Nick Rypock Trailing Reverse (NRTR)This indicator was invented in 2001 by Konstantin Kopyrkin. The name "Nick Rypock" is derived from his surname reading in the opposite direction:
Kopyrkin -> Kopyr Kin -> Kin Kopyr -> Nik Rypok
The idea of the indicator is similar to the Chandelier Exit, but doesn't involve ATR component and uses a percentage instead.
A dynamic price channel is used to calculate the NRTR. The calculations involve only those prices that are included in the current trend and exclude the extremes related to the previous trend. The indicator is always at the same distance (in percent) from the extremes reached by prices (below the maximum peak for the current uptrend, above the minimum bottom for the current downtrend).

[JRL] Pivot Regression OscillatorIntroducing the Pivot Regression Oscillator. This oscillator uses a similar formula to the Stochastic Oscillator. However, instead of comparing the closing price to the lowest price of a period, it compares the distance between current price and the current pivot point. By basing our oscillator on pivot levels, we incorporate a much more relevant and consequential price point around which to base our comparisons.
The indicator can give reliable overbought and oversold signals, and it plots two exponential moving averages as output, which provides crossover signals that can be used to help time trades.
The Pivot Regression Oscillator can be effective for timing re-entries into a trend and seems to be able to avoid some of the false signals of other indicators.
Let me know if you find this useful. Cheers!
