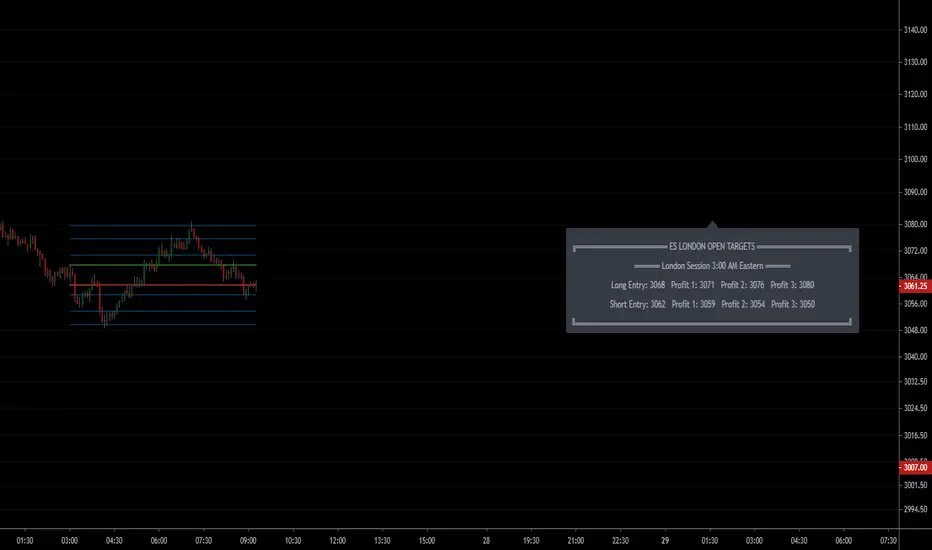
NSDT ES London Open TargetsThis indicator provides potential entries and targets (both long and short) for the ES/MES London session. It creates potential target lines on the chart as well as a gray box with the potential levels in text format. Both options can be turned on or off at the discretion of the trader. You may need to adjust the chart width so the box shows on the screen. It's position is adjustable.
The lines and the text box are updated after the first 1 MINUTE bar closes for London session. The London session open is defined as 3:00AM - 3:01AM, Eastern time.
Place the chart on a 1 MIN time interval for best results. You can change the chart timeframe after the 1st min bar closes and the data is updated.
To get access to this indicator, use the link in the profile signature or private message us here in Tradingview.
Titik Pivot
NSDT NQ London Open TargetsThis indicator provides potential entries and targets (both long and short) for the NQ/MNQ London session. It creates potential target lines on the chart as well as a gray box with the potential levels in text format. Both options can be turned on or off at the discretion of the trader. You may need to adjust the chart width so the box shows on the screen. It's position is adjustable.
The lines and the text box are updated after the first 1 MINUTE bar closes for London session. The London session open is defined as 3:00AM - 3:01AM, Eastern time.
Place the chart on a 1 MIN time interval for best results. You can change the chart timeframe after the 1st min bar closes and the data is updated.
To get access to this indicator, use the link in the profile signature or private message us here in Tradingview.

NSDT ES Asia Open TargetsThis indicator provides potential entries and targets (both long and short) for the ES/MES Asian session. It creates potential target lines on the chart as well as a gray box with the potential levels in text format. Both options can be turned on or off at the discretion of the trader. You may need to adjust the chart width so the box shows on the screen. It's position is adjustable.
The lines and the text box are updated after the first 1 MINUTE bar closes for Asian session. The Asian session open is defined as 6:00PM - 6:01PM, Eastern time.
Place the chart on a 1 MIN time interval for best results. You can change the chart timeframe after the 1st min bar closes and the data is updated.
To get access to this indicator, use the link in the profile signature or private message us here in Tradingview.

NSDT NQ Asia Open TargetsThis indicator provides potential entries and targets (both long and short) for the NQ/MNQ Asian session. It creates potential target lines on the chart as well as a gray box with the potential levels in text format. Both options can be turned on or off at the discretion of the trader. You may need to adjust the chart width so the box shows on the screen. It's position is adjustable.
The lines and the text box are updated after the first 1 MINUTE bar closes for Asian session. The Asian session open is defined as 6:00PM - 6:01PM, Eastern time.
Place the chart on a 1 MIN time interval for best results. You can change the chart timeframe after the 1st min bar closes and the data is updated.
To get access to this indicator, use the link in the profile signature or private message us here in Tradingview.

Monthly Weekly Daily Pivot Points StandardShow the monthly weekly and daily pivot points all at once , suitable for daytrading
price Degree on gann master chartThis indicator calculates price degree on gann' s master chart. it will plot degree of open (red stepline), close(green stepline), high(white cross), low(red cross).
I request, only people who know how to use gann master chart and degrees of price use this. no one made this indicator till now. It is highly potential tool for gann gann fans.
happy trading!
comment if you like.
Pivot Points with Monthly and Weekly optionsA pivot point indicator that has possibility to see even the monthly or the weekly pivot points .
Pivot points are very powerful if used in correct way.
most of the time the price can be rejected from the pivot point or if the price break it it will be a nice entry if retest the pivot
R2/S2 are a very strong pivots to break but of course you need a certain distance between the pivot

RVC-Trade-With-Pivot-LevelsHow to Use PIVOT Levels for Trading
Always remember ->: *Trade with trend*
About script:
1. Daily and Weekly close above Pivot Level.
-- Sentiment is highly positive. Pivot Level acts as strong support.
2. Daily Close above Pivot and Weekly Close Below Pivot
-- Sentiment is positive.Weekly Pivot Level may act as strong resistance.
3. Daily close below Pivot and weekly close above Pivot
-- Sentiment is negative but weekly Pivot Level can acts as strong support.
4. Daily and Weekly Close below Pivot Level
-- Sentiment is highly Negative. Pivot Level acts as strong resistance.
BUY/SELL -- ENTRY
BUY ABOVE 23.6% UPWARD
IF Trend is positive and price cross and sustains above 23.6%(R1) upside, then it will be entry from BUY perspective.
If R1 is entry, R2/R3/R4/R5 ... will be targets.
SELL Below 23.6% Downward
IF Trend is negative and price cross and sustains below 23.6%(S1) downside, then it will be entry from SELL perspective.
If S1 is Sell side entry, S2/S3/S4/S5 will be targets.
Before taking ENTRY on BUY or SELL Side, please know your risk levels, Stop Loss and trade EXECUTION process.
Finally:
My view is my view and remains with me only. Once you accept it and trade it, it becomes your view. So credit or blame all yours.:)

Montly Pivot Points indicatorA pivot point indicator that has possibility to see even the monthly or the weekly pivot points.
Pivot points are very powerful if used in correct way.
most of the time the price can be rejected from the pivot point or if the price break it it will be a nice entry if retest the pivot
R2/S2 are a very strong pivots to break but of course you need a certain distance between the pivot.

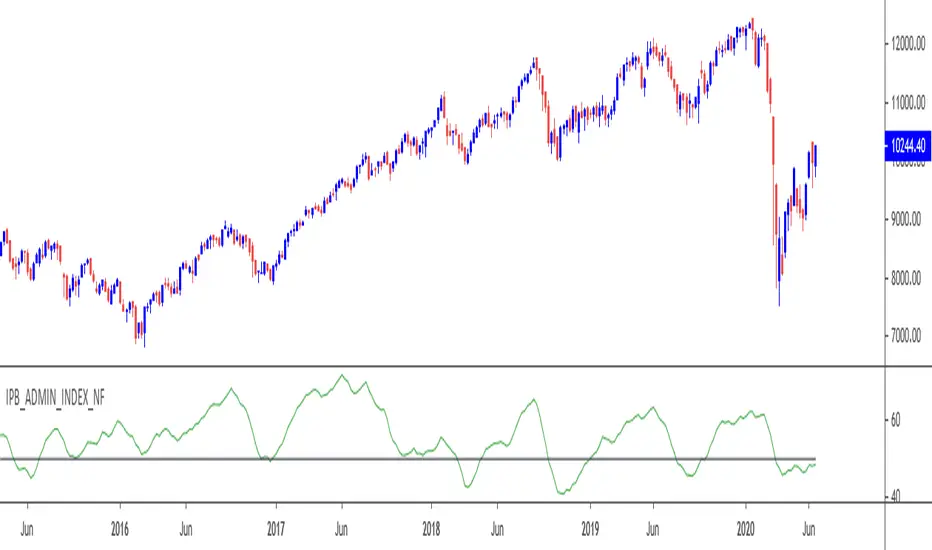
IndianPivotBoss_ADMIN_NIFTYThis is the Advance Decline Momentum Index for Top 18 stocks of Nifty 50 index.
This is similar to the ADMIN index for Bank Nifty Stocks that is already available for public use.
Top 18 stocks of Nifty contributes more than 70% of Nifty's movement.
The index has the following options :
1) Admin line (shorter momentum ) : By default this is enabled. If it crosses above 50, it indicates upward momentum with stock participation. If it crosses below 50 it indicates downward momentum. Divergence of this indicator Vs price is an excellent advance clue for a possible reversal.
2) Admin line (longer momentum) : This is to be used with respect to S.No. 1. If shorter momentum crosses longer momentum upside, it is an indication of stronger momentum and vice versa.
3) Admin MACD : Upward sloping indicates stronger momentum and downward sloping of histogram lines indicate weaker momentum. Divergence Vs price is an excellent advance clue for a possible reversal.
4) Advance decline line : This is the actual cumulative advance decline line.
5) Advance decline line 200 ema : This is the 200 ema of the advance decline line.
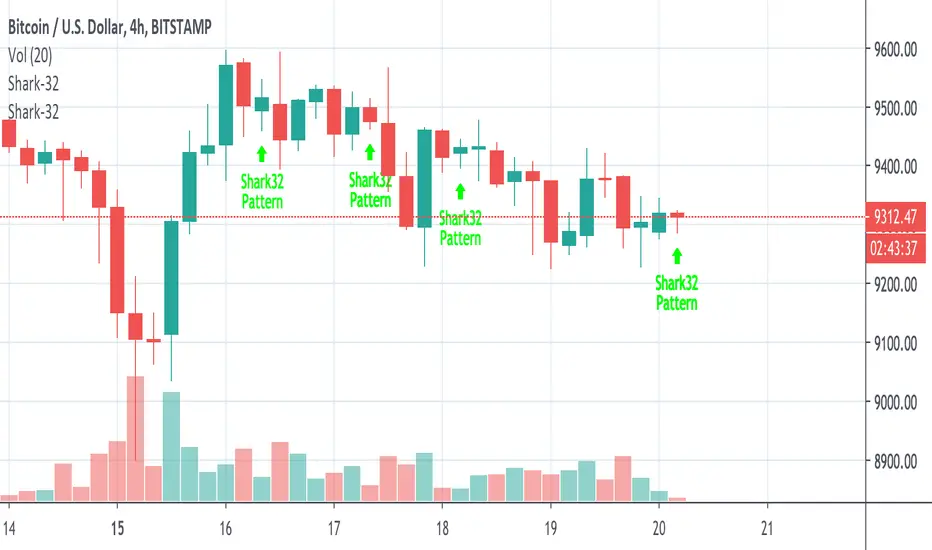
Shark-32 Pattern for Candle sticks AnalysisThis script is the perfect strategy for the all mighty shark-32 pattern.
It shows the power tussle between demand and supply before either of them finally gives up.
Smoothed Pivot Reversal Alerts [QuantNomad]This is study with alerts for my "Smoothed Pivot Reversal Strategy". Strategy script is open to the public so you can use it freely.
When creating alerts - choose "Once Per Bar Close"
It's a pro indicator, you can have access to it for a small fee. Link to my PRO indicators you can find in my signature.

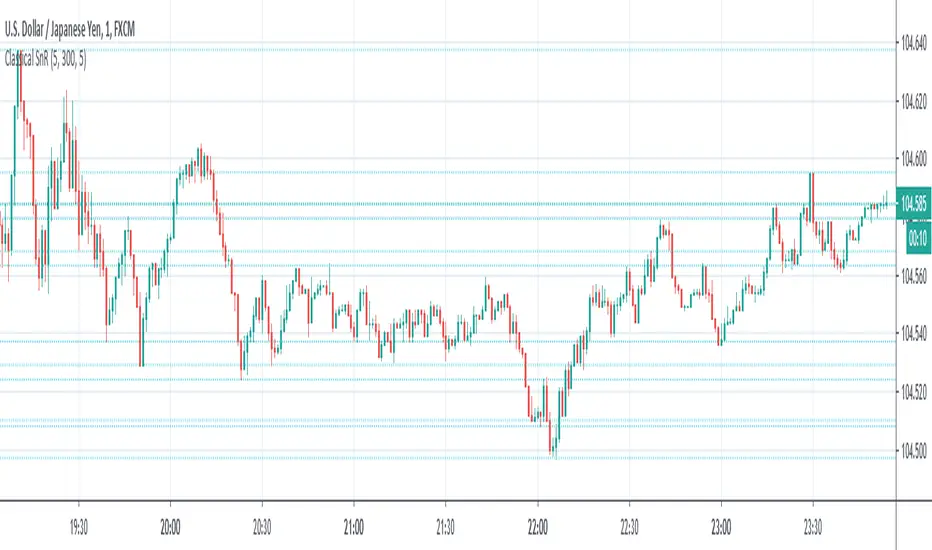
Classical Supports & ResistancesThis indicator shows classical resistance and support levels which retraced the chart lately. Notice that the condensed lines laying close together are showing an area of support and/or resistance.
But after all, it was a tedious work creating this indicator because like I've already said, pine script is a very odd and weak language which does not have many ordinary features like useful loops, simple line drawing and even reasonable variable casting!
So I was forced to use its built-in pivothigh() and pivotlow() functions without any handy documentation. I assume that even these functions don't work as expected, and because of that, I embedded "Sensitivity" and "Lookback Time" options in the indicator as a workaround.
Feel free to use it and send me your comments/solutions.
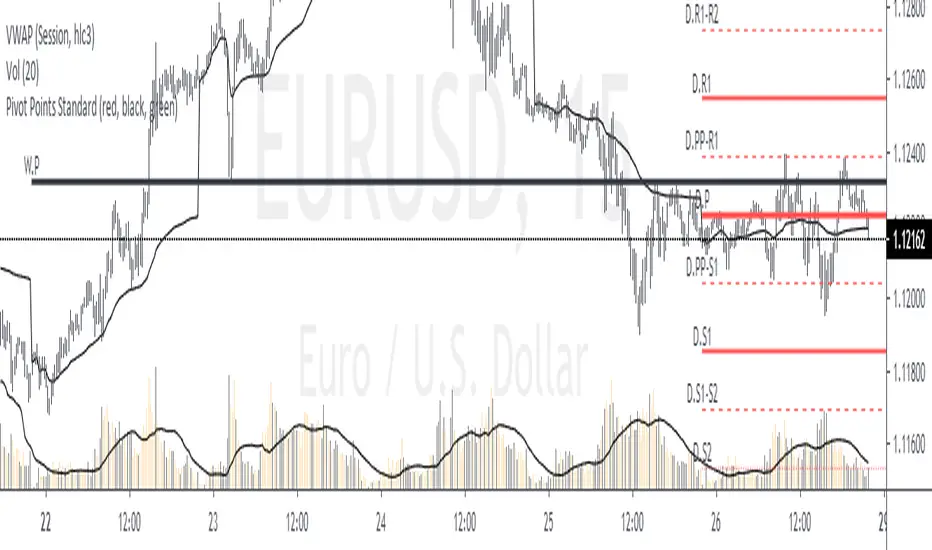
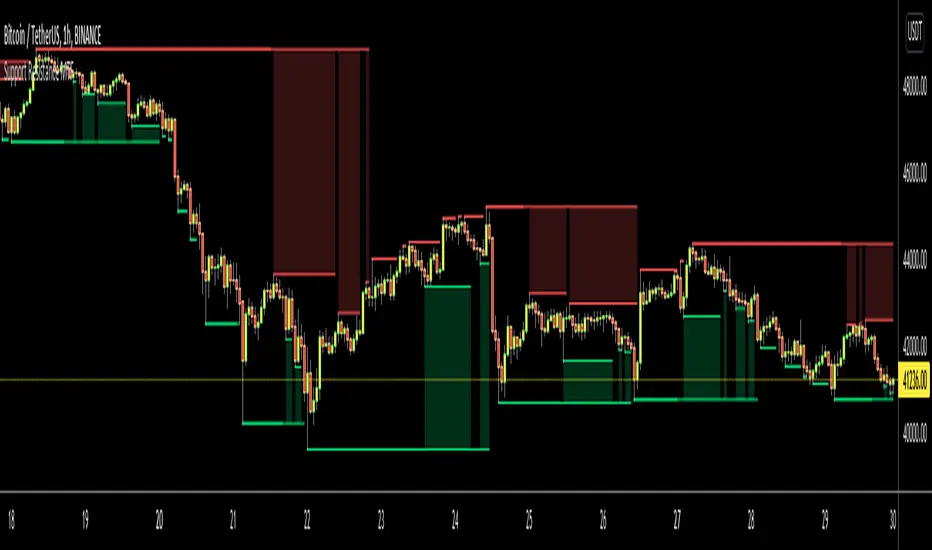
Support Resistance MTFHello Traders,
This is Support Resistance script that uses Multi Time Frame. While getting Close/Open/High/Low values of Higher Time Frames the script does NOT use Security function , instead it calculates them.
while choosing Higher Time Frame, you can use "Auto" option so it uses predefined Higher Time Frames, or you can choose the Higher Time Frame Manually from the list. options for HTF => 15mins, 30mins, 60mins, 120mins, 180mins, 240mins, 720mins, Day, Week, 2 Weeks, Months, 3 Months, 6 Months, 12 Months.
You have option to use High/Low or Close/Open values while calculating support resistance levels.
"Period for Highest/Lowest Bars" option is used as loopback period to check if it's Highest/lowest bars. smaller numbers = more sensitive result.
You have option for transparency and coloring of support/resistance levels/zone => Red, Lime, Blue, White, Black, Olive, Gray
An example for 15 min chart, 4hours selected as HTF
You can set transparency and colors as you wish:
You can choose Close/Open prices while calculating S/R levels instead of High/Low
Enjoy!
Floor Pivots_DWMBasic Pivot points.
Script is easy to modify to personal requirements, and explained step-by-step on Kodify.com.
Original script credits: Kodify.com (kodify.net)

Gann BreakoutEverything here is for educational purpose. Kindly trade at your own risk.
• This indicator is based on Gann level .
• It is used only for intraday trading in Banknifty .
• Prefer Time frame would be 5mins/10mins/15mins. according to your risk ratio.
• Trade after 9:40am let market gets settle.
• Look for the breakout of the Green(for buy entry) and Red(for sell entry) line for entry.
• Price action also required as targets are more than 100 points. Set your targets and trade on breakout.
You will notice that candles are retracing on the targets line because those targets are gann imp levels.
So if target 1 breaks you can trail your SL till next target.
Trade safe !!
thank you for using the indicator.
Any more ideas to make this indicator more powerful please let me know.
Suggestion are always welcome !!!

Next Support and ResistanceSupport and Resistance lines are generated from recent pivot points and shown only when the price gets close to them.

Time Frame Highs & LowsScript plots the previous n highs & lows of current time frame and an information label with key higher time frame levels.
Additional info about the script behaviour:
n/a

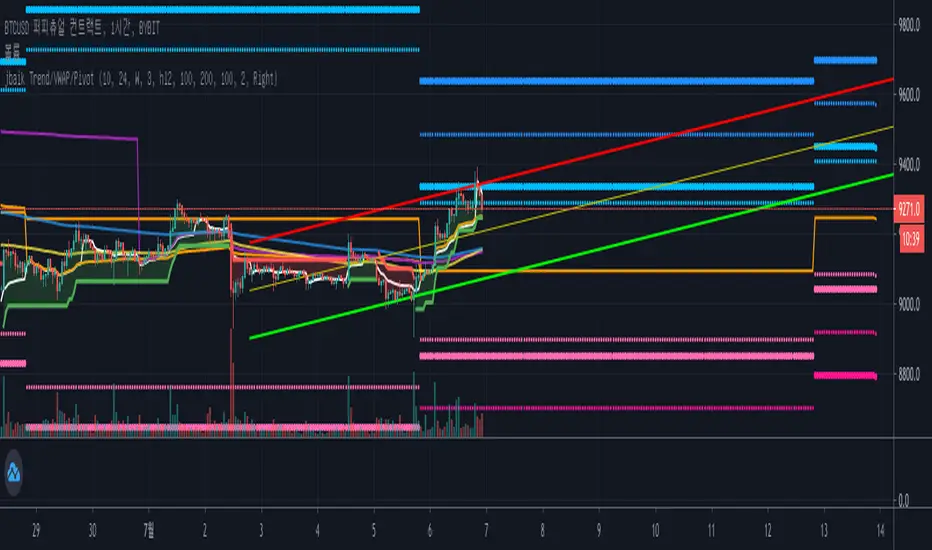
jbaik Trend/VWAP/PivotDraws SuperTrend/VWAP/Pivot
Sends "L" signal when :
RSI oversold and close higher than previous bar OR bar breaks highest value of period with higher volume than previous bar
Sends "S" signal when :
RSI overbought and close lower than previous bar OR bar breaks lowest value of period with higher volume than previous bar
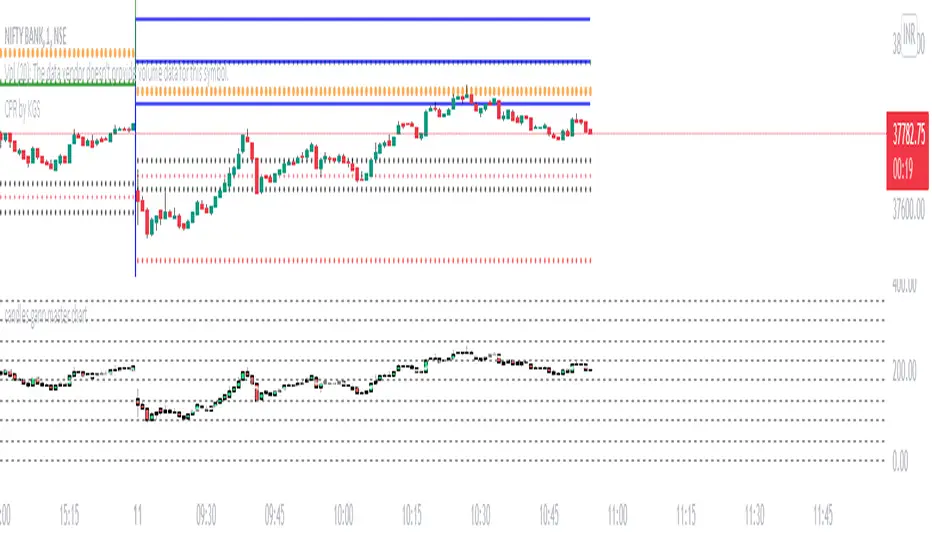
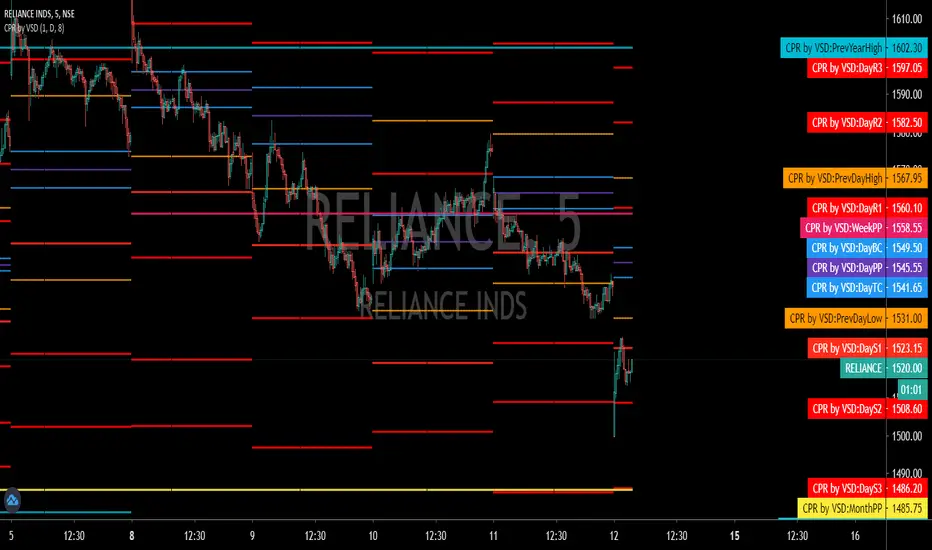
CPR - VSD_TamizhTrader DAY/WEEK/MONTH/YEAR1. CPR FOR DAY/WEEK/MONTH/YEAR HAS BEEN CODED
2. IT HAS OFFSET FOR TOMORROW CPR LEVELS (HAS TO BE ADJUSTED IN INDICATOR SETTINGS DEPENDING ON TIME FRAME)
3. UNIQUE AS I DID NOT FIND A CPR FOR ALL TIME FRAMES
4. USEFUL FOR BEGINNERS
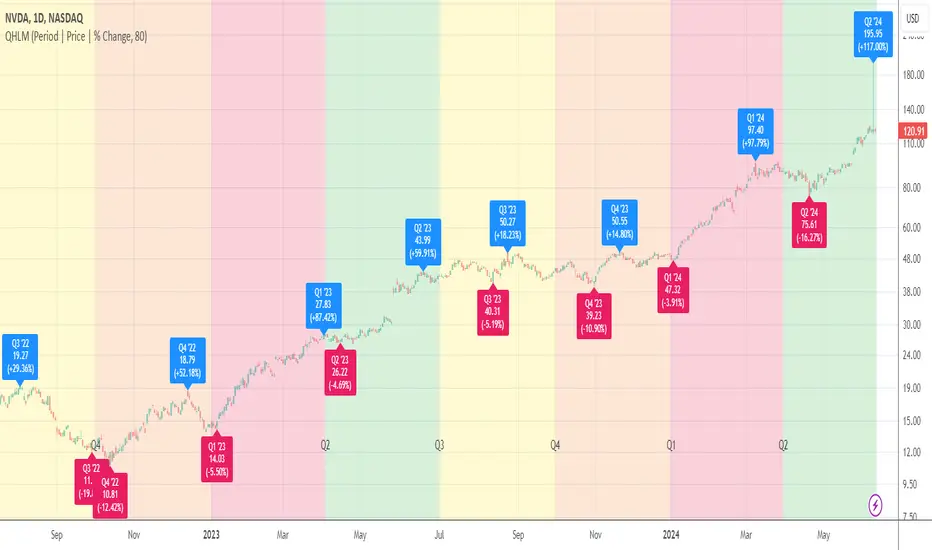
Quarterly High/Low MarksThis utility tool marks the highest and the lowest price of each quarter on the chart. Works everywhere and doesn't use any calls of built-in functions which are used for a data extraction.
Labels provide additional information about closing price and % change for a particular quarter and allow micro customizations.
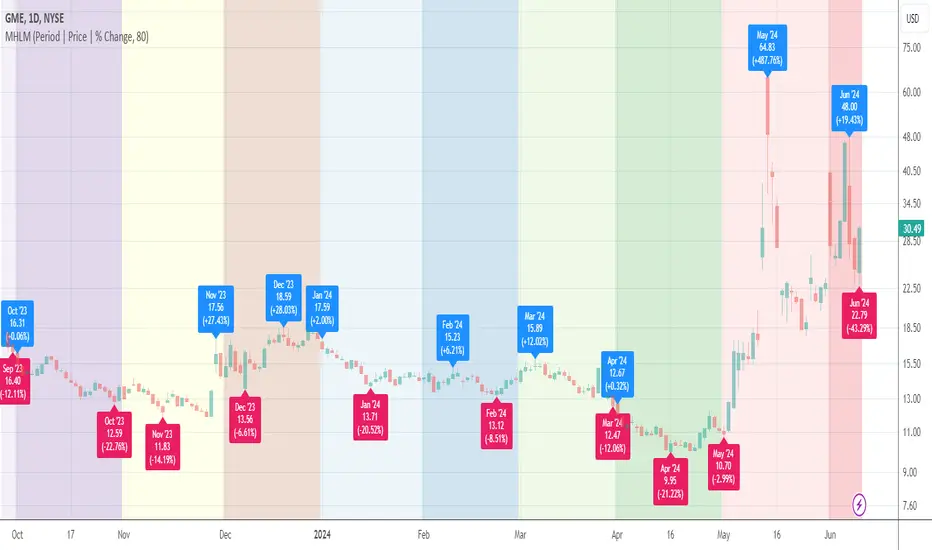
Monthly High/Low MarksThis utility tool marks the highest and the lowest price of each month on the chart. Works everywhere and doesn't use any calls of built-in functions which are used for a data extraction.
Labels provide additional information about closing price and % change for a particular month and allow micro customizations.
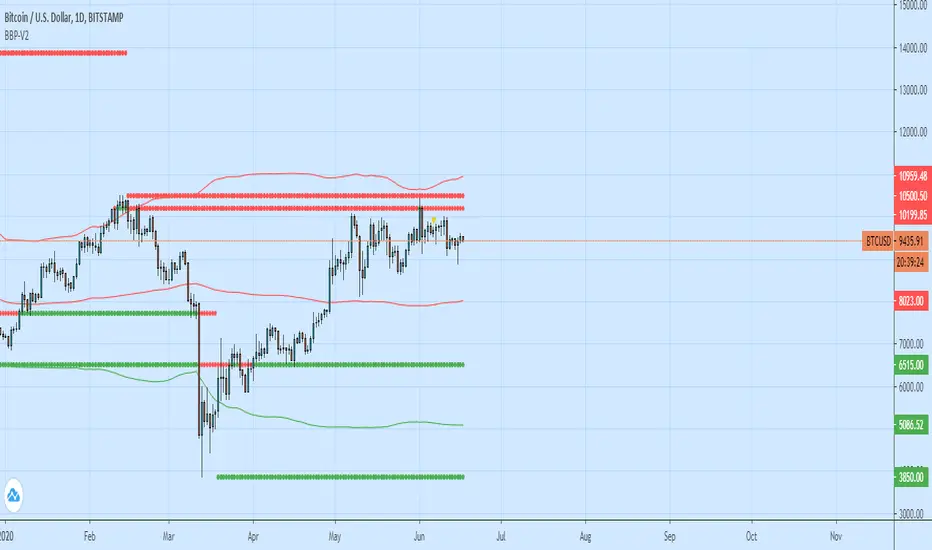
Bollinger Bands + Pivots - V2It drawes a higest or lowest pivot when price intersects with bollinger bands.