OHLC - Hourly, Daily,Weekly,Monthly with LabelsOpen, High, Low , close with Labels -- These are professional levels to watch out for active trading
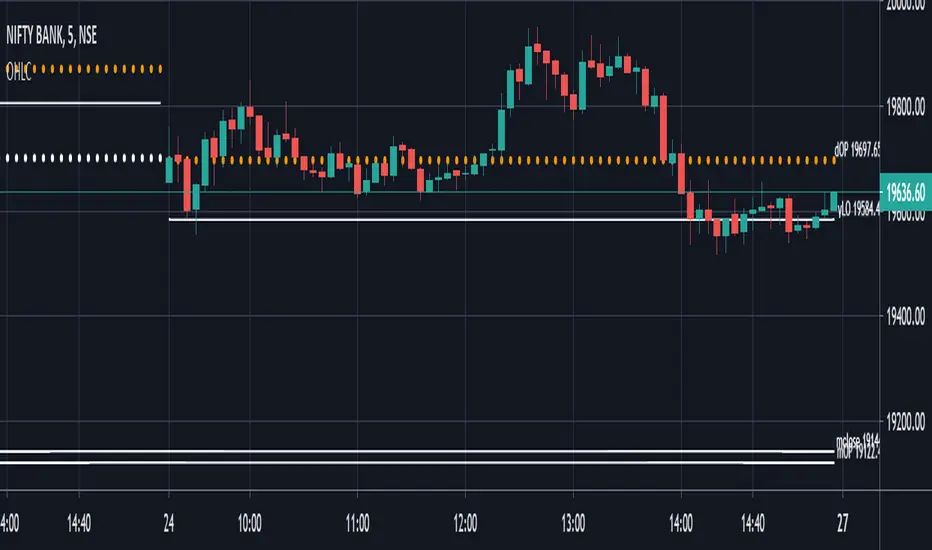
dOP - Day open price
yCL - Yesterday's close Price
yHI - Yesterday's High Price
yLO -- Yesterday's Low Price
Titik Pivot
ADR price targets with alert options- UltimateADR based price targets with option to hide past levels..
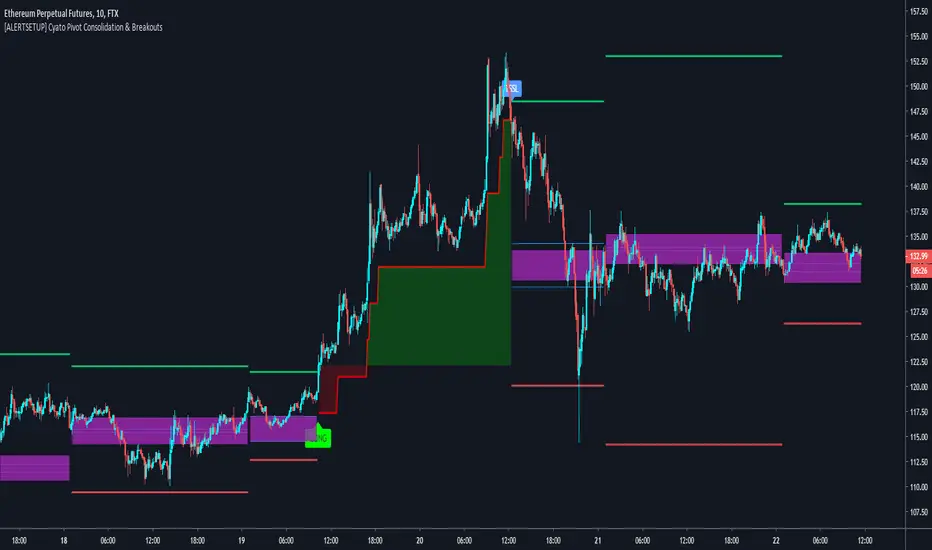
Cyatophilum Pivot Consolidation & Breakouts [ALERTSETUP]Intraday Strategy built on Pivot Points Standard and Pivot Range.
The idea is to wait for a consolidation period AND a breakout. This really strong condition allows to set a 1/1 Risk/Reward ratio.
Starting from there we secure the profits with a Trailing Stop loss and/or Take Profit system integrated in the script.
This is the Alert version and you can see the backtest results below. Default settings work great on the 15m chart.
You can change the timeframe of the pivot points as well as the consolidation band in the settings. The SL/TP system is also configurable. This script includes a DCA feature.
To get the indicator, please use the link below, thanks!
Rounded Bluebox Zones - Bitcoin BeatsThis script is a combination of my Rounded Pitchforks script and an automatic support and resistance detector.
The goal of this script is to give the future supports and resistances in order to help guide your entries and exits in trades.
Both the curved and straight blueboxes indicate areas of confluence.
This means putting stoplosses and take profits in these areas can be a valid strategy.
This can be used on all timeframes.
ALL LINES AND BOXES CAN BE REMOVED IN THE SETTINGS.
So if you only want the curved pitchforks or only want to show a specific range, you can do as you wish.
For assets different from BTC, you will have to adjust the fully customisable settings.
TRADE AT YOUR OWN RISK

Weekly Pivot Points with Colored Mid Pivots from HalcyonUpdated version of the Weekly Pivots Points that include mid pivot lines.
Target trading zones for the week are shaded green and red respectively. The mid pivot area is shaded aqua.
Use: buy (green) zones are buys, red zones are sells with respective color targets.

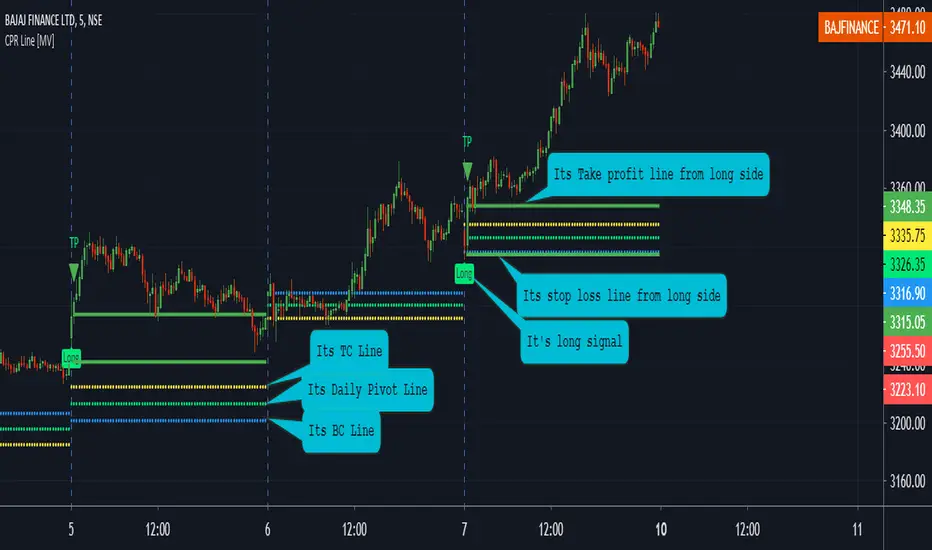
CPR Line [MV]Hello, Everyone, This is Indicator Base on CPR
Indicator Feature
Here is Long and Short plot with Alerts
Here is Takeprofit Line from Long and Short side by default 1 percentage Calculated by Open Bar
Here is Stoploss Line from Long and Short side by default 0.5 percentage Calculated by Open Bar
NOTE: If You are Using CPR Strategy there is some Limitation We are Calculated Close bar price and according to SL OR TP Calculate plot
But if you are Using Indicator by default it's Calculate SL or TP Accounting to Open bar but you can Also Change if you want same result CPR Strategy or CPR Indicator.
You Can also change everything.
In future, I will Enhance this Strategy and indicator
if you have any suggestion Mention here
Thank you so much
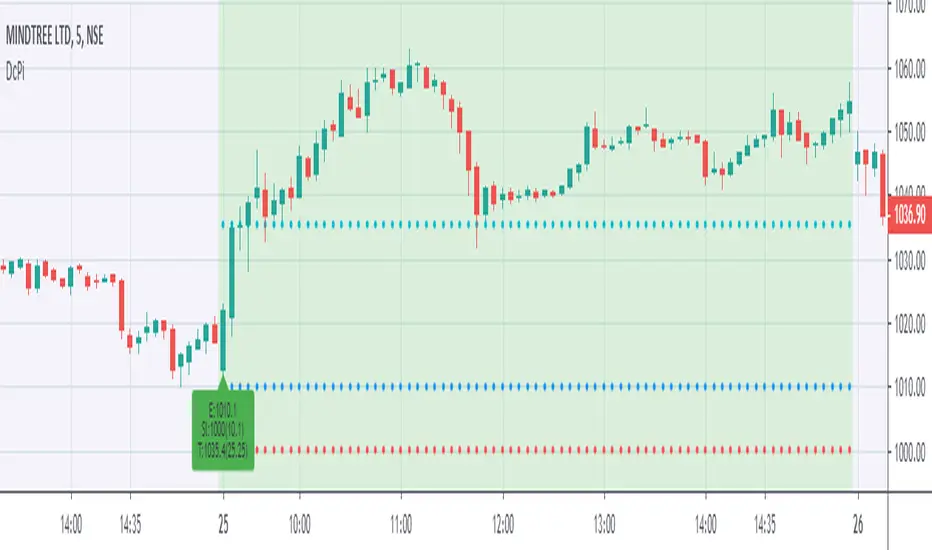
DcPi for intraday tradesDcPi stands for dark cloud and piercing , This is a very reliable pattern for intraday trades.
Precondition-
Whenever a big move is followed by gap(up/down) open next day.
Trade Setup-
Wait for price to enter in previous day range.
Aggressive traders can enter trade as soon as price enters previous day range, safe traders can wait for 1st 5 minute candle close, target can be mid of previous day range.
Trailing stoploss is a good way to secure your profits.
How this indicator helps?
Whenever intraday range will be more than 5% move, chart background will turn light blue, one might add stock to watchlist for next day.
if next day is gap open, chart background will be light green, and a textbox will be displayed with entry, stoploss and targets. One might take trades as explained in trade setup.
How it is dark cloud and piercing pattern?
Green candle followed by gap up open next day and closing in previous day range is Dark cloud on daily timeframe.
Red candle followed by gap down open next day and closing in previous day range is piercing pattern on daily timeframe.
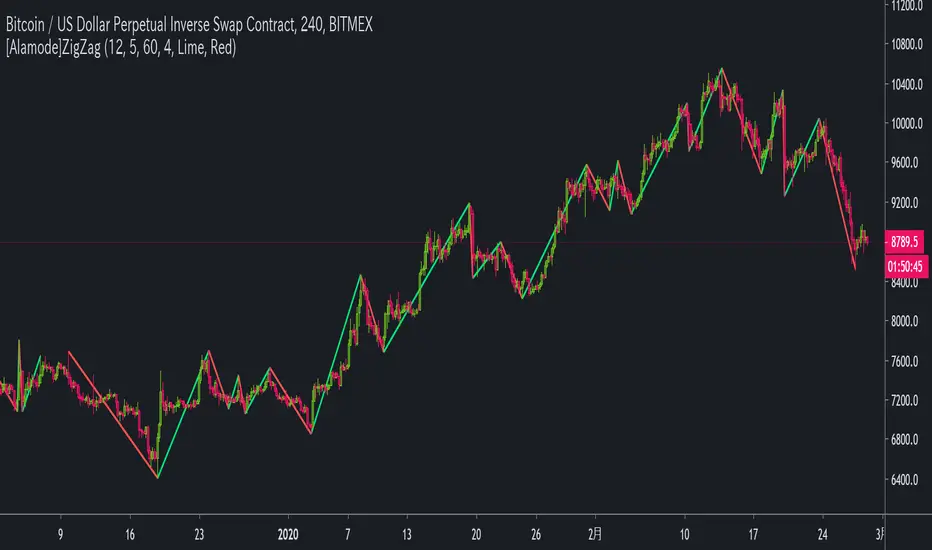
[Alamode]ZigZagOne of the Alamode series that allows you to visually judge trends.
Helps you draw Fibonacci retracements and Fibonacci expansions.
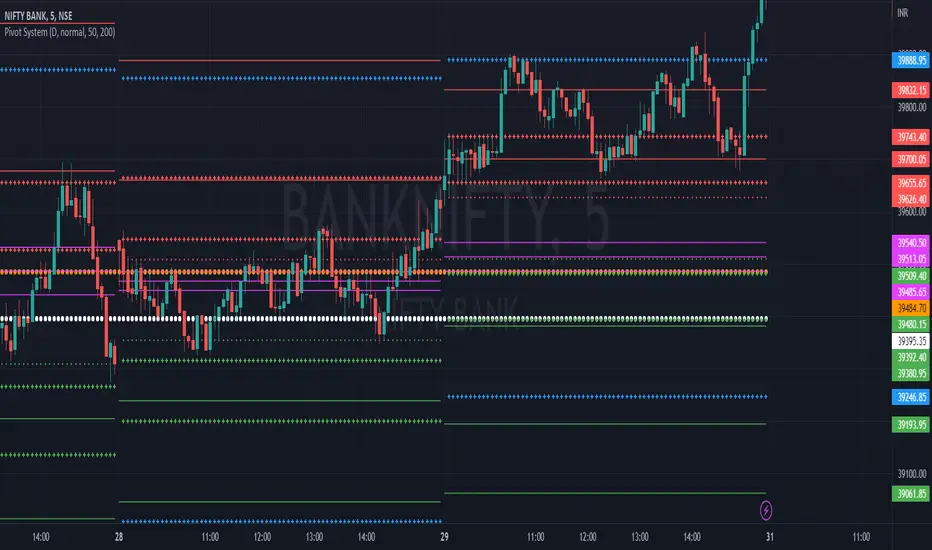
Pivot Points & Midlines with color selectorAdapted from Pinescript Manual's "Pivot Points Standard". Added extra levels and midlines as well as user inputs for color and a "show labels" on/off switch.
So this will show the Pivot level, the resulting levels R1,R2,R3,S1,S2,S3 and the midpoint lines between these.
User can choose the Higher timeframe period from which to calculate these pivot levels, as per the original script.
I like to add two of these to a chart, one for daily and one for weekly pivot levels.
If you don't need any particular level, just comment out the appropriate lines (one from each of the second last and third last blocks in the script).

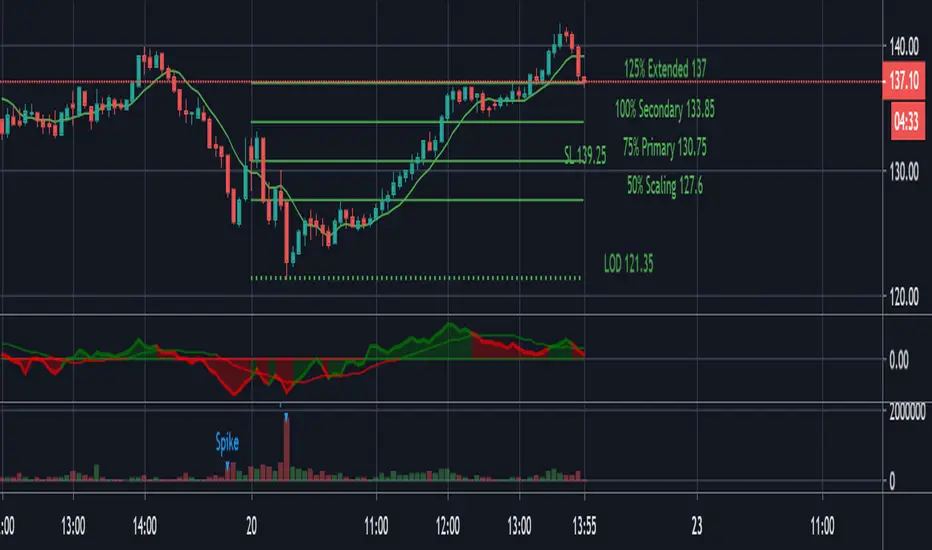
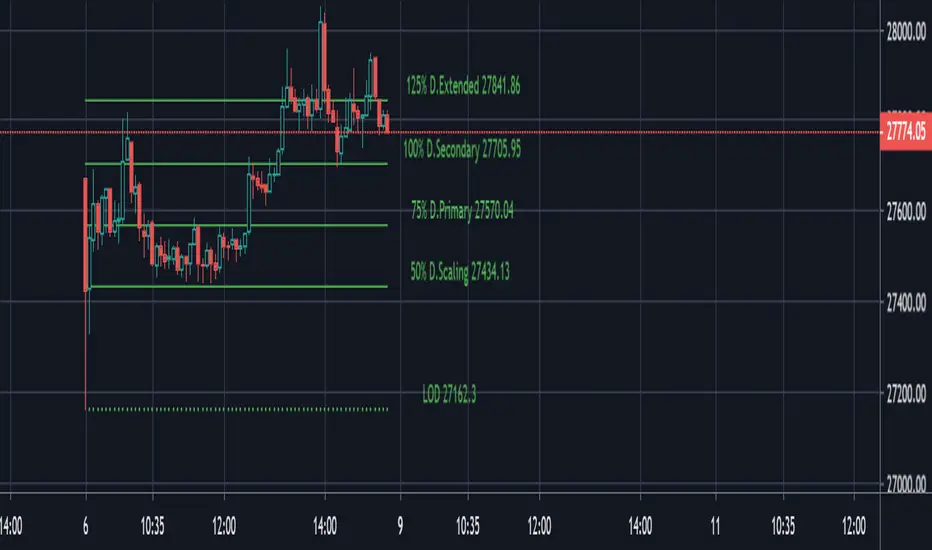
PivotBoss ADR Price TargetsThis script forcasts daily, weekly, Monthly targets well in advance so that you can position yourself accordingly. Script has four target levels such as 50% target level, 75% target level, 100% target level and 125% target level. You can scale out your position across these levels. Price has 80% potential to reach 1st target level, 70% potential to reach 2nd second target level and 50% potential to reach 3rd and 4th target level.
The script takes 10 period average daily range and high of the period to project the downside targets, 10 period ADR and low of the peiod to project upsdie target levels.
When the price is trades in the narrow range in the prior period then the potehtial to reach 125% target level increase by 90%.
This script is purely price based use it with other pivotBoss pivots and volume profile for confirmation of your bias

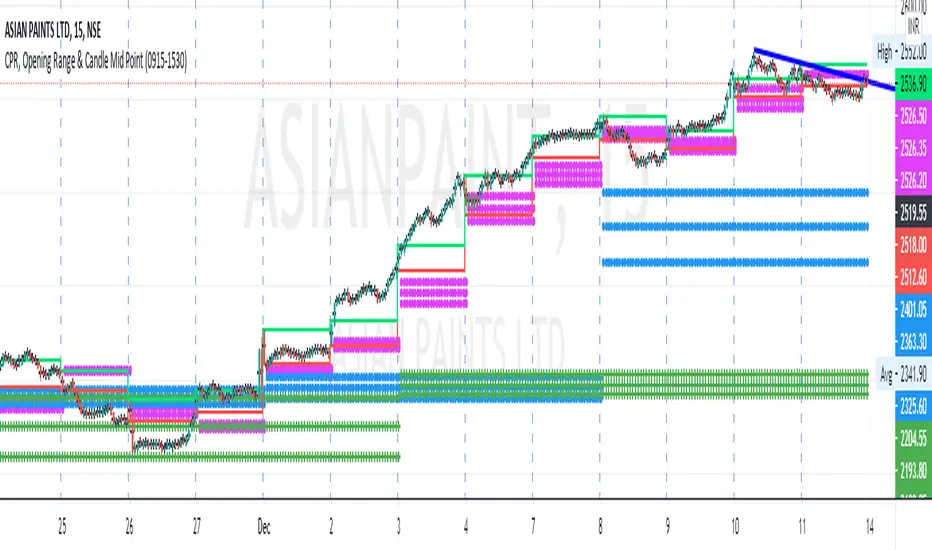
CPR, Opening Range & Candle Mid Point by R.ArunCPR, Opening Range & Candle Mid Points.
To display midpoints of candle sticks, you need to set the visual order of chart ( send to back )
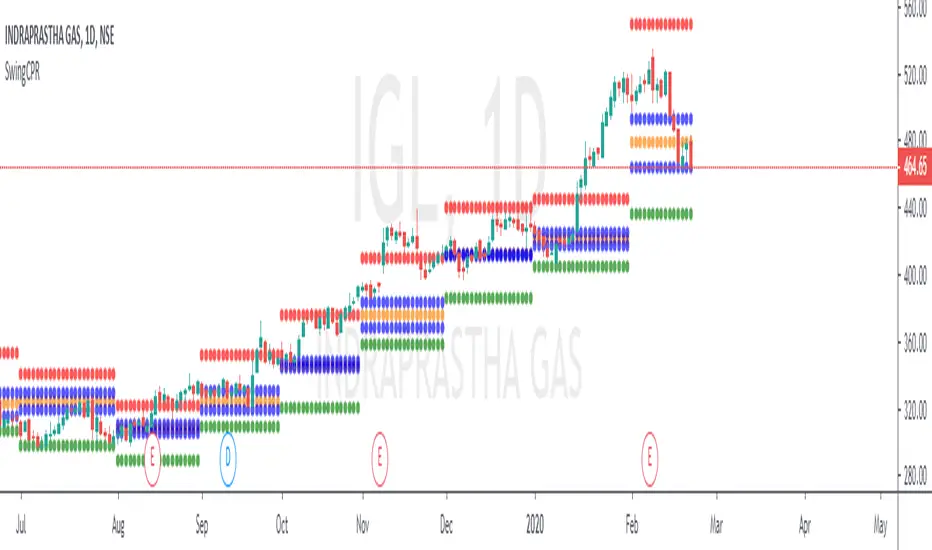
SwingCPRThe above indicators is based on Central Pivot Range,
Details as to how to use it.
1.Strictly use 1D timeframe for analysis, sometimes you can use 1hr tf too.
2. R1(Redline) and S1(greenline) acts as resistance and support.
When you see a trending stock, you can always buy when the stock retraces to the CPR range with R1 as first target and vice versa.
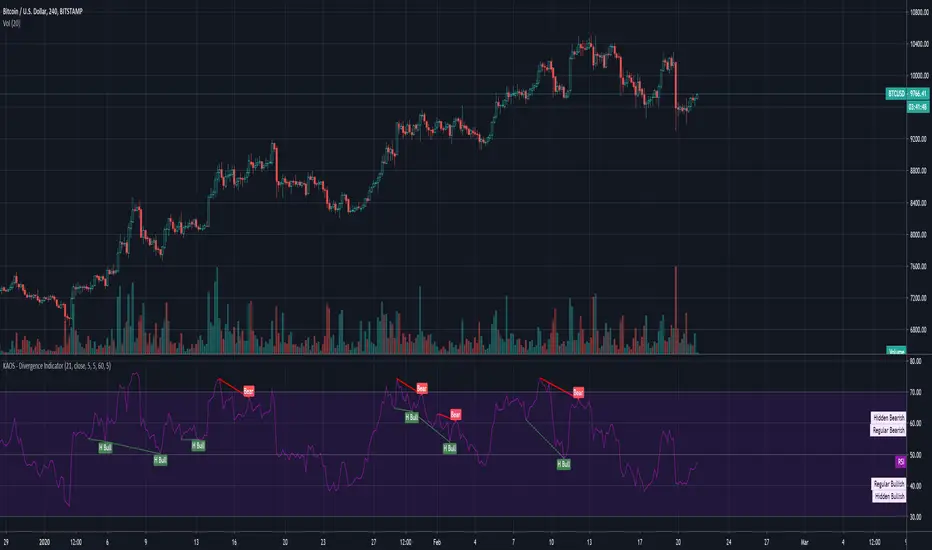
KAOS - Divergence IndicatorDivergence Indicator... Works pretty well, Use with caution as it does amend itself depending on market whale activity.
1hr, 4hr and Daily good for macro movements.
Should be used a supplemental indicator to your over all strategy NOT as a entry exit.
Have fun :)
Made by someone else, but has been tweaked with better settings
Advanced ADR - PivotBossThis Script comes straight from PivotBoss Masterclass. Script calculates compression and expansion of prices. ADR is calulated for user defined period and it is compared over 10 period. If the prices goes over 125% of average ADRin the look back period then current price is over expanded and reversal is in the corner. When Prices falls below 65% of average ADR then prices are under compression. Then you should look to position yourself in the direction of the expansion.
Expansion leads to compression. Compression leads to Expansion
