Awesome Indicator# Moving Average Ribbon with ADR% - Complete Trading Indicator
## Overview
The **Moving Average Ribbon with ADR%** is a comprehensive technical analysis indicator that combines multiple analytical tools to provide traders with a complete picture of price trends, volatility, relative performance, and position sizing guidance. This multi-faceted indicator is designed for both swing and positional traders looking for data-driven entry and exit signals.
## Key Components
### 1. Moving Average Ribbon System
- **4 Customizable Moving Averages** with default periods: 13, 21, 55, and 189
- **Multiple MA Types**: SMA, EMA, SMMA (RMA), WMA, VWMA
- **Color-coded visualization** for easy trend identification
- **Flexible configuration** allowing users to modify periods, types, and colors
### 2. Average Daily Range Percentage (ADR%)
- Calculates the average daily volatility as a percentage
- Uses a 20-period simple moving average of (High/Low - 1) * 100
- Helps traders understand the stock's typical daily movement range
- Essential for position sizing and stop-loss placement
### 3. Volume Analysis (Up/Down Ratio)
- Analyzes volume distribution over the last 55 periods
- Calculates the ratio of volume on up days vs down days
- Provides insight into buying vs selling pressure
- Values > 1 indicate more buying volume, < 1 indicate more selling volume
### 4. Absolute Relative Strength (ARS)
- **Dual timeframe analysis** with customizable reference points
- **High ARS**: Performance relative to benchmark from a high reference point (default: Sep 27, 2024)
- **Low ARS**: Performance relative to benchmark from a low reference point (default: Apr 7, 2025)
- Uses NSE:NIFTY as default comparison symbol
- Color-coded display: Green for outperformance, Red for underperformance
### 5. Relative Performance Table
- **5 timeframes**: 1 Week, 1 Month, 3 Months, 6 Months, 1 Year
- Shows stock performance **relative to benchmark index**
- Formula: (Stock Return - Index Return) for each period
- **Color coding**:
- Lime: >5% outperformance
- Yellow: -5% to +5% relative performance
- Red: <-5% underperformance
### 6. Dynamic Position Allocation System
- **6-factor scoring system** based on price vs EMAs (21, 55, 189)
- Evaluates:
- Price above/below each EMA
- EMA alignment (21>55, 55>189, 21>189)
- **Allocation recommendations**:
- 100% allocation: Score = 6 (all bullish signals)
- 75% allocation: Score = 4
- 50% allocation: Score = 2
- 25% allocation: Score = 0
- 0% allocation: Score = -2, -4, -6 (bearish signals)
## Display Tables
### Performance Table (Top Right)
Shows relative performance vs benchmark across multiple timeframes with intuitive color coding for quick assessment.
### Metrics Table (Bottom Right)
Displays key statistics:
- **ADR%**: Average Daily Range percentage
- **U/D**: Up/Down volume ratio
- **Allocation%**: Recommended position size
- **High ARS%**: Relative strength from high reference
- **Low ARS%**: Relative strength from low reference
## How to Use This Indicator
### For Trend Analysis
1. **Moving Average Ribbon**: Look for price above ascending MAs for bullish trends
2. **MA Alignment**: Bullish when shorter MAs are above longer MAs
3. **Color coordination**: Use consistent color scheme for quick visual analysis
### For Entry/Exit Timing
1. **Performance Table**: Enter when showing consistent outperformance across timeframes
2. **Volume Analysis**: Confirm entries with U/D ratio > 1.5 for strong buying
3. **ARS Values**: Look for positive ARS readings for relative strength confirmation
### For Position Sizing
1. **Allocation System**: Use the recommended allocation percentage
2. **ADR% Consideration**: Adjust position size based on volatility
3. **Risk Management**: Lower allocation in high ADR% stocks
### For Risk Management
1. **ADR% for Stop Loss**: Set stops at 1-2x ADR% below entry
2. **Relative Performance**: Reduce positions when consistently underperforming
3. **Volume Confirmation**: Be cautious when U/D ratio deteriorates
## Best Practices
### Timeframe Recommendations
- **Intraday**: Use lower MA periods (5, 13, 21, 55)
- **Swing Trading**: Default settings work well (13, 21, 55, 189)
- **Position Trading**: Consider higher periods (21, 50, 100, 200)
### Market Conditions
- **Trending Markets**: Focus on MA alignment and relative performance
- **Sideways Markets**: Rely more on ADR% for range trading
- **Volatile Markets**: Reduce allocation percentage regardless of signals
### Customization Tips
1. Adjust reference dates for ARS calculation based on significant market events
2. Change comparison symbol to sector-specific indices for better relative analysis
3. Modify MA periods based on your trading style and market characteristics
## Technical Specifications
- **Version**: Pine Script v6
- **Overlay**: Yes (plots on price chart)
- **Real-time Updates**: Yes
- **Data Requirements**: Minimum 252 bars for complete calculations
- **Compatible Timeframes**: All standard timeframes
## Limitations
- Performance calculations require sufficient historical data
- ARS calculations depend on selected reference dates
- Volume analysis may be less reliable in low-volume stocks
- Relative performance is only as good as the chosen benchmark
This indicator is designed to provide a comprehensive analysis framework rather than simple buy/sell signals. It's recommended to use this in conjunction with your overall trading strategy and risk management rules.
Pengurusan portfolio

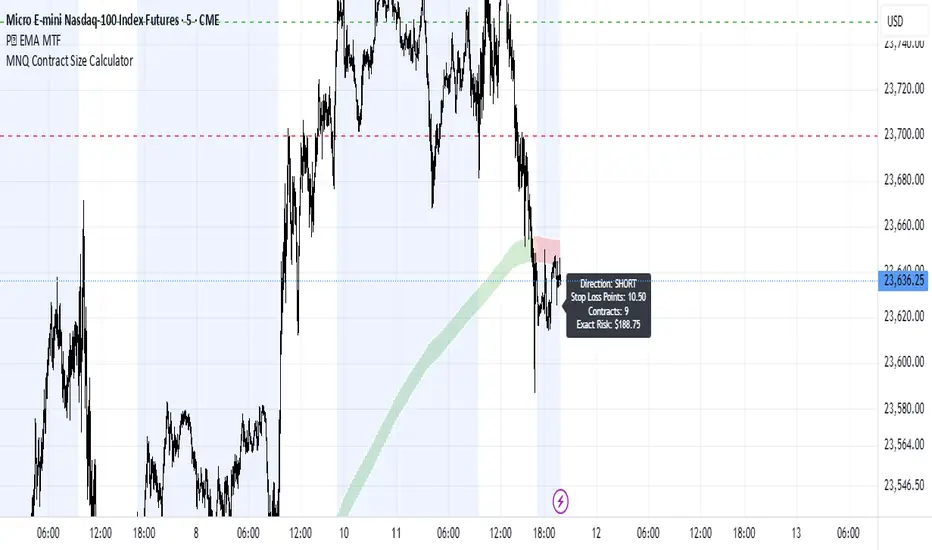
MNQ Contract Size CalculatorSimple drag and drop contract size calculator for MNQ. Uses variables for half risk ($100) and full risk ($200) to adjust your contract size. Perfect for 50k funded accounts.
LANZ Strategy 6.0🔷 LANZ Strategy 6.0 — NY Session Entry Tool & Multi-Account Risk Manager
LANZ Strategy 6.0 - Is a trading tool designed to help traders plan, execute, and manage operations with a focus on risk management, multi-account handling, and visual clarity.
It works exclusively on the 1-hour timeframe ⏳ and is optimized for the New York market opening dynamics.
🧠 Core Concept
The strategy identifies bullish trading opportunities based on the 09:00 NY candle. Once detected, it automatically calculates and draws:
EP (Entry Price) — The exact level where the trade setup triggers.
SL (Stop Loss) — Based on a customizable percentage of the candle's high–low range or wick extremes.
TP (Take Profit) — Calculated using your chosen Risk–Reward Ratio (e.g., 1:5, 1:3, etc.).
⚙️ Main Features
⏳ Time-Specific Execution
Operates only when the 09:00 NY candle closes bullish.
Ideal for traders who align with the New York Session market structure.
💰 Multi-Account Lot Size Management
Up to 5 independent accounts can be configured with their own capital and risk %, showing the exact lot size to use for each.
📏 Adaptive Risk Control
Supports both Forex and non-Forex assets (indices, gold, oil).
For non-Forex, you can manually define the pip value according to your broker’s specs.
🎨 Visual Trade Map
Automatically plots clean and easy-to-read EP, SL, and TP lines with customizable colors, styles, and thickness.
A floating information panel displays levels, pip distances, and lot sizes.
🔔 Real-Time Alerts
Alerts for:
Entry signal detection.
Stop Loss hit.
Take Profit hit.
Manual close at the defined session end.
📊 Example
If you trade GBPUSD with Account #1 set to $10,000 and 2% risk,
and the 09:00 NY candle closes bullish with SL = 30 pips and RR = 5:1:
EP, SL, and TP levels are drawn instantly.
Risk = $200 (2% of $10,000).
Lot size is calculated automatically.
All details are shown in the on-chart panel.
🛠️ How to Use
Load the indicator on a 1-hour chart.
Configure risk settings and account data.
Wait for the 09:00 NY candle to close bullish.
Use the displayed lot size and levels to execute your trade.
Let the tool alert you for SL, TP, or manual close.
⚠️ Disclaimer:
This script is for educational purposes only. It does not guarantee profits and past performance does not represent future results. Always manage your risk responsibly.
👨💻 Credits:
💡 Developed by: LANZ
🧠 Execution Model & Logic Design: LANZ
📅 Designed for: 1H timeframe and NY-based entries

𝙷✪𝚕𝚍𝚎𝚖 🦇 Multi-Exchange Position Tracker v5.51
𝙷✪𝚕𝚍𝚎𝚖 🦇 Multi-Exchange Position Tracker v5.51
Overview
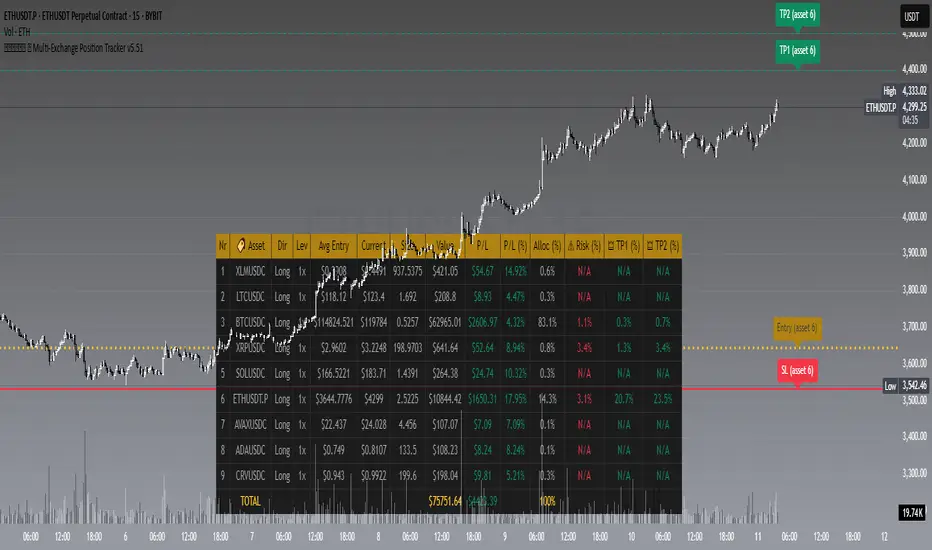
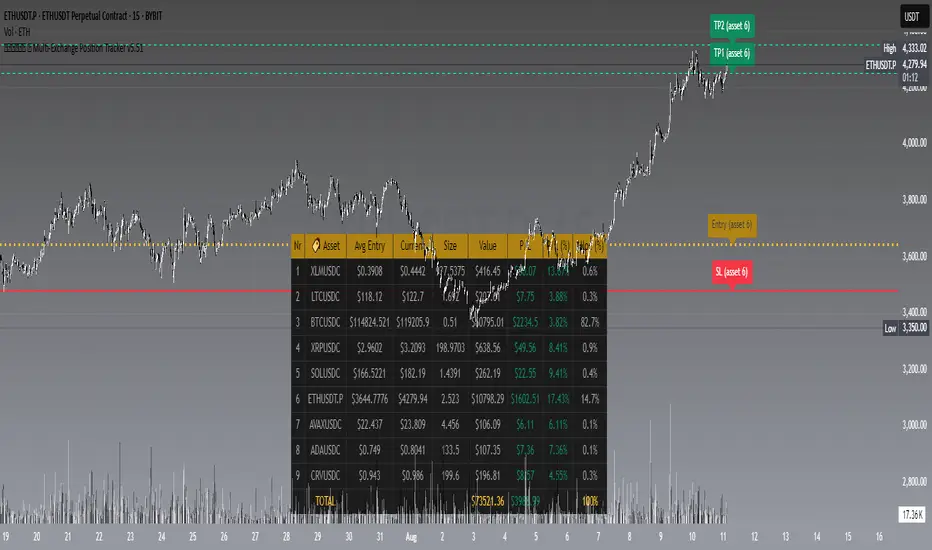
The 𝙷✪𝚕𝚍𝚎𝚖 🦇 Multi-Exchange Position Tracker v5.51 is a powerful and highly customizable Pine Script v6 indicator designed for traders managing portfolios across multiple exchanges and assets. This advanced dashboard provides real-time tracking of up to 20 positions, offering comprehensive insights into your trading performance with support for Dollar-Cost Averaging (DCA), leverage, and risk management.
Key Features
Multi-Exchange Support : Track positions across major exchanges like Binance, Bybit, Bitvavo, Coinbase, Kraken, and OKX.
Multi-Asset Management : Monitor up to 20 assets with customizable symbols, directions (Long/Short), and leverage settings.
DCA Calculations : Input comma-separated entry prices and sizes for accurate Dollar-Cost Averaging calculations.
Real-Time Data : Fetches current prices for each asset to calculate position value, profit/loss (P/L), and allocation percentages.
Customizable Dashboard : Display key metrics such as Asset, Direction, Leverage, Average Entry, Current Price, Size, Value, P/L, P/L (%), Allocation (%), Risk (%), TP1 (%), and TP2 (%) in a flexible table.
TP/SL/Entry Visualization : Plot Take Profit (TP1, TP2), Stop Loss (SL), and Entry levels directly on the chart with customizable line styles, widths, and colors.
Alerts : Receive notifications when TP1, TP2, or SL levels are hit for any enabled asset.
Theming Options : Choose between Dark and Light themes with adjustable transparency, zebra row styling, and cell padding for enhanced readability.
Currency Conversion : Supports USD and EUR as base currencies, with automatic conversion for assets quoted in different currencies.
Debugging Tools : Enable debug labels to troubleshoot NaN issues or DCA mismatches.
How to Use
1. Configure Assets : In the "Asset Positions" section, enable up to 20 assets and specify their exchange, symbol, direction, leverage, entry prices, sizes, stop loss, and take-profit levels.
2. Customize Dashboard : Adjust visibility of columns, table position, size, and styling under "Dashboard Settings" and "Column Visibility" sections.
3. Set Base Currency : Choose USD or EUR for unified P/L and value calculations.
4. Visualize Levels : Enable TP/SL/Entry plotting to see key price levels on the chart, with customizable styles and label positions.
5. Enable Alerts : Turn on alerts to get notified when price crosses TP or SL levels.
6. Debugging : Use debug labels to identify and resolve any input errors or invalid symbols.
Settings Breakdown
Dashboard Settings : Toggle dashboard visibility, hide zero-size positions, show total account row, and set table position/size.
Column Visibility : Select which columns to display (e.g., Asset, P/L, Risk %).
Styling & Colors : Customize themes (Dark/Light), transparency, zebra row colors, and border styles.
TP/SL/Entry Styling : Adjust line styles, widths, colors, and label positions for Stop Loss, Take Profit, and Entry levels.
Asset Positions : Input details for each asset, including exchange, symbol, direction, leverage, and DCA entries.
Notes
Ensure correct symbol formats (e.g., BTCUSDT for Binance, ADAEUR for Bitvavo) to avoid price fetch errors.
DCA entries and sizes must match in count and be valid numbers to prevent calculation errors.
The indicator supports up to 500 lines and labels for optimal performance.
For best results, use on a chart matching one of your tracked asset symbols to visualize TP/SL/Entry lines.
Why Use This Indicator?
This indicator is ideal for traders juggling multiple positions across exchanges. It consolidates critical data into a single, visually appealing dashboard, saving time and improving decision-making. With robust customization, real-time calculations, and alert functionality, it’s a must-have tool for both novice and experienced traders.
Developed by 𝙷✪𝚕𝚍𝚎𝚖 🦇, 2025 ©
𝙷✪𝚕𝚍𝚎𝚖 🦇 Multi-Exchange Position Tracker v5.51
𝙷✪𝚕𝚍𝚎𝚖 🦇 Multi-Exchange Position Tracker v5.51
Overview
The 𝙷✪𝚕𝚍𝚎𝚖 🦇 Multi-Exchange Position Tracker v5.51 is a powerful and highly customizable Pine Script v6 indicator designed for traders managing portfolios across multiple exchanges and assets. This advanced dashboard provides real-time tracking of up to 20 positions, offering comprehensive insights into your trading performance with support for Dollar-Cost Averaging (DCA), leverage, and risk management.
Key Features
Multi-Exchange Support : Track positions across major exchanges like Binance, Bybit, Bitvavo, Coinbase, Kraken, and OKX.
Multi-Asset Management : Monitor up to 20 assets with customizable symbols, directions (Long/Short), and leverage settings.
DCA Calculations : Input comma-separated entry prices and sizes for accurate Dollar-Cost Averaging calculations.
Real-Time Data : Fetches current prices for each asset to calculate position value, profit/loss (P/L), and allocation percentages.
Customizable Dashboard : Display key metrics such as Asset, Direction, Leverage, Average Entry, Current Price, Size, Value, P/L, P/L (%), Allocation (%), Risk (%), TP1 (%), and TP2 (%) in a flexible table.
TP/SL/Entry Visualization : Plot Take Profit (TP1, TP2), Stop Loss (SL), and Entry levels directly on the chart with customizable line styles, widths, and colors.
Alerts : Receive notifications when TP1, TP2, or SL levels are hit for any enabled asset.
Theming Options : Choose between Dark and Light themes with adjustable transparency, zebra row styling, and cell padding for enhanced readability.
Currency Conversion : Supports USD and EUR as base currencies, with automatic conversion for assets quoted in different currencies.
Debugging Tools : Enable debug labels to troubleshoot NaN issues or DCA mismatches.
How to Use
1. Configure Assets : In the "Asset Positions" section, enable up to 20 assets and specify their exchange, symbol, direction, leverage, entry prices, sizes, stop loss, and take-profit levels.
2. Customize Dashboard : Adjust visibility of columns, table position, size, and styling under "Dashboard Settings" and "Column Visibility" sections.
3. Set Base Currency : Choose USD or EUR for unified P/L and value calculations.
4. Visualize Levels : Enable TP/SL/Entry plotting to see key price levels on the chart, with customizable styles and label positions.
5. Enable Alerts : Turn on alerts to get notified when price crosses TP or SL levels.
6. Debugging : Use debug labels to identify and resolve any input errors or invalid symbols.
Settings Breakdown
Dashboard Settings : Toggle dashboard visibility, hide zero-size positions, show total account row, and set table position/size.
Column Visibility : Select which columns to display (e.g., Asset, P/L, Risk %).
Styling & Colors : Customize themes (Dark/Light), transparency, zebra row colors, and border styles.
TP/SL/Entry Styling : Adjust line styles, widths, colors, and label positions for Stop Loss, Take Profit, and Entry levels.
Asset Positions : Input details for each asset, including exchange, symbol, direction, leverage, and DCA entries.
Notes
Ensure correct symbol formats (e.g., BTCUSDT for Binance, ADAEUR for Bitvavo) to avoid price fetch errors.
DCA entries and sizes must match in count and be valid numbers to prevent calculation errors.
The indicator supports up to 500 lines and labels for optimal performance.
For best results, use on a chart matching one of your tracked asset symbols to visualize TP/SL/Entry lines.
Why Use This Indicator?
This indicator is ideal for traders juggling multiple positions across exchanges. It consolidates critical data into a single, visually appealing dashboard, saving time and improving decision-making. With robust customization, real-time calculations, and alert functionality, it’s a must-have tool for both novice and experienced traders.
Developed by 𝙷✪𝚕𝚍𝚎𝚖 🦇, 2025 ©
Simple Leveraged PnLThis script shows your live trade PnL, ROE, R:R ratio, margin, leverage, entry, TP, and SL directly on the chart.
It draws:
Green/red zones for your Take Profit and Stop Loss ranges.
A pinned info card (movable to any corner of the chart) showing all key trade details in one place.
You can fully customize:
Card position (top/middle/bottom × left/middle/right)
Text size, colors, and background
Zone transparency
It works for both Long and Short positions and updates in real time.

Kelly Position Size CalculatorThis position sizing calculator implements the Kelly Criterion, developed by John L. Kelly Jr. at Bell Laboratories in 1956, to determine mathematically optimal position sizes for maximizing long-term wealth growth. Unlike arbitrary position sizing methods, this tool provides a scientifically solution based on your strategy's actual performance statistics and incorporates modern refinements from over six decades of academic research.
The Kelly Criterion addresses a fundamental question in capital allocation: "What fraction of capital should be allocated to each opportunity to maximize growth while avoiding ruin?" This question has profound implications for financial markets, where traders and investors constantly face decisions about optimal capital allocation (Van Tharp, 2007).
Theoretical Foundation
The Kelly Criterion for binary outcomes is expressed as f* = (bp - q) / b, where f* represents the optimal fraction of capital to allocate, b denotes the risk-reward ratio, p indicates the probability of success, and q represents the probability of loss (Kelly, 1956). This formula maximizes the expected logarithm of wealth, ensuring maximum long-term growth rate while avoiding the risk of ruin.
The mathematical elegance of Kelly's approach lies in its derivation from information theory. Kelly's original work was motivated by Claude Shannon's information theory (Shannon, 1948), recognizing that maximizing the logarithm of wealth is equivalent to maximizing the rate of information transmission. This connection between information theory and wealth accumulation provides a deep theoretical foundation for optimal position sizing.
The logarithmic utility function underlying the Kelly Criterion naturally embodies several desirable properties for capital management. It exhibits decreasing marginal utility, penalizes large losses more severely than it rewards equivalent gains, and focuses on geometric rather than arithmetic mean returns, which is appropriate for compounding scenarios (Thorp, 2006).
Scientific Implementation
This calculator extends beyond basic Kelly implementation by incorporating state of the art refinements from academic research:
Parameter Uncertainty Adjustment: Following Michaud (1989), the implementation applies Bayesian shrinkage to account for parameter estimation error inherent in small sample sizes. The adjustment formula f_adjusted = f_kelly × confidence_factor + f_conservative × (1 - confidence_factor) addresses the overconfidence bias documented by Baker and McHale (2012), where the confidence factor increases with sample size and the conservative estimate equals 0.25 (quarter Kelly).
Sample Size Confidence: The reliability of Kelly calculations depends critically on sample size. Research by Browne and Whitt (1996) provides theoretical guidance on minimum sample requirements, suggesting that at least 30 independent observations are necessary for meaningful parameter estimates, with 100 or more trades providing reliable estimates for most trading strategies.
Universal Asset Compatibility: The calculator employs intelligent asset detection using TradingView's built-in symbol information, automatically adapting calculations for different asset classes without manual configuration.
ASSET SPECIFIC IMPLEMENTATION
Equity Markets: For stocks and ETFs, position sizing follows the calculation Shares = floor(Kelly Fraction × Account Size / Share Price). This straightforward approach reflects whole share constraints while accommodating fractional share trading capabilities.
Foreign Exchange Markets: Forex markets require lot-based calculations following Lot Size = Kelly Fraction × Account Size / (100,000 × Base Currency Value). The calculator automatically handles major currency pairs with appropriate pip value calculations, following industry standards described by Archer (2010).
Futures Markets: Futures position sizing accounts for leverage and margin requirements through Contracts = floor(Kelly Fraction × Account Size / Margin Requirement). The calculator estimates margin requirements as a percentage of contract notional value, with specific adjustments for micro-futures contracts that have smaller sizes and reduced margin requirements (Kaufman, 2013).
Index and Commodity Markets: These markets combine characteristics of both equity and futures markets. The calculator automatically detects whether instruments are cash-settled or futures-based, applying appropriate sizing methodologies with correct point value calculations.
Risk Management Integration
The calculator integrates sophisticated risk assessment through two primary modes:
Stop Loss Integration: When fixed stop-loss levels are defined, risk calculation follows Risk per Trade = Position Size × Stop Loss Distance. This ensures that the Kelly fraction accounts for actual risk exposure rather than theoretical maximum loss, with stop-loss distance measured in appropriate units for each asset class.
Strategy Drawdown Assessment: For discretionary exit strategies, risk estimation uses maximum historical drawdown through Risk per Trade = Position Value × (Maximum Drawdown / 100). This approach assumes that individual trade losses will not exceed the strategy's historical maximum drawdown, providing a reasonable estimate for strategies with well-defined risk characteristics.
Fractional Kelly Approaches
Pure Kelly sizing can produce substantial volatility, leading many practitioners to adopt fractional Kelly approaches. MacLean, Sanegre, Zhao, and Ziemba (2004) analyze the trade-offs between growth rate and volatility, demonstrating that half-Kelly typically reduces volatility by approximately 75% while sacrificing only 25% of the growth rate.
The calculator provides three primary Kelly modes to accommodate different risk preferences and experience levels. Full Kelly maximizes growth rate while accepting higher volatility, making it suitable for experienced practitioners with strong risk tolerance and robust capital bases. Half Kelly offers a balanced approach popular among professional traders, providing optimal risk-return balance by reducing volatility significantly while maintaining substantial growth potential. Quarter Kelly implements a conservative approach with low volatility, recommended for risk-averse traders or those new to Kelly methodology who prefer gradual introduction to optimal position sizing principles.
Empirical Validation and Performance
Extensive academic research supports the theoretical advantages of Kelly sizing. Hakansson and Ziemba (1995) provide a comprehensive review of Kelly applications in finance, documenting superior long-term performance across various market conditions and asset classes. Estrada (2008) analyzes Kelly performance in international equity markets, finding that Kelly-based strategies consistently outperform fixed position sizing approaches over extended periods across 19 developed markets over a 30-year period.
Several prominent investment firms have successfully implemented Kelly-based position sizing. Pabrai (2007) documents the application of Kelly principles at Berkshire Hathaway, noting Warren Buffett's concentrated portfolio approach aligns closely with Kelly optimal sizing for high-conviction investments. Quantitative hedge funds, including Renaissance Technologies and AQR, have incorporated Kelly-based risk management into their systematic trading strategies.
Practical Implementation Guidelines
Successful Kelly implementation requires systematic application with attention to several critical factors:
Parameter Estimation: Accurate parameter estimation represents the greatest challenge in practical Kelly implementation. Brown (1976) notes that small errors in probability estimates can lead to significant deviations from optimal performance. The calculator addresses this through Bayesian adjustments and confidence measures.
Sample Size Requirements: Users should begin with conservative fractional Kelly approaches until achieving sufficient historical data. Strategies with fewer than 30 trades may produce unreliable Kelly estimates, regardless of adjustments. Full confidence typically requires 100 or more independent trade observations.
Market Regime Considerations: Parameters that accurately describe historical performance may not reflect future market conditions. Ziemba (2003) recommends regular parameter updates and conservative adjustments when market conditions change significantly.
Professional Features and Customization
The calculator provides comprehensive customization options for professional applications:
Multiple Color Schemes: Eight professional color themes (Gold, EdgeTools, Behavioral, Quant, Ocean, Fire, Matrix, Arctic) with dark and light theme compatibility ensure optimal visibility across different trading environments.
Flexible Display Options: Adjustable table size and position accommodate various chart layouts and user preferences, while maintaining analytical depth and clarity.
Comprehensive Results: The results table presents essential information including asset specifications, strategy statistics, Kelly calculations, sample confidence measures, position values, risk assessments, and final position sizes in appropriate units for each asset class.
Limitations and Considerations
Like any analytical tool, the Kelly Criterion has important limitations that users must understand:
Stationarity Assumption: The Kelly Criterion assumes that historical strategy statistics represent future performance characteristics. Non-stationary market conditions may invalidate this assumption, as noted by Lo and MacKinlay (1999).
Independence Requirement: Each trade should be independent to avoid correlation effects. Many trading strategies exhibit serial correlation in returns, which can affect optimal position sizing and may require adjustments for portfolio applications.
Parameter Sensitivity: Kelly calculations are sensitive to parameter accuracy. Regular calibration and conservative approaches are essential when parameter uncertainty is high.
Transaction Costs: The implementation incorporates user-defined transaction costs but assumes these remain constant across different position sizes and market conditions, following Ziemba (2003).
Advanced Applications and Extensions
Multi-Asset Portfolio Considerations: While this calculator optimizes individual position sizes, portfolio-level applications require additional considerations for correlation effects and aggregate risk management. Simplified portfolio approaches include treating positions independently with correlation adjustments.
Behavioral Factors: Behavioral finance research reveals systematic biases that can interfere with Kelly implementation. Kahneman and Tversky (1979) document loss aversion, overconfidence, and other cognitive biases that lead traders to deviate from optimal strategies. Successful implementation requires disciplined adherence to calculated recommendations.
Time-Varying Parameters: Advanced implementations may incorporate time-varying parameter models that adjust Kelly recommendations based on changing market conditions, though these require sophisticated econometric techniques and substantial computational resources.
Comprehensive Usage Instructions and Practical Examples
Implementation begins with loading the calculator on your desired trading instrument's chart. The system automatically detects asset type across stocks, forex, futures, and cryptocurrency markets while extracting current price information. Navigation to the indicator settings allows input of your specific strategy parameters.
Strategy statistics configuration requires careful attention to several key metrics. The win rate should be calculated from your backtest results using the formula of winning trades divided by total trades multiplied by 100. Average win represents the sum of all profitable trades divided by the number of winning trades, while average loss calculates the sum of all losing trades divided by the number of losing trades, entered as a positive number. The total historical trades parameter requires the complete number of trades in your backtest, with a minimum of 30 trades recommended for basic functionality and 100 or more trades optimal for statistical reliability. Account size should reflect your available trading capital, specifically the risk capital allocated for trading rather than total net worth.
Risk management configuration adapts to your specific trading approach. The stop loss setting should be enabled if you employ fixed stop-loss exits, with the stop loss distance specified in appropriate units depending on the asset class. For stocks, this distance is measured in dollars, for forex in pips, and for futures in ticks. When stop losses are not used, the maximum strategy drawdown percentage from your backtest provides the risk assessment baseline. Kelly mode selection offers three primary approaches: Full Kelly for aggressive growth with higher volatility suitable for experienced practitioners, Half Kelly for balanced risk-return optimization popular among professional traders, and Quarter Kelly for conservative approaches with reduced volatility.
Display customization ensures optimal integration with your trading environment. Eight professional color themes provide optimization for different chart backgrounds and personal preferences. Table position selection allows optimal placement within your chart layout, while table size adjustment ensures readability across different screen resolutions and viewing preferences.
Detailed Practical Examples
Example 1: SPY Swing Trading Strategy
Consider a professionally developed swing trading strategy for SPY (S&P 500 ETF) with backtesting results spanning 166 total trades. The strategy achieved 110 winning trades, representing a 66.3% win rate, with an average winning trade of $2,200 and average losing trade of $862. The maximum drawdown reached 31.4% during the testing period, and the available trading capital amounts to $25,000. This strategy employs discretionary exits without fixed stop losses.
Implementation requires loading the calculator on the SPY daily chart and configuring the parameters accordingly. The win rate input receives 66.3, while average win and loss inputs receive 2200 and 862 respectively. Total historical trades input requires 166, with account size set to 25000. The stop loss function remains disabled due to the discretionary exit approach, with maximum strategy drawdown set to 31.4%. Half Kelly mode provides the optimal balance between growth and risk management for this application.
The calculator generates several key outputs for this scenario. The risk-reward ratio calculates automatically to 2.55, while the Kelly fraction reaches approximately 53% before scientific adjustments. Sample confidence achieves 100% given the 166 trades providing high statistical confidence. The recommended position settles at approximately 27% after Half Kelly and Bayesian adjustment factors. Position value reaches approximately $6,750, translating to 16 shares at a $420 SPY price. Risk per trade amounts to approximately $2,110, representing 31.4% of position value, with expected value per trade reaching approximately $1,466. This recommendation represents the mathematically optimal balance between growth potential and risk management for this specific strategy profile.
Example 2: EURUSD Day Trading with Stop Losses
A high-frequency EURUSD day trading strategy demonstrates different parameter requirements compared to swing trading approaches. This strategy encompasses 89 total trades with a 58% win rate, generating an average winning trade of $180 and average losing trade of $95. The maximum drawdown reached 12% during testing, with available capital of $10,000. The strategy employs fixed stop losses at 25 pips and take profit targets at 45 pips, providing clear risk-reward parameters.
Implementation begins with loading the calculator on the EURUSD 1-hour chart for appropriate timeframe alignment. Parameter configuration includes win rate at 58, average win at 180, and average loss at 95. Total historical trades input receives 89, with account size set to 10000. The stop loss function is enabled with distance set to 25 pips, reflecting the fixed exit strategy. Quarter Kelly mode provides conservative positioning due to the smaller sample size compared to the previous example.
Results demonstrate the impact of smaller sample sizes on Kelly calculations. The risk-reward ratio calculates to 1.89, while the Kelly fraction reaches approximately 32% before adjustments. Sample confidence achieves 89%, providing moderate statistical confidence given the 89 trades. The recommended position settles at approximately 7% after Quarter Kelly application and Bayesian shrinkage adjustment for the smaller sample. Position value amounts to approximately $700, translating to 0.07 standard lots. Risk per trade reaches approximately $175, calculated as 25 pips multiplied by lot size and pip value, with expected value per trade at approximately $49. This conservative position sizing reflects the smaller sample size, with position sizes expected to increase as trade count surpasses 100 and statistical confidence improves.
Example 3: ES1! Futures Systematic Strategy
Systematic futures trading presents unique considerations for Kelly criterion application, as demonstrated by an E-mini S&P 500 futures strategy encompassing 234 total trades. This systematic approach achieved a 45% win rate with an average winning trade of $1,850 and average losing trade of $720. The maximum drawdown reached 18% during the testing period, with available capital of $50,000. The strategy employs 15-tick stop losses with contract specifications of $50 per tick, providing precise risk control mechanisms.
Implementation involves loading the calculator on the ES1! 15-minute chart to align with the systematic trading timeframe. Parameter configuration includes win rate at 45, average win at 1850, and average loss at 720. Total historical trades receives 234, providing robust statistical foundation, with account size set to 50000. The stop loss function is enabled with distance set to 15 ticks, reflecting the systematic exit methodology. Half Kelly mode balances growth potential with appropriate risk management for futures trading.
Results illustrate how favorable risk-reward ratios can support meaningful position sizing despite lower win rates. The risk-reward ratio calculates to 2.57, while the Kelly fraction reaches approximately 16%, lower than previous examples due to the sub-50% win rate. Sample confidence achieves 100% given the 234 trades providing high statistical confidence. The recommended position settles at approximately 8% after Half Kelly adjustment. Estimated margin per contract amounts to approximately $2,500, resulting in a single contract allocation. Position value reaches approximately $2,500, with risk per trade at $750, calculated as 15 ticks multiplied by $50 per tick. Expected value per trade amounts to approximately $508. Despite the lower win rate, the favorable risk-reward ratio supports meaningful position sizing, with single contract allocation reflecting appropriate leverage management for futures trading.
Example 4: MES1! Micro-Futures for Smaller Accounts
Micro-futures contracts provide enhanced accessibility for smaller trading accounts while maintaining identical strategy characteristics. Using the same systematic strategy statistics from the previous example but with available capital of $15,000 and micro-futures specifications of $5 per tick with reduced margin requirements, the implementation demonstrates improved position sizing granularity.
Kelly calculations remain identical to the full-sized contract example, maintaining the same risk-reward dynamics and statistical foundations. However, estimated margin per contract reduces to approximately $250 for micro-contracts, enabling allocation of 4-5 micro-contracts. Position value reaches approximately $1,200, while risk per trade calculates to $75, derived from 15 ticks multiplied by $5 per tick. This granularity advantage provides better position size precision for smaller accounts, enabling more accurate Kelly implementation without requiring large capital commitments.
Example 5: Bitcoin Swing Trading
Cryptocurrency markets present unique challenges requiring modified Kelly application approaches. A Bitcoin swing trading strategy on BTCUSD encompasses 67 total trades with a 71% win rate, generating average winning trades of $3,200 and average losing trades of $1,400. Maximum drawdown reached 28% during testing, with available capital of $30,000. The strategy employs technical analysis for exits without fixed stop losses, relying on price action and momentum indicators.
Implementation requires conservative approaches due to cryptocurrency volatility characteristics. Quarter Kelly mode is recommended despite the high win rate to account for crypto market unpredictability. Expected position sizing remains reduced due to the limited sample size of 67 trades, requiring additional caution until statistical confidence improves. Regular parameter updates are strongly recommended due to cryptocurrency market evolution and changing volatility patterns that can significantly impact strategy performance characteristics.
Advanced Usage Scenarios
Portfolio position sizing requires sophisticated consideration when running multiple strategies simultaneously. Each strategy should have its Kelly fraction calculated independently to maintain mathematical integrity. However, correlation adjustments become necessary when strategies exhibit related performance patterns. Moderately correlated strategies should receive individual position size reductions of 10-20% to account for overlapping risk exposure. Aggregate portfolio risk monitoring ensures total exposure remains within acceptable limits across all active strategies. Professional practitioners often consider using lower fractional Kelly approaches, such as Quarter Kelly, when running multiple strategies simultaneously to provide additional safety margins.
Parameter sensitivity analysis forms a critical component of professional Kelly implementation. Regular validation procedures should include monthly parameter updates using rolling 100-trade windows to capture evolving market conditions while maintaining statistical relevance. Sensitivity testing involves varying win rates by ±5% and average win/loss ratios by ±10% to assess recommendation stability under different parameter assumptions. Out-of-sample validation reserves 20% of historical data for parameter verification, ensuring that optimization doesn't create curve-fitted results. Regime change detection monitors actual performance against expected metrics, triggering parameter reassessment when significant deviations occur.
Risk management integration requires professional overlay considerations beyond pure Kelly calculations. Daily loss limits should cease trading when daily losses exceed twice the calculated risk per trade, preventing emotional decision-making during adverse periods. Maximum position limits should never exceed 25% of account value in any single position regardless of Kelly recommendations, maintaining diversification principles. Correlation monitoring reduces position sizes when holding multiple correlated positions that move together during market stress. Volatility adjustments consider reducing position sizes during periods of elevated VIX above 25 for equity strategies, adapting to changing market conditions.
Troubleshooting and Optimization
Professional implementation often encounters specific challenges requiring systematic troubleshooting approaches. Zero position size displays typically result from insufficient capital for minimum position sizes, negative expected values, or extremely conservative Kelly calculations. Solutions include increasing account size, verifying strategy statistics for accuracy, considering Quarter Kelly mode for conservative approaches, or reassessing overall strategy viability when fundamental issues exist.
Extremely high Kelly fractions exceeding 50% usually indicate underlying problems with parameter estimation. Common causes include unrealistic win rates, inflated risk-reward ratios, or curve-fitted backtest results that don't reflect genuine trading conditions. Solutions require verifying backtest methodology, including all transaction costs in calculations, testing strategies on out-of-sample data, and using conservative fractional Kelly approaches until parameter reliability improves.
Low sample confidence below 50% reflects insufficient historical trades for reliable parameter estimation. This situation demands gathering additional trading data, using Quarter Kelly approaches until reaching 100 or more trades, applying extra conservatism in position sizing, and considering paper trading to build statistical foundations without capital risk.
Inconsistent results across similar strategies often stem from parameter estimation differences, market regime changes, or strategy degradation over time. Professional solutions include standardizing backtest methodology across all strategies, updating parameters regularly to reflect current conditions, and monitoring live performance against expectations to identify deteriorating strategies.
Position sizes that appear inappropriately large or small require careful validation against traditional risk management principles. Professional standards recommend never risking more than 2-3% per trade regardless of Kelly calculations. Calibration should begin with Quarter Kelly approaches, gradually increasing as comfort and confidence develop. Most institutional traders utilize 25-50% of full Kelly recommendations to balance growth with prudent risk management.
Market condition adjustments require dynamic approaches to Kelly implementation. Trending markets may support full Kelly recommendations when directional momentum provides favorable conditions. Ranging or volatile markets typically warrant reducing to Half or Quarter Kelly to account for increased uncertainty. High correlation periods demand reducing individual position sizes when multiple positions move together, concentrating risk exposure. News and event periods often justify temporary position size reductions during high-impact releases that can create unpredictable market movements.
Performance monitoring requires systematic protocols to ensure Kelly implementation remains effective over time. Weekly reviews should compare actual versus expected win rates and average win/loss ratios to identify parameter drift or strategy degradation. Position size efficiency and execution quality monitoring ensures that calculated recommendations translate effectively into actual trading results. Tracking correlation between calculated and realized risk helps identify discrepancies between theoretical and practical risk exposure.
Monthly calibration provides more comprehensive parameter assessment using the most recent 100 trades to maintain statistical relevance while capturing current market conditions. Kelly mode appropriateness requires reassessment based on recent market volatility and performance characteristics, potentially shifting between Full, Half, and Quarter Kelly approaches as conditions change. Transaction cost evaluation ensures that commission structures, spreads, and slippage estimates remain accurate and current.
Quarterly strategic reviews encompass comprehensive strategy performance analysis comparing long-term results against expectations and identifying trends in effectiveness. Market regime assessment evaluates parameter stability across different market conditions, determining whether strategy characteristics remain consistent or require fundamental adjustments. Strategic modifications to position sizing methodology may become necessary as markets evolve or trading approaches mature, ensuring that Kelly implementation continues supporting optimal capital allocation objectives.
Professional Applications
This calculator serves diverse professional applications across the financial industry. Quantitative hedge funds utilize the implementation for systematic position sizing within algorithmic trading frameworks, where mathematical precision and consistent application prove essential for institutional capital management. Professional discretionary traders benefit from optimized position management that removes emotional bias while maintaining flexibility for market-specific adjustments. Portfolio managers employ the calculator for developing risk-adjusted allocation strategies that enhance returns while maintaining prudent risk controls across diverse asset classes and investment strategies.
Individual traders seeking mathematical optimization of capital allocation find the calculator provides institutional-grade methodology previously available only to professional money managers. The Kelly Criterion establishes theoretical foundation for optimal capital allocation across both single strategies and multiple trading systems, offering significant advantages over arbitrary position sizing methods that rely on intuition or fixed percentage approaches. Professional implementation ensures consistent application of mathematically sound principles while adapting to changing market conditions and strategy performance characteristics.
Conclusion
The Kelly Criterion represents one of the few mathematically optimal solutions to fundamental investment problems. When properly understood and carefully implemented, it provides significant competitive advantage in financial markets. This calculator implements modern refinements to Kelly's original formula while maintaining accessibility for practical trading applications.
Success with Kelly requires ongoing learning, systematic application, and continuous refinement based on market feedback and evolving research. Users who master Kelly principles and implement them systematically can expect superior risk-adjusted returns and more consistent capital growth over extended periods.
The extensive academic literature provides rich resources for deeper study, while practical experience builds the intuition necessary for effective implementation. Regular parameter updates, conservative approaches with limited data, and disciplined adherence to calculated recommendations are essential for optimal results.
References
Archer, M. D. (2010). Getting Started in Currency Trading: Winning in Today's Forex Market (3rd ed.). John Wiley & Sons.
Baker, R. D., & McHale, I. G. (2012). An empirical Bayes approach to optimising betting strategies. Journal of the Royal Statistical Society: Series D (The Statistician), 61(1), 75-92.
Breiman, L. (1961). Optimal gambling systems for favorable games. In J. Neyman (Ed.), Proceedings of the Fourth Berkeley Symposium on Mathematical Statistics and Probability (pp. 65-78). University of California Press.
Brown, D. B. (1976). Optimal portfolio growth: Logarithmic utility and the Kelly criterion. In W. T. Ziemba & R. G. Vickson (Eds.), Stochastic Optimization Models in Finance (pp. 1-23). Academic Press.
Browne, S., & Whitt, W. (1996). Portfolio choice and the Bayesian Kelly criterion. Advances in Applied Probability, 28(4), 1145-1176.
Estrada, J. (2008). Geometric mean maximization: An overlooked portfolio approach? The Journal of Investing, 17(4), 134-147.
Hakansson, N. H., & Ziemba, W. T. (1995). Capital growth theory. In R. A. Jarrow, V. Maksimovic, & W. T. Ziemba (Eds.), Handbooks in Operations Research and Management Science (Vol. 9, pp. 65-86). Elsevier.
Kahneman, D., & Tversky, A. (1979). Prospect theory: An analysis of decision under risk. Econometrica, 47(2), 263-291.
Kaufman, P. J. (2013). Trading Systems and Methods (5th ed.). John Wiley & Sons.
Kelly Jr, J. L. (1956). A new interpretation of information rate. Bell System Technical Journal, 35(4), 917-926.
Lo, A. W., & MacKinlay, A. C. (1999). A Non-Random Walk Down Wall Street. Princeton University Press.
MacLean, L. C., Sanegre, E. O., Zhao, Y., & Ziemba, W. T. (2004). Capital growth with security. Journal of Economic Dynamics and Control, 28(4), 937-954.
MacLean, L. C., Thorp, E. O., & Ziemba, W. T. (2011). The Kelly Capital Growth Investment Criterion: Theory and Practice. World Scientific.
Michaud, R. O. (1989). The Markowitz optimization enigma: Is 'optimized' optimal? Financial Analysts Journal, 45(1), 31-42.
Pabrai, M. (2007). The Dhandho Investor: The Low-Risk Value Method to High Returns. John Wiley & Sons.
Shannon, C. E. (1948). A mathematical theory of communication. Bell System Technical Journal, 27(3), 379-423.
Tharp, V. K. (2007). Trade Your Way to Financial Freedom (2nd ed.). McGraw-Hill.
Thorp, E. O. (2006). The Kelly criterion in blackjack sports betting, and the stock market. In L. C. MacLean, E. O. Thorp, & W. T. Ziemba (Eds.), The Kelly Capital Growth Investment Criterion: Theory and Practice (pp. 789-832). World Scientific.
Van Tharp, K. (2007). Trade Your Way to Financial Freedom (2nd ed.). McGraw-Hill Education.
Vince, R. (1992). The Mathematics of Money Management: Risk Analysis Techniques for Traders. John Wiley & Sons.
Vince, R., & Zhu, H. (2015). Optimal betting under parameter uncertainty. Journal of Statistical Planning and Inference, 161, 19-31.
Ziemba, W. T. (2003). The Stochastic Programming Approach to Asset, Liability, and Wealth Management. The Research Foundation of AIMR.
Further Reading
For comprehensive understanding of Kelly Criterion applications and advanced implementations:
MacLean, L. C., Thorp, E. O., & Ziemba, W. T. (2011). The Kelly Capital Growth Investment Criterion: Theory and Practice. World Scientific.
Vince, R. (1992). The Mathematics of Money Management: Risk Analysis Techniques for Traders. John Wiley & Sons.
Thorp, E. O. (2017). A Man for All Markets: From Las Vegas to Wall Street. Random House.
Cover, T. M., & Thomas, J. A. (2006). Elements of Information Theory (2nd ed.). John Wiley & Sons.
Ziemba, W. T., & Vickson, R. G. (Eds.). (2006). Stochastic Optimization Models in Finance. World Scientific.

Signal Stack MeterWhat it is
A lightweight “go or no‑go” meter that combines your manual read of Structure, Location, and Momentum with automatic context from volatility and macro timing. It surfaces a single, tradeable answer on the chart: OK to engage or Standby.
Why traders like it
You keep your discretion and nuance, and the meter adds guardrails. It prevents good trade ideas from being executed in the wrong conditions.
What it measures
Manual buckets you set each day: Structure, Location, Momentum from 0 to 2
Volatility from VIX, term structure, ATR 5 over 60, and session gaps
Time windows for CPI, NFP, and FOMC with ET inputs and an exchange‑offset
Total score and a simple gate: threshold plus a “strong bucket” rule you choose
How to use in 30 seconds
Pick a preset for your market.
Set Structure, Location, Momentum to 0, 1, or 2.
Leave defaults for the auto metrics while you get a feel.
Read the header. When it says OK to engage, you have both your read and the context.
Defaults we recommend
OK threshold: 5
Strong bucket rule: Either Structure or Location equals 2
VIX triggers: 22 and 1.25× the 20‑SMA
Term mode: Diff at 0.00 tolerance. Ratio mode at 1.00+ is available
ATR 5/60 defense: 1.25. Offense cue: 0.85 or lower
ATR smoothing: 1
Gap mode: RTH with 0.60× ATR5 wild gap. ON wild range at 0.80× ATR5
CPI window 08:25 to 08:40 ET. FOMC window 13:50 to 14:30 ET
ET to exchange offset: −60 for CME index futures. Set to 0 for NYSE symbols like SPY
Alert cadence: Once per RTH session. Snooze first 30 minutes optional
New since the last description
Parity with Defense Mode for presets, sessions, ratio vs diff term mode, ATR smoothing, RTH‑key cadence, and snooze options
Event windows in ET with a simple offset to your exchange time
Alternate row backgrounds and full color control for readability
Exposed series for automation: EngageOK(1=yes) plus TotalScore
Debug toggle to see ATR ratio, term, and gap measurements directly
Notes
Dynamic alerts require “Any alert() function call”.
The meter is designed to sit opposite Defense Mode on the chart. Use the position input to avoid overlap.

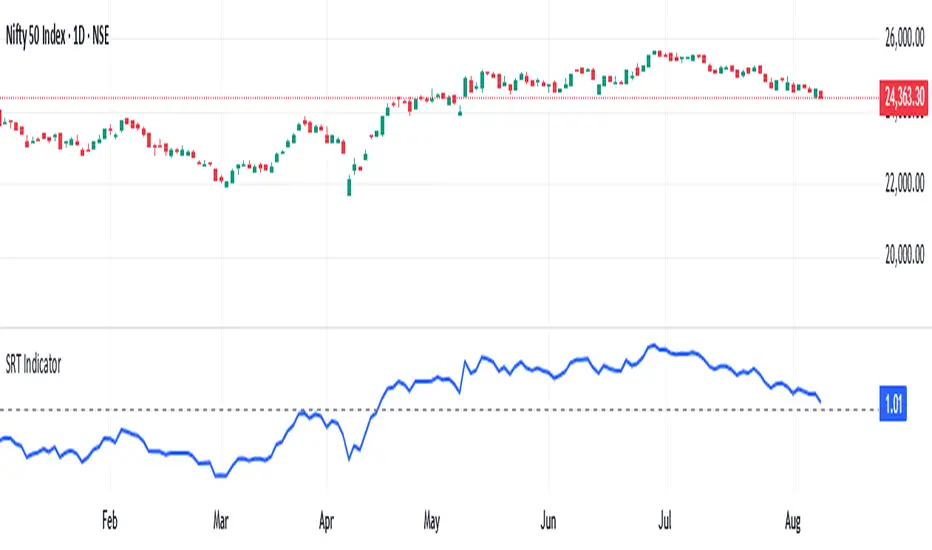
SRT Indicatorthis indicator simply plots the value of SRT below the chart. it is current spot price of nifty divided by its 124 daily SMA. typically one invests when srt is 0.7 to 0.9 and exits when it crosses 1.25. this can be adjusted according to our risk appetite.
Market Regime Matrix [Alpha Extract]A sophisticated market regime classification system that combines multiple technical analysis components into an intelligent scoring framework to identify and track dominant market conditions. Utilizing advanced ADX-based trend detection, EMA directional analysis, volatility assessment, and crash protection protocols, the Market Regime Matrix delivers institutional-grade regime classification with BULL, BEAR, and CHOP states. The system features intelligent scoring with smoothing algorithms, duration filters for stability, and structure-based conviction adjustments to provide traders with clear, actionable market context.
🔶 Multi-Component Regime Engine Integrates five core analytical components: ADX trend strength detection, EMA-200 directional bias, ROC momentum analysis, Bollinger Band volatility measurement, and zig-zag structure verification. Each component contributes to a sophisticated scoring system that evaluates market conditions across multiple dimensions, ensuring comprehensive regime assessment with institutional precision.
// Gate Keeper: ADX determines market type
is_trending = adx_value > adx_trend_threshold
is_ranging = adx_value <= adx_trend_threshold
is_maximum_chop = adx_value <= adx_chop_threshold
// BULL CONDITIONS with Structure Veto
if price_above_ema and di_bullish
if use_structure_filter and isBullStructure
raw_bullScore := 5.0 // MAXIMUM CONVICTION: Strong signals + Bull structure
else if use_structure_filter and not isBullStructure
raw_bullScore := 3.0 // REDUCED: Strong signals but broken structure
🔶 Intelligent Scoring System Employs a dynamic 0-5 scale scoring mechanism for each regime type (BULL/BEAR/CHOP) with adaptive conviction levels. The system automatically adjusts scores based on signal alignment, market structure confirmation, and volatility conditions. Features decision margin requirements to prevent false regime changes and includes maximum conviction thresholds for high-probability setups.
🔶 Advanced Structure Filter Implements zig-zag based market structure analysis using configurable deviation thresholds to identify significant pivot points. The system tracks Higher Highs/Higher Lows (HH/HL) for bullish structure and Lower Lows/Lower Highs (LL/LH) for bearish structure, applying structure veto logic that reduces conviction when price action contradicts the underlying trend framework.
// Define Market Structure (Bull = HH/HL, Bear = LL/LH)
isBullStructure = not na(last_significant_high) and not na(prev_significant_high) and
not na(last_significant_low) and not na(prev_significant_low) and
last_significant_high > prev_significant_high and last_significant_low > prev_significant_low
isBearStructure = not na(last_significant_high) and not na(prev_significant_high) and
not na(last_significant_low) and not na(prev_significant_low) and
last_significant_low < prev_significant_low and last_significant_high < prev_significant_high
🔶 Superior Engine Components Features dual-layer regime stabilization through score smoothing and duration filtering. The score smoothing component reduces noise by averaging raw scores over configurable periods, while the duration filter requires minimum regime persistence before confirming changes. This eliminates whipsaws and ensures regime transitions represent genuine market shifts rather than temporary fluctuations.
🔶 Crash Detection & Active Penalties Incorporates sophisticated crash detection using Rate of Change (ROC) analysis with severity classification. When crash conditions are detected, the system applies active penalties (-5.0) to BULL and CHOP scores while boosting BEAR conviction based on crash severity. This ensures immediate regime response to major market dislocations and drawdown events.
// === CRASH OVERRIDE (Active Penalties) ===
is_crash = roc_value < crash_threshold
if is_crash
// Calculate crash severity
crash_severity = math.abs(roc_value / crash_threshold)
crash_bonus = 4.0 + (crash_severity - 1.0) * 2.0
// ACTIVE PENALTIES: Force bear dominance
raw_bearScore := math.max(raw_bearScore, crash_bonus)
raw_bullScore := -5.0 // ACTIVE PENALTY
raw_chopScore := -5.0 // ACTIVE PENALTY
❓How It Works
🔶 ADX-Based Market Classification The Market Regime Matrix uses ADX (Average Directional Index) as the primary gatekeeper to distinguish between trending and ranging market conditions. When ADX exceeds the trend threshold, the system activates BULL/BEAR regime logic using DI+/DI- crossovers and EMA positioning. When ADX falls below the ranging threshold, CHOP regime logic takes precedence, with maximum conviction assigned during ultra-low ADX periods.
🔶 Dynamic Conviction Scaling Each regime receives conviction ratings from UNCERTAIN to MAXIMUM based on signal alignment and score magnitude. MAXIMUM conviction (5.0 score) requires perfect signal alignment plus favorable market structure. The system progressively reduces conviction when signals conflict or structure breaks, ensuring traders understand the reliability of each regime classification.
🔶 Regime Transition Management Implements decision margin requirements where new regimes must exceed existing regimes by configurable thresholds before transitions occur. Combined with duration filtering, this prevents premature regime changes and maintains stability during consolidation periods. The system tracks both raw regime signals and final regime output for complete transparency.
🔶 Visual Regime Mapping Provides comprehensive visual feedback through colored candle overlays, background regime highlighting, and real-time information tables. The system displays regime history, conviction levels, structure status, and key metrics in an organized dashboard format. Regime changes trigger immediate visual alerts with detailed transition information.
🔶 Performance Optimization Features efficient array management for zig-zag calculations, smart variable updating to prevent recomputation, and configurable debug modes for strategy development. The system maintains optimal performance across all timeframes while providing institutional-grade analytical depth.
Why Choose Market Regime Matrix ?
The Market Regime Matrix represents the evolution of market regime analysis, combining traditional technical indicators with modern algorithmic decision-making frameworks. By integrating multiple analytical dimensions with intelligent scoring, structure verification, and crash protection, it provides traders with institutional-quality market context that adapts to changing conditions. The sophisticated filtering system eliminates noise while preserving responsiveness, making it an essential tool for traders seeking to align their strategies with dominant market regimes and avoid adverse market environments.

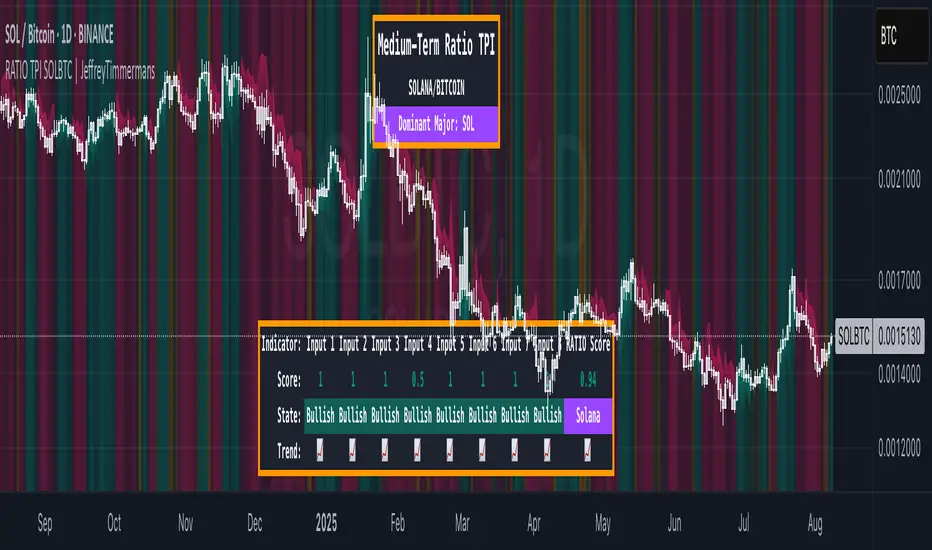
RATIO TPI SOLETH | JeffreyTimmermansSOLETH Ratio Trend Probability Indicator
Medium-Term Trend Assessment | Dominant Major Detector: The SOLETH Ratio TPI is a medium-term trend-following tool designed to measure the performance relationship between Solana and Ethereum — two of the leading smart contract platforms in the crypto market. By tracking the SOLETH ratio, this indicator determines which of the two is acting as the dominant major in the current market environment.
Rather than focusing on absolute price movements, the SOLETH Ratio TPI isolates relative strength. An upward-trending ratio means Solana is outperforming Ethereum, while a downward trend means Ethereum is taking the lead.
Key Features
Dominant Major Identification:
The indicator’s primary function is to determine leadership between Solana and Ethereum:
SOL Dominant: SOLETH ratio trending up
ETH Dominant: SOLETH ratio trending down
Neutral: No clear leader
8 Trend-Following Inputs:
Integrates 8 carefully selected medium-term trend-following signals into a composite score for clarity and accuracy in dominance detection.
Score-Based Regime Classification:
Score > 0.1 → SOL in relative uptrend → Dominant Major: SOL
Score < -0.1 → ETH in relative uptrend → Dominant Major: ETH
Between -0.1 and 0.1 → Neutral → No clear dominance
Dynamic Visual Interface:
Background colors change according to the dominant asset.
Bottom dashboard displays the status of all inputs, the composite score, and the determined dominance label.
Use Cases:
Smart Contract Sector Rotation: Identify leadership shifts between Solana and Ethereum to guide allocation within the L1 ecosystem.
Sector Sentiment Insight: Dominance changes often precede broader capital flows into or out of each ecosystem.
Multi-Timeframe Confirmation: Combine with broader market LTPI and MTPI tools to reinforce conviction in rotation-based strategies.
Conclusion
The SOLETH Ratio TPI condenses the competition between two of crypto’s top smart contract platforms into one clear, actionable view. By aggregating 8 powerful medium-term trend-following inputs, it delivers a precise assessment of which chain currently leads the market.

RATIO TPI SOLBTC | JeffreyTimmermansSOLBTC Ratio Trend Probability Indicator
Medium-Term Trend Assessment | Dominant Major Detector: The SOLBTC Ratio TPI is a medium-term trend-following indicator designed to measure the relative strength between Solana and Bitcoin — two of the most influential assets in the crypto market. By analyzing the SOLBTC ratio, this tool identifies which of the two is currently the dominant major in the market cycle.
Unlike standard price-based analysis, this indicator focuses on relative dominance. When Solana outperforms Bitcoin, the ratio trends upward, signaling SOL dominance. When Bitcoin outperforms Solana, the ratio trends downward, signaling BTC dominance.
Key Features
Dominant Major Identification:
The primary goal of this TPI is to determine whether Solana or Bitcoin is leading the market:
SOL Dominant: SOLBTC is trending up
BTC Dominant: SOLBTC is trending down
Neutral: No clear leader in the current cycle
8 Trend-Following Inputs:
Combines 8 carefully selected medium-term trend-following indicators into a single composite score for clear and actionable dominance detection.
Score-Based Regime Classification:
Score > 0.1 → SOL in relative uptrend → Dominant Major: SOL
Score < -0.1 → BTC in relative uptrend → Dominant Major: BTC
Between -0.1 and 0.1 → Neutral → No clear dominance
Dynamic Visuals:
Background colors shift to match the dominant asset
Bottom dashboard displays the state of each input, the composite score, and the resulting dominance label
Use Cases:
Rotation Strategies: Identify when capital is rotating between Solana and Bitcoin to optimize positioning.
Market Leadership Signals: Use dominance changes as a leading indicator for broader altcoin cycles and sentiment shifts.
Multi-Timeframe Confirmation: Pair with LTPI and STPI for higher conviction in directional bias.
Conclusion
The SOLBTC Ratio TPI distills the relationship between Solana and Bitcoin into one simple question: Who is leading right now? By combining 8 powerful trend-following inputs into a clear dominance score, it provides traders and investors with a precise, medium-term view of market leadership.
T1KR – PreMarket High BreakTracks and alerts when price breaks above the pre-market high (04:00–09:30 ET). This level often acts as a key trigger for momentum runs, attracting algorithmic buying, stop orders, and breakout traders. Useful for identifying strong continuation moves at or after the market open.

Momentum RS | QuantumResearch🚀 Momentum RS | QuantumResearch
Momentum RS is a relative strength-based momentum rotation system developed by QuantumResearch. Unlike traditional relative strength tools that rely on static ratio comparisons (e.g., ETH/BTC), this script focuses on trend confirmation and momentum acceleration to dynamically rotate into the strongest trending asset across a customizable basket.
🔍 Key Highlights
✅ Trend-Validated Momentum Scoring:
Each asset is scored using trend following indicator. Only assets in a confirmed uptrend are eligible for rotation. No blind allocation into a pumping asset without trend validation.
🔄 Dynamic Asset Rotation:
The system selects the asset with the highest momentum among those currently in a bullish TPI state, switching only when a new asset becomes dominant.
💹 Backtestable Strategy:
Includes full equity curve tracking, swap count, and customizable fees. Automatically calculates:
Sharpe Ratio
Sortino Ratio
Omega Ratio
Max Drawdown
Net Profit vs HODL
📈 Momentum Visualization:
Each selected asset’s momentum score is displayed in a custom performance table, along with current trend signal (LONG or CASH) and overall strategy metrics.
⚙️ How It Works
Select up to 4 assets (e.g., BTC, ETH, SOL, SUI).
For each, the script computes:
Trend State via trend following indicator (1 = Bullish, -1 = Bearish)
Momentum Score to asses the winner
The strategy allocates 100% exposure to the asset with the highest momentum among those in an uptrend.
If no asset is trending, the strategy holds CASH.
📊 What Makes This Unique?
Most “relative strength” indicators compare the price ratio between two assets over time. This often leads to late rotations.
This tool is different:
It uses momentum and trend detection, not simple ratio analysis.
It’s designed to avoid false breakouts by requiring trend confirmation before rotating.
Ideal for rotational trading, momentum investing, and trend-following systems.
🧠 Best Use Cases
Rotational Crypto Strategies (BTC vs ETH vs SOL vs SUI)
Smart Trend Allocation with drawdown awareness
Backtest-ready edge validation vs HODL strategies
Low-frequency rebalancing with high signal quality
🛑 Disclaimer
This indicator is for educational purposes only. It does not constitute financial advice. Past performance does not guarantee future returns. Always use proper risk management.

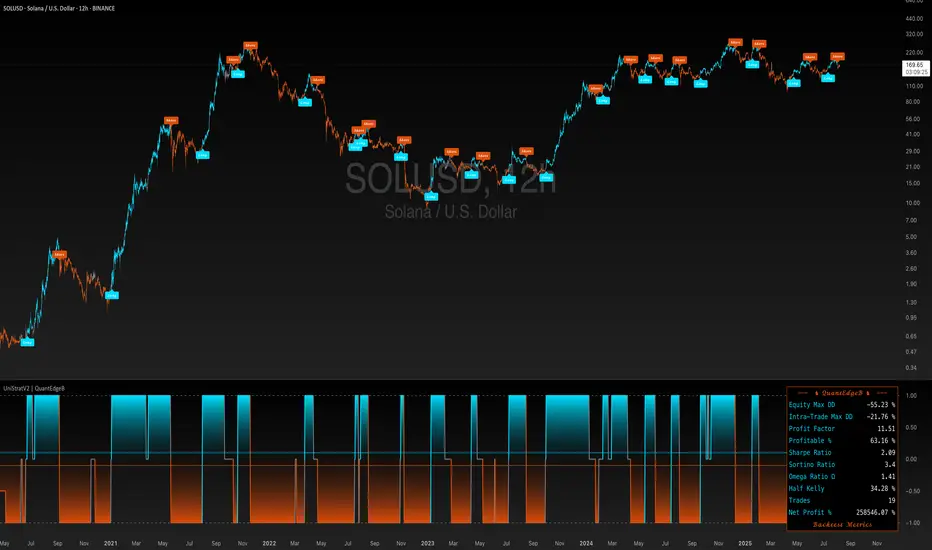
UniStratV2 | QuantEdgeBUniversal Strategy V2 | QuantEdgeB
🔍 What is the Universal Strategy?
A dynamic, multi-engine trading framework engineered to adapt across asset classes, timeframes, and market conditions. It fuses multiple complementary signal engines into a single, unified decision model—automatically balancing speed, smoothness, momentum scoring, and breakout precision.
⚙️ Core Characteristics
• Multi-Engine Logic: Combines fast-reacting trend detection, adaptive smoothing, statistical momentum scoring, and volatility-normalized breakout confirmation.
• Modular Architecture: Each engine operates independently yet contributes to a unified signal index—allowing plug-and-play customization or replacement of individual components.
• Adaptive Thresholds: Dynamically adjusts trigger levels based on market volatility, percentile bands, or standard-deviation filters, ensuring robust performance in both quiet and turbulent conditions.
• Unified Signal Aggregation: Individual engine outputs (bullish/bearish) are averaged into a single trend, minimizing noise and reinforcing conviction.
💡 Key Benefits
• Balance of Reactivity & Reliability: Fast-acting modules catch early trend shifts, while smoother, statistical layers confirm and filter false moves.
• Versatility Across Markets: Designed to work equally well in trending, range-bound, or high-volatility environments, and across equities, FX, commodities, and crypto.
• Customizable & Extensible: Users can tailor the number and type of engines, threshold methodologies, and signal-aggregation rules to match their style and risk tolerance.
• Transparency & Confidence: A real-time signal dashboard shows each engine’s contribution and the overall strategy, offering clear insight into what drives the strategy’s decisions.
📊 Generic Use Cases
1. Trend Capture
Identify and ride sustained directional moves with early-warning and confirmation engines.
2. Breakout Trading
Detect and validate volatility expansions while filtering out whipsaws.
3. Momentum Assessment
Quantify the strength behind price moves to distinguish fleeting spikes from genuine trends.
4. Cross-Asset Rotation
Apply the same framework to multiple symbols—allocating capital to the strongest opportunities.
📌 In Summary
The Universal Strategy V2 | QuantEdgeB is a framework, not a single indicator. By orchestrating diverse, forward-tested methodologies into one cohesive engine, it delivers adaptive precision, signal clarity, and robust performance—empowering traders to navigate any market environment with data-driven confidence.
🔹 Disclaimer: Past performance is not indicative of future results. Always backtest and align any strategy with your objectives and risk tolerance before live trading.

Futures PnL Levels [MFFU]Futures PnL Levels is a purpose-built indicator designed specifically for futures traders using TradingView. Whether you're backtesting strategies, planning trades, or managing live positions, this tool gives you a clean, visual overlay of your Profit & Loss directly on the chart, based on your custom input.
Why This Indicator is Different
If you trade using Tradovate through TradingView , you’ve likely noticed a major limitation: TradingView does not show your real-time PnL. This has made it nearly impossible to track live profits and losses within the charting platform until now.
Futures PnL Levels bridges that gap . By inputting your entry, TP, SL, and contract size, you can now replicate a live, dynamic PnL experience directly on your TradingView chart. This solves a long-standing issue for Tradovate users and significantly improves real-time trade awareness.
Key Features
Trade Modeling
Define your trade parameters upon activating the indicator:
Set your entry price , profit target , and stop loss
Input the number of contracts to reflect real-world position sizing
Visual PnL Display
Auto-drawing Take Profit (TP) , Stop Loss (SL) , and Breakeven levels
Live PnL tracking that moves with current market price
Optional live display of floating PnL values and breakeven zones
Styling & Display Options
Adjust line colors and widths for TP/SL/Breakeven
Differentiate real-time positive vs. negative PnL with separate colors
Toggle visibility of label lines and full readouts
Customize label size , price rounding , and other chart elements
Position Summary Table
View a compact summary of your trade parameters
Float this table anywhere on the chart (e.g., top right )
Provides an at-a-glance view of your current setup
Built for CME Futures
Fully compatible with CME instruments like ES, NQ, CL, GC , and more
Supports both long and short positions
Works with auto-detected or manually defined futures contracts
Who It’s For
Futures traders looking to plan trades visually before entering a position
Backtesters and strategy developers who need PnL clarity during analysis
Active traders using Tradovate through TradingView who are missing live PnL tracking
Why Use Futures PnL Levels ?
Unlike generic TP/SL indicators, this tool offers a true replacement for missing PnL visibility in the TradingView + Tradovate ecosystem. Instead of manually inputting your profits, this indicator lets you see your trade’s performance unfold in real time — directly on the chart .
Whether you're preparing a precise entry or managing an open position, Futures PnL Levels adds structure, confidence, and clarity to every trade.

Risk & Money Calculator / Fixed Losses This indicator is designed for people who want to control their losses as precisely as possible!
It allows you to quickly calculate the potential loss on a position, taking commission into account. It's designed so that you can have a fixed loss with different stop-loss lengths by adjusting the position size, expressed in currency!
Next to the Stop Loss price, you'll see the percentage distance to the stop and the actual loss, including the double commission (for opening and closing).
The indicator is very easy to use. You select the trade direction, enter the entry price, and the Stop Loss price. Optionally, you can set a Take Profit price to visualize the profit percentage! Since commission is charged both when opening and closing a position, you need to specify the size of your one-way commission.
Important!
• DON'T FORGET ABOUT LIQUIDATION, WHICH HAPPENS BEFORE THE CORRESPONDING STOP LOSS PERCENTAGE IS REACHED!
• YOU ARE SOLELY RESPONSIBLE FOR YOUR CALCULATIONS AND LOSSES!
• IF YOU HAVE ANY WISHES OR SUGGESTIONS RELATED TO THE INDICATOR'S OPERATION, I'M READY TO LISTEN AND POSSIBLY MAKE CHANGES TO ITS FUNCTIONALITY!

Crypto Compass | QuantEdgeBIntroducing Crypto Compass | QuantEdgeB
Overview
Crypto Compass | QuantEdgeB is a multi-asset market regime indicator that decodes the collective momentum and sentiment of the cryptocurrency space. By computing correlation-adjusted valuation across a basket of major tokens and blending them with the chart’s own momentum pulse, it delivers a real-time “compass” of risk-on/off regimes. Plotted as dual EMAs and color-coded candles, and accompanied by a comprehensive dashboard table, Crypto Compass guides traders through broad market cycles instead of isolated price swings.
Key Features
• Correlation-Adjusted Valuation Aggregation
Computes individual valuation for the top 30 Market Cap tokens plus total-market indices; weights each by its correlation to Bitcoin, then averages.
• Large-Cap-Only Mode
Optionally restricts the basket to the top 10 by market cap for a streamlined “blue-chip” sentiment readout.
• Composite Momentum Blend
Mixes the basket average with the chart’s own valuation to capture both cross-asset and local momentum.
• Dual EMA Overlay & Candle Coloring
Plots 12- and 21-period EMAs colored by the composite valuation gradient; candles are likewise color-filled to reflect regime strength.
• Interactive Dashboard Table
Live “Crypto Compass Dashboard” shows, for each asset:
o Current value & prior bar value
o Rate of Change (direction arrow)
o Duration since last EMA crossover
o Current trend state (“Bullish” / “Bearish”)
• Regime Labels & Risk-On/Off Signal
Translates the composite valuation into four regimes—Contraction, Weak, Recovery, Strong—with a clear risk-on/off indicator banner.
How It Works
1. Data Fetch & Valuation Computation
o Retrieves price and a simple TPI (12 vs 21 EMA cross) for each symbol via request.security.
o Calculates a rolling standard deviation over a lookback (length) for each asset and the chart.
2. Correlation Weighting
o Measures each asset’s correlation to Bitcoin
o Multiplies each asset’s value by its correlation coefficient to emphasize high-beta relationships.
3. Basket Averaging
o Averages the top-N weighted value (10 if “Large Cap Only” is true, else all )
o Blends the final average with the chart’s own valuation
4. Visual & Table Overlays
o EMAs (12, 21) and candles are colored via a gradient tied to zsumad thresholds.
o A table grid at the bottom-right displays per-asset metrics and computes duration since TPI crossovers to flag trend longevity.
5. Regime Mapping
≤ –1.5 ⇒ Contraction (Risk Off)
–1.5 to 0 ⇒ Weak (Risk Off)
0 to 1.5 ⇒ Recovery (Risk On)
1.5 ⇒ Strong (Risk On)
How to Use / Who Should Use It
• Crypto Portfolio Managers seeking a holistic market-wide directional bias before allocating capital.
• Swing & Position Traders looking to confirm if cross-asset strength aligns with their primary coin.
• Systematic Strategy Developers integrating regime filters into algorithmic models.
• Risk-Conscious Allocators wanting an early warning on risk-off contractions vs. risk-on expansions.
Default Settings
• Plot EMA: On
• Value Lookback Length: 90
• BTC Correlation Length: 195
• Large Cap Only: True
Conclusion
Crypto Compass distills complex cross-asset dynamics into a single, actionable gauge. By combining correlation-weighted valuation, blended momentum, and dynamic regime mapping—visualized through color-coded EMAs, candles, and a rich dashboard—it empowers traders to navigate the broader crypto market cycle with clarity and confidence.
🔹 Disclaimer: Past performance is not indicative of future results. No trading strategy can guarantee success in financial markets.
🔹 Strategic Advice: Always backtest, optimize, and align parameters with your trading objectives and risk tolerance before live trading.

RATIO TPI ETHBTC | JeffreyTimmermansETHBTC Ratio Trend Probability Indicator
Medium-Term Trend Assessment | Dominant Major Detector: The ETHBTC Ratio TPI is a medium-term trend-following indicator designed to measure the relative strength between Ethereum and Bitcoin — the two most dominant assets in crypto. By analyzing the ETHBTC ratio, this tool provides insights into which of the two is currently leading the market trend.
Unlike absolute price indicators, this tool tracks relative dominance. When Ethereum outperforms Bitcoin, the ratio trends upward, signaling ETH dominance. When Bitcoin outperforms Ethereum, the ratio trends downward, signaling BTC dominance.
Key Features
Dominant Major Identification:
The core purpose of this TPI is to determine which asset — Ethereum or Bitcoin — is the dominant major in the current crypto cycle.
ETH Dominant: ETHBTC is trending up
BTC Dominant: ETHBTC is trending down
Neutral: No clear directional edge
8 Trend-Following Inputs:
The indicator aggregates 8 hand-picked, medium-term trend-following metrics into a single score that simplifies the ETHBTC trend assessment.
Score-Based Regime Classification:
Score > 0.1 → ETH is in relative uptrend → Dominant Major: ETH
Score < -0.1 → BTC is in relative uptrend → Dominant Major: BTC
Between -0.1 and 0.1 → Neutral trend → No clear dominance
Dynamic Visuals:
Background color adapts to the dominant asset
Score, trend state per input, and composite result are shown in a clean dashboard
Use Cases:
Rotation Strategy Insight: Understand whether capital is flowing into Ethereum or Bitcoin to adjust your portfolio positioning accordingly.
Dominance-Based Macro Timing: Use the dominance shift as a leading signal for broader altcoin cycles.
Multi-Timeframe Confirmation: Combine with LTPI (Long-Term) and STPI (Short-Term) to build directional conviction.
Conclusion
The ETHBTC Ratio TPI is a highly focused tool that simplifies the complex relationship between Ethereum and Bitcoin into one clear output: who is currently leading the crypto market. With 8 inputs driving a composite trend score and a dynamic dominance label, this indicator is essential for anyone looking to time ETH vs BTC rotations with precision.

Sat Stacking Strategies Simulation (SSSS)Sat Stacking Strategies Simulation (SSSS)
This indicator simulates and compares different Bitcoin stacking strategies over time, allowing you to visualize performance, cost basis, and stacking behavior directly on your chart.
Core Features:
Three Stacking Strategies
• Trend-Based – Stack only when price is above/below a long-term SMA.
• Stack the Dip – Buy during sharp pullbacks or oversold conditions.
• Price Zone – Stack only in “cheap”, “fair”, or “expensive” zones based on a simulated Short-Term Holder (STH) cost basis.
Always Stack Benchmark
Compare your chosen strategy against a simple “Always Stack” approach for a real-world DCA reference.
Performance Metrics Table
Track:
• Total Fiat Added
• Total BTC Accumulated
• Current Value
• Average Cost per BTC
• PnL %
• CAGR
• Sharpe Ratio & Stdev
• Stack Events & Time Underwater
Advanced Options
• Simulate cash-secured puts on unused fiat.
• Simulate covered calls on BTC holdings.
• Roll over unused stacking amounts for future buys.
This tool is designed for Bitcoiners, stackers, and DCA enthusiasts who want to backtest and visualize their stacking plan—whether you keep it simple or go full quant.
Sometimes the best alpha is just showing up every week with your wallet open… and occasionally wearing a helmet. 🪖💰

SAFE Leverage x100Safe Leverage x100 is an indicator designed to help traders choose prudent , realistic, and dynamic leverage , adapted to the timeframe and volatility of the asset they are trading.
B ased on rigorous statistical and practical observation , this indicator does not propose fixed rules, but rather provides a visual estimate of the maximum leverage a typical trade can tolerate without being liquidated , based on the current candle's movement range. At the same time, it automatically suggests a more conservative leverage (by default, half of the maximum) for more controlled risk management.
Just identify which asset accepts the maximum x100 and win.!!
