COT3 - Flip Strength Index - Invincible3This indicator uses the TradingView COT library to visualize institutional positioning and potential sentiment or trend shifts. It compares the long% vs short% of commercial and non-commercial traders for both Pair A and Pair B, helping traders identify trend strength, market overextension, and early reversal signals.
🔷 COT RSI
The COT RSI normalizes the net positioning difference between non-commercial and commercial traders over (N=13, 26, and 52)-week periods. It ranges from 0 to 100, highlighting when sentiment is at bullish or bearish extremes.
COT RSI (N)= ((NC - C)−min)/(max-min) x100
🟡 COT Index
The COT Index tracks where the current non-commercial net position lies within its 1-year and 3-year historical range. It reflects institutional accumulation or distribution phases.
Strength represents the magnitude of that positioning bias, visualized through normalized RSI-style metrics.
COT Index (N)= (NC net)/(max-min) x100
🔁 Flip Detection
Flip refers to the crossovers between long% and short%, indicating a change in directional bias among trader groups. When long positions exceed shorts (or vice versa), it signals a possible market flip in sentiment or trend.
For example, Pair B commercial flip is calculated as:
Long% = (Long/Open Interest)×100
Short% = (Short/Open Interest)×100
Flip = Long%−Short%
A bullish flip occurs when long% overtakes short%, and vice versa for a bearish flip. These flips often precede price trend changes or confirm sentiment breakouts.
Flip captures how far current positioning deviates from historical norms — highlighting periods of institutional overconfidence or exhaustion, often leading to significant market turns.
This combination offers a multi-layered edge for identifying when smart money is flipping direction, and whether that flip has strong conviction or is likely to fade.
..........................................................................................................................................................
Positions

WhaleCrew Long/Short Ratio (Bitfinex)Shows the long/short ratio (amount of longs per short) on ANY Bitfinex pair (BTCUSD, ETHUSD, ADAUSD, ...).

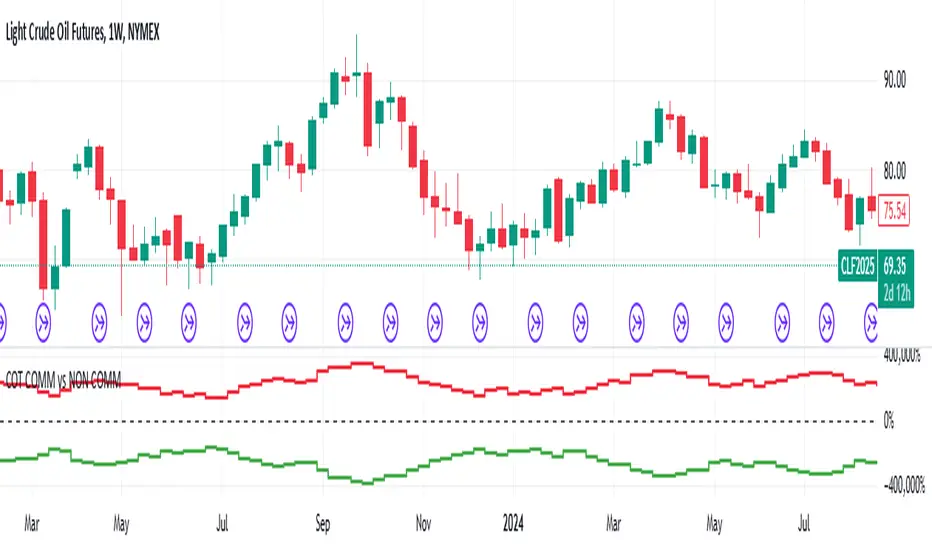
COT Net Non-Commercials vs Commercials (Updated MTF Non-Repaint)Hello there,
With this script, you can see CFTC COT Non Commercial and Commercial Positions together.
This way, you can analyze net values greater than 0 and smaller, as well as very dense and very shallow positions of producers and speculators.
Green - Non Commercials - Speculators
Red - Commercials - Producers
This script is multi time-frame and non-repaint script.
Data pulled through Quandl.
And the latest version codes have been used.
As time goes by, I will try to make useful modifications to this scheme.
Regards.
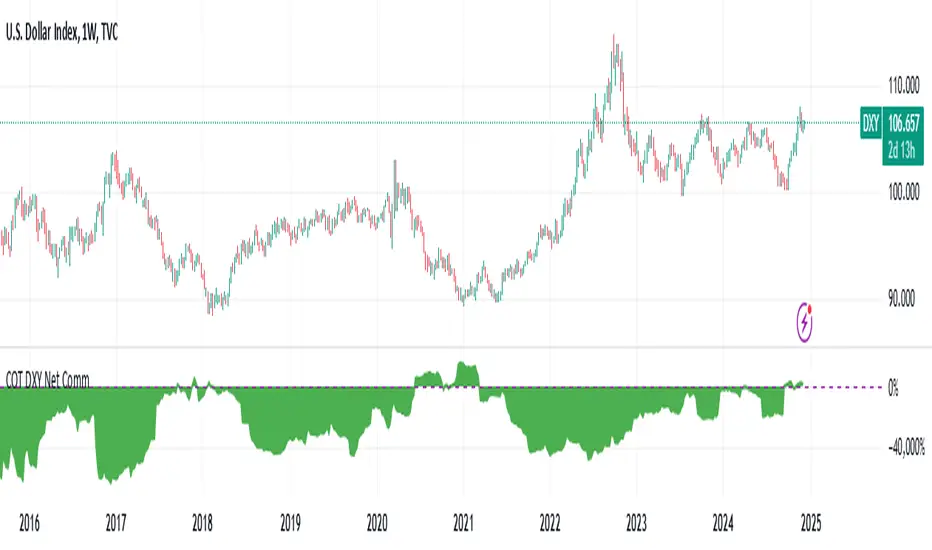
DXY COT Commercial Net PositionsThis script was created due to the lack of position of US Dollar Index Futures (DXY).
It is designed to perform a much more liquid and inclusive position analysis.
As the exponential ratios do not mean anything to positions, weights are used as multipliers instead of exponential functions.
Swedish Krona (SEK) Futures are not directly quoted in Quandl, therefore weighted in Euro / dollar parity.
By perceiving these positions as inverse correlations, you can also identify where the world economy is doing well.
COT Commercial Net Positions are calculated as (Short - Long) because of Commercials act according to the reverse of the market.
In this way, you can follow up normally instead of reverse correlation.
Because except in extreme cases, in which case capitals usually shift to Gold.
This is not the case, since there is no capital inflow to other currencies, it is not a strong sell position to the dollar index.
When there is a shift in bonds, we see the effect of the dollar in general.
I created for the Dollar Index in order not to deviate from the concept.
I wanted to share it with everyone as I thought that you have important clues about how investors take positions.
Modified currency weights :
Euro : % 61.8
Japanese Yen : % 13.6
British Pound : %11.9
Canadian Dollar : % 9.1
Swiss Franc : % 3.6
NOTE : You can use it for all instruments except crypto coins, especially US Dollar Index (DXY).
Since the COT data is taken, it will not repaint in 1 week (1W) timeframe.
The log can also be repaint according to the time of data publication.
It will repaint in lower time frames.
I hope it will help your analysis and your scripts,regards.
COT Commercial Positions (Updated)
This script aims to look at the markets from a manufacturer's point of view.
Producers or large enterprises gradually sell their goods as the price increases.
Because both the amount of product and position in their hands is too high, otherwise they can not find buyers, and they have to make a safe profit.
Therefore, I have shown short positions in green and long positions in red.
Blue is the net position formed by subtracting long positions from short positions.
This script is created with the latest Quandl data number codes.
Please let me know if you see a missing or a code update.
I recommend using it in a weekly (1W) time frame.
CAUTION : Since Bitcoin producer positions are very sparse, speculative long positions have been preferred in Bitcoin.
If you're looking for Bitcoin,
select Bitcoin from the menu.
Regards.

Bitfinex BTC Longs & Shorts Positions Proportion ValueBTCUSDLONGS BTCUSDSHORTS Proportion- Bitfinex BTC Longs & Shorts Positions Proportion Value

Bitfinex BTC Longs & Shorts Positions Difference ValueBTCUSDLONGS BTCUSDSHORTS Difference- Bitfinex BTC Longs & Shorts Positions Difference Value

Bitfinex BTC margin position differencesIf green is over the red it means that longs are currently dominant on BitFinex for BTC.
Same goes if red is over green just that shorts are dominant.
If the green is over red the green will show how many more longs there are than shorts and if you hover over the red you will see how many more shorts there are compared to longs
Vice versa if red is over green .
You can change to a histogram, area, line or any other style of chart in the settings of the indicator
The black dashed line in the middle is 0 aka if u see the indicator go there it means there are an equal amount of longs and shorts
