Position Size ToolPosition Size Tool
What it does:
Shows a small on-chart table that converts per-ticker dollar amounts into share counts (shares = amount ÷ current price) for up to 4 configurable tickers.
Inputs (indicator settings)
Ticker 1–4 — select the symbol (TradingView will show the exchange-qualified form like BATS:TQQQ in the settings).
Ticker N $ Amount — dollar amount to convert into shares for that ticker.
Show Ticker N — toggle each row on/off.
Table Text Color — color of the table text.
Table Position — screen location (Top/ Middle/ Bottom × Left/Center/Right).
Font Size — Small / Medium / Large.
Show Empty Top Row — optional spacer row.
What the table displays
Left column: the ticker symbol only (the script strips the exchange prefix for display, so BATS:TQQQ appears as TQQQ in the table).
Right column: the calculated share count, formatted to two decimal places (or "—" if price is not available or zero).
Table updates on the chart’s timeframe using live/last bar prices.
How to use
Add the indicator to a chart.
Open the indicator’s settings panel.
In Ticker 1–4, type/select the symbols you want (you may see the exchange prefix there; that’s TradingView’s UI).
Enter the dollar amounts for each ticker.
Use Show Ticker N to hide/show rows.
Adjust text color, font size, and table position as desired.
Notes
The settings field will always show the exchange-qualified symbol (TradingView behavior); the script strips the exchange only for the on-chart display.
If the selected symbol has no price data on the chart/timeframe, the table shows "—".
Shares are computed as amt ÷ current close from the requested symbol and timeframe.
Example of how to use this tool:
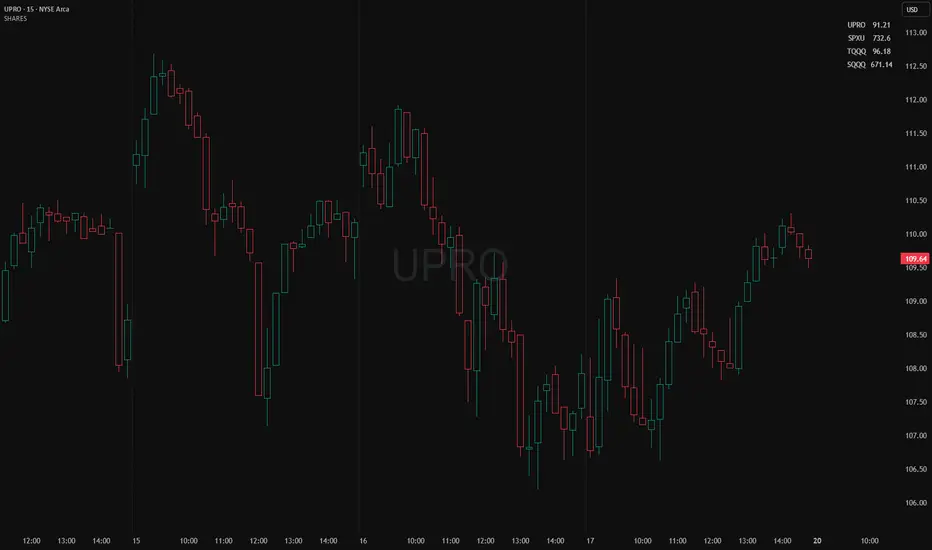
Monitor an index and execute trades on leveraged derivative products. This tool will determine the quantity of shares that can be purchased with a pre-determined dollar amount. Ex: Monitor SPX for entry/exit signals and execute trades on UPRO/SPXU/SPXL/SPXS.
Input a ticker and a dollar amount for position size, shares that can be purchased will be calculated based on the current asset price.
This tool can be helpful for those that use multiple platforms simultaneously to monitor and execute trades.
Positiontracking
Portfolio [Afnan]🚀 Portfolio - Advanced Portfolio Management Indicator 📊
A game-changing portfolio management tool designed to help traders stay on top of their positions and manage risk efficiently. This indicator combines detailed tracking, real-time analytics, and visual clarity to ensure traders are well-equipped for the dynamic world of financial markets.
📈 Key Features 💡
Track up to 14 positions with ease
Real-time Profit & Loss (P&L) updates and risk metrics
Visual representation of entry, stop-loss (SL), and target levels
Alerts for stop-loss breaches and target achievements
Comprehensive portfolio summaries for quick analysis
Customizable options to suit individual trading styles
🔍 Main Components ⚙️
📊 1. Position Tracking
Detailed position data: entry, stop-loss, target levels, and more
Real-time risk-reward ratios
Insights into position size and exposure percentages
Continuous updates on P&L in real-time
📉 2. Visual Indicators
Clear visual markers for entry, SL, and target prices
Price labels with detailed percentage changes
Indicators that show the current position's market status
💼 3. Portfolio Summary
Aggregate account values and exposure
Summarized P&L metrics across all positions
Risk management insights for better decision-making
Daily performance tracking to evaluate strategies
⚠️ 4. Alert System
Instant notifications for stop-loss breaches
Alerts when target prices are hit
Alerts operate for the current chart symbol
⚡ Customization Options 🎨
Show or hide specific data columns
Adjust the table's position and size for better visibility
Personalize color schemes and text styles
Switch between full portfolio view and single symbol focus
📱 How to Use 📝
Input your positions in the indicator's settings
Enable or disable specific positions dynamically
Customize display preferences to your liking
Set up alerts for proactive risk management
Monitor all your trading activities in one comprehensive dashboard
📌 Important Notes ℹ️
Compatible with any trading symbol
Updates seamlessly during market hours
Alerts are specific to the currently active chart symbol
Maximum capacity: 14 simultaneous positions
Created by: @AfnanTAjuddin
⚠️ Disclaimer ⚠️
This indicator is a tool for informational purposes only. Ensure all calculations are verified and consult a financial professional before making investment decisions.
🎯 "Stay disciplined, trade smart, and let data guide your decisions." 📊

Kzx PT mod v1.0 by RX-RAYKzx Position tracker mod v1.0 by RX-RAY
Original script by K-zax
The modification was made for the USDRUB ticker (the number of digits in the values of price, interest, lot volume and profit loss for other tickers may affect the positioning of the inscription, but it is fully operative and it may be used with other tickers )
Typical label view:
74.30 - ENTRY PRICE
+/-0.16% - % of price chang ( range +/-9.99)
20 - position value (range 0-99)
(S) - position type (L) - long (S) - short
+/-0017 - actual profit/loss in cash (range +/- 9999)
(All range value for correct label position,
but script mod can be used out off range)
List of additions and changes:
1. Added display of position value, short / long position type and profit / loss value (including broker commission).
2. Positive interest change now corresponds to profit, negative change in interest to loss in accordance with the type of position ( short/long )
3. The position of the inscription and the digits of the values are fixed and now insignificantly depends on the change in the time interval and the change in the scale of the graph and the change in data values and their signs.
4. Added changing the color of the inscription in the situation positive price change, but profit < commission fee. (critical gain).
