MarketMind PRO v1.0 🜁 MarketMind PRO v1.0 — Multi-Session Real-Time Context Engine
Find opportunity faster. Trade with clarity and conviction.
🜁 MarketMind PRO is a real-time, session-aware context intelligence engine designed to answer one essential question:
Is this ticker truly in play today?
Its analysis adapts instantly to the current trading phase—Early Flow (Pre-Market), Volatility Burst (Open), Low-Vol Window (Midday), Rebuild Phase (Afternoon), or Power Hour (Pre-Close)—so the score and bias signals you see always reflect the conditions that matter right now.
This makes 🜁 MarketMind PRO a multi-timeframe environment engine with a strong emphasis on deep real-time analysis during the two highest-edge windows of the day: Pre-Market and Pre-Close .
By fusing macro alignment, sector flow, liquidity quality, volatility regime, microstructure behavior, and options-driven pressure into a single visual framework, 🜁 MarketMind PRO turns noisy charts into clean, decision-ready environments.
Whether you're hunting high-quality overnight setups in the final hour, scanning gap-driven opportunities before the open, or evaluating structure during the regular session, 🜁 MarketMind PRO highlights the context that matters—and filters out everything that doesn’t.
⭐ WHAT 🜁 MARKETMIND PRO ACTUALLY DOES
🜁 MarketMind PRO performs continuous real-time analysis across all trading phases.
It:
• detects when a ticker is aligned with broader market forces
• highlights high-quality conditions for intraday or overnight trades
• warns you when macro, VWAP, or gap conditions make the setup unsafe
• reveals trend, structure, liquidity, and flow context instantly
• consolidates cross-market awareness into one simple, unobtrusive chart
It’s built for traders who want clarity without complexity.
⭐ THE CORE OF 🜁 MARKETMIND PRO: THE SQS SCORE (0–100)
SQS (System Quality Score) compresses nine critical dimensions of market and setup readiness:
✓ Gap Behavior
✓ Sector Flow
✓ Liquidity Quality
✓ Relative Strength
✓ Macro Alignment
✓ Microstructure Strength
✓ Price Stability
✓ Options Flow
✓ Bonus Context (trend confluence, regime reinforcement)
SQS is fully session-aware and adjusts its weighting model in real time.
It automatically adapts to the two highest-opportunity phases:
• Pre-Close (15:30–16:00 ET) — for overnight hunters
• Pre-Market (04:00–09:30 ET) — for gap traders & open-drive setups
Scores translate into an intuitive tier:
• GO – High-quality environment
• WATCH – Developing conditions
• PASS – Low-quality environment
• SKIP – Hard block triggered (Macro, VWAP, Gap)
SQS doesn’t tell you what to trade — it tells you when the environment is worth your attention.
⭐ OPTIONS FLOW ENGINE v1.0 — A NEW DIMENSION OF CONVICTION
🜁 MarketMind PRO v1.0 introduces a dedicated Options Flow Engine, designed for traders who rely on flow-aligned environments.
Powered by a multi-layer fusion model, Options Flow measures:
• directional bias (Call vs Put)
• macro confirmation state
• RS, volatility, and trend bursts
• volume-imbalance pressure (buy/sell dominance)
• expansion bars & spike behavior
• early reversal/compression signals
• pre-market flow acceleration
• contextual flow multiplier (momentum × volatility × VWAP × sector alignment)
The output is a smooth, conservative, non-inflated flow signal that highlights genuine options pressure—not noise.
When enabled, Options Flow integrates directly into SQS as a weighted component, adding a powerful second layer of confirmation without overwhelming the trader.
⭐ THE HUD — EVERYTHING THAT MATTERS, INSTANTLY
The on-chart HUD is designed for ultra-fast interpretation and adapts automatically to your current session in real-time:
✔ Macro Bias (overall market tone & volatility environment)
✔ Sector Bias (how strong your ticker’s sector is today)
✔ Trend Bias (the chart’s structure, trend quality, VWAP position)
✔ Micro Bias (how similar tickers are behaving — peer confirmation)
✔ SQS Score (0–100) with tiers for GO / WATCH / PASS / SKIP
✔ Hard Block Reason (Macro, VWAP, or Gap — conditions that stop a setup from qualifying)
✔ Breakdown Panel (full 9-factor score display)
✔ Key Driver Analysis (which factor moved SQS the most)
✔ Options Mode Output (direction, expiry, delta, flow%)
Every element is tuned to reduce cognitive load and turn complex market states into clean, actionable context.
⭐ PRE-CLOSE MODE — IDENTIFY HIGH-QUALITY OVERNIGHT SETUPS
During 15:30–16:00 ET, 🜁 MarketMind PRO shifts into its highest-precision overnight model, emphasizing:
• structural integrity
• trend continuation
• sector agreement
• macro confirmation
• liquidity quality
• stability conditions
This helps uncover tickers building strength into the close—ideal for selective overnight positions.
⭐ PRE-MARKET MODE — FIND THE BEST GAP PLAYS BEFORE THE BELL
In the pre-market window, weightings shift toward:
• gap magnitude × character
• early liquidity quality
• volatility expansion vs compression
• microstructure acceleration
• macro alignment ahead of the open
• premarket flow strength (if Options Mode enabled)
You immediately see which tickers are warming up, which are accelerating, and which are fading before the open.
⭐ OPTIONS MODE (OPTIONAL FEATURE)
When activated, 🜁 MarketMind PRO displays:
• Call/Put direction
• Expiry (0DTE / 1DTE / 2DTE)
• Delta
• Options Flow %
• Flow Direction Bias (Bullish / Bearish)
This mode is ideal for:
• flow-confirmation traders
• macro-aligned momentum plays
• premarket sweep/chase setups
• intraday continuation plays
Options Mode is fully optional.
SQS remains complete and accurate without it.
⭐ WHY TRADERS USE 🜁 MARKETMIND PRO
✓ Avoid low-quality environments
No more wasting time in chop, illiquid tickers, or dead setups.
✓ Spot opportunity faster
A single glance tells you whether a ticker is heating up or not worth your time.
✓ Build confidence and clarity
You understand why the environment is favorable—or why it isn’t.
✓ Streamline your scanning routine
🜁 MarketMind PRO was engineered for fast, repeatable workflows.
✓ Stay aligned with broader market structure
Bias and regime context are always visible.
⭐ WHO 🜁 MARKETMIND PRO IS FOR
• Day traders
• Swing traders
• Options traders
• Pre-Market scanners
• Pre-Close overnight hunters
• Momentum, trend, and structure traders
• Systematic/algo traders who need human-readable context
If you value context first, decisions second, this tool was built for you.
⭐ RECOMMENDED SETTINGS & WORKFLOW
• Use Pre-Close Mode 15:30–16:00 ET for overnight setups
• Use Pre-Market Mode 07:00–09:30 ET for gap filtering & open-drive candidates
• Enable Options Mode only if your strategy benefits from flow context
• Keep HUD in Top Right for the cleanest chart layout
• Turn OFF Inputs/Values in Status Line for optimal display
⭐ IMPORTANT NOTES
• 🜁 MarketMind PRO is a context engine, not a buy/sell signal
• It pairs best with your existing strategy or system
• No proprietary signals or predictions are provided
• SQS is session-aware and adapts automatically
• Options Flow is intentionally conservative—greens are rare and meaningful
⭐ FINAL THOUGHTS
🜁 MarketMind PRO v1.0 is built for the modern trader who wants clarity, speed, and conviction.
It provides the macro, micro, structure, and flow context needed to choose smarter setups—without guessing or over-analyzing.
If you want a clean, disciplined way to identify when a ticker truly deserves your attention…
🜁 MarketMind PRO is the missing piece of your workflow.
PRE

Comprehensive Volume and Metrics with Pre-Market Volume Data
This script is designed for traders who want a detailed view of market activity, including regular market and pre-market volume, dollar volume, relative volume (RVOL), average daily range (ADR), average true range (ATR), relative strength index (RSI), and the QQQ’s percentage change.
The script includes customizable metrics displayed in tables on the chart for easy analysis, with the option to toggle the visibility of each metric.
Key Features:
Volume and Dollar Volume:
Displays the volume of shares traded during the current day (or pre-market, if enabled).
Includes a calculation of dollar volume, representing the total dollar amount of trades (Volume × Close Price).
Relative Volume (RVOL):
Displays RVOL Day, which is the relative volume of the current day compared to the 2-day moving average.
Shows RVOL 90D, indicating relative volume over the past 90 days.
Both RVOL metrics are calculated as percentages and display the percentage change compared to the standard (100%).
Pre-Market Data:
Includes pre-market volume (PVOL) and pre-market dollar volume (P$ VOL) which are displayed only if pre-market data is enabled.
Tracks volume and dollar volume during pre-market hours (4:00 AM to 9:30 AM Eastern Time) for more in-depth analysis.
Optionally, shows pre-market RSI based on volume-weighted close prices.
Average Daily Range (ADR):
Displays the percentage change between the highest and lowest prices over the defined ADR period (default is 20 days).
Average True Range (ATR):
Shows the ATR, a popular volatility indicator, for a given period (default is 14 bars).
RSI (Relative Strength Index):
Displays RSI for the given period (default is 14).
RSI is calculated using pre-market data when available.
QQQ:
Shows the percentage change of the QQQ ETF from the previous day’s close.
The QQQ percentage change is color-coded: green for positive, red for negative, and gray for no change.
Customizable Inputs:
Visibility Options: Toggle the visibility of each metric, such as volume, dollar volume, RVOL, ADR, ATR, RSI, and QQQ.
Pre-Market Data: Enable or disable the display of pre-market data for volume and dollar volume.
Table Positioning: Adjust the position of tables displaying the metrics either at the bottom-left or bottom-right of the chart.
Text Color and Table Background: Choose between white or black text for the tables and customize the background color.
Tables:
The script utilizes tables to display multiple metrics in an organized and easy-to-read format.
The values are updated dynamically, reflecting real-time data as the market moves.
Pre-Market Data:
The script calculates pre-market volume and dollar volume, along with other key metrics like RSI and RVOL, to help assess market sentiment before the market officially opens.
The pre-market data is accumulated from 4:00 AM to 9:30 AM ET, allowing for pre-market analysis and comparison to regular market hours.
User-Friendly and Flexible:
This script is designed to be highly customizable, giving you the ability to toggle which metrics to display and where they appear on the chart. You can easily focus on the data that matters most to your trading strategy.

Stock Data Table█ OVERVIEW
This is a table that shows some information about stocks. It is divided into four sections:
1) Correlation
2) Shares
3) Daily Data
4) Extended Session Data
The table is completely modular, which means you can add or remove each element from the settings menu, and it will automatically rearrange its spaces.
It is also highly customizable, to the extent that you can change almost any color, remove or change titles, invert section rows, and much more.
1) Correlation
The script checks if the stock is listed on NASDAQ, and if so, uses the QQQ (Nasdaq-100 ETF) as the reference index in the first cell; otherwise, it uses the SPY (S&P 500 ETF). The length of the correlation is shown in the second cell. The table then displays the correlation between the reference index and the other index, and the correlation between the reference index and the stock.
To make it easier to interpret the correlation values, each row's last cell is color-coded with a gradient to highlight the type of correlation, and the direction of the gradient can be customized.
The correlation coefficient is a statistical measure that quantifies the strength and direction of the relationship between two variables, indicating how changes in one variable are associated with changes in the other variable, so it can be used to identify patterns and trends.
If you are interested in correlation, I suggest taking a look at my dedicated indicator:
2) Shares
This feature provides you with quick access to key information about shares and market capitalization.
On one row, you can view the total shares outstanding and the market capitalization for the fiscal year or the quarterly year. The total shares outstanding represents the total number of shares of the stock that have been issued and are currently outstanding, regardless of whether they are held by insiders or public investors. The market capitalization is a widely used measure of the company's value as determined by the stock market, calculated by multiplying its current stock price with the total number of outstanding shares.
The other row shows the float, which is the number of shares of a company that are available for public trading, and the corresponding free-float market cap, calculated by multiplying the company's current stock price with the float. Because Pine Script does not allow retrieving information about quarterly year float, you can view the float and the free-float market cap of the fiscal year only. The data can be displayed at all times or only when the difference between the total shares outstanding and the float is significant enough to result in a difference between the market cap and free-float market cap.
The classification for market cap and free-float market cap is set in this way:
Mega Cap: $200 billion or more
Large Cap: between $10 billion and $200 billion
Mid Cap: between $2 billion and $10 billion
Small Cap: between $300 million and $2 billion
Micro Cap: less than $300 million
Penny Stocks: less than $5 (customizable)
Comparing the free-float market cap to the market cap can provide insights into the liquidity of a stock. In fact, if the float is relatively small compared to the total shares outstanding, it may be more difficult to find buyers or sellers, which could lead to increased volatility. On the other hand, a larger float indicates that the stock is more liquid and may be easier to trade, potentially resulting in lower volatility. However, market conditions can change quickly and significantly, especially for intraday traders, and the free-float can also change as insiders or other large shareholders buy or sell shares. Therefore, comparing the data of the fiscal year with that of the quarterly year may not provide the most up-to-date and accurate information for making trading decisions. This limitation can be mitigated by combining those data with other indicators and tools, such as technical analysis or news events, to gain a better understand of the stock's performance and potential trading opportunities.
3) Daily Data
This section is available on daily charts only due to the lack of accuracy of real-time daily data on other time frames. Here, you can view the Average Daily Volume (ADV) over a preferred time range (20 days by default), and the Daily Change, which represents the percentage difference between the closing price on two consecutive trading days.
ADV is useful in measuring the stock's volatility, as it provides an indication of how much trading activity there is in it. Generally speaking, stocks with higher trading volume tend to be less volatile than stocks with lower trading volume. High trading volume means there are more buyers and sellers actively trading the stock, which makes it easier for investors to buy and sell shares at fair prices. This increased liquidity can help to stabilize the stock price, reducing the potential for large swings in either direction. On the other hand, stocks with lower trading volume may experience greater volatility, as there are fewer buyers and sellers actively trading the stock. This can result in larger price swings, as it may be more difficult for investors to buy or sell shares at fair prices.
The daily percentage change can provide an indication of the stock's volatility, with larger values indicating greater volatility and risk. It can also be compared to that of a benchmark such an index or other stocks in the same sector, helping to determine whether the stock is outperforming or underperforming relative to them.
4) Extended Session Data
The fourth section is available on intraday charts only. This section provides two pieces of information: the Extended Session Change and the Pre-Market Volume.
The Extended Session Change indicates the percentage difference between the previous day's closing price and the latest price in the extended session. This gives you the extent and the direction of the price gap that occurred during extended trading hours.
The Pre-Market Volume shows the sum of all shares traded during the pre-market session. This can be helpful in understanding how much interest the stock gained before the market opened.
By default, the two rows will be visible at all times. They will stop updating after the end of their respective time range, and resume updating when it starts again. However, you can choose to automatically hide them outside of their time ranges.
Both the extended session and pre-market time ranges can be customized. Please note that if you select time ranges outside of the regular market session (as set by default), you must enable the extended session to view the corresponding rows.
█ GENERAL NOTES
• Total Shares Outstanding, Float, Average Daily Volume and Pre-Market Volume cells use a customizable color system based on two thresholds, to help you quickly identify whether the value is "too low/acceptable/too high" or "too low/not enough high/acceptable".
• If you cannot see certain data, that simply means it is not available.

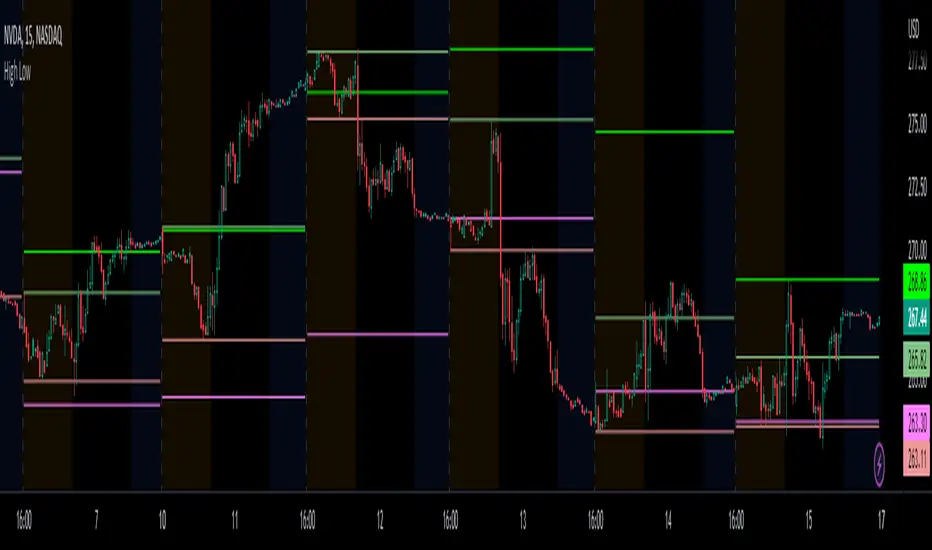
Prior day and pre-market high lowThis indicator displays the:
- Prior day high
- Prior day low
- Pre-market high
- Pre-market low
as a coloured line across the entire session for each individual session on an intraday chart.
For the extended session, this indicator marks the prior day and pre-market high low for each individual session starting at the pre-market and ending in the post-market, a feature not available on other indicators.
This indicator automatically marks out the levels for the prior day and pre-market high low for each individual session, allowing the user to observe how the price action behaves around the prior day and pre-market high low.
Note:
In this script, request.security() used with lookahead = barmerge.lookahead_on to fetch prices without offsetting the series by for the extended session does not access future data. This is because for extended session, request.security() sees the start of the session to be at the start of the regular session and ends at the end of the pre-market, when in reality the session starts at the start of the pre-market and ends at the end of the post-market.
Hence in each extended session when the line is first drawn in the pre-market, request.security() returns the value of the prior day high/low, and not future data.
Session High and Low IndicatorThis script is meant for stocks that have a pre-market session. It is meant to be used on the 1 min time frame. This script will draw a green line at the high of pre-market, and a red line at the low of pre-market and extend these lines across the regular session day
This makes it easy to see if price action during regular market has broken above pre-market high or broken below pre-market low.
The high/low skips any quick spikes in price action (similar to what happens at 8:30 am every day).

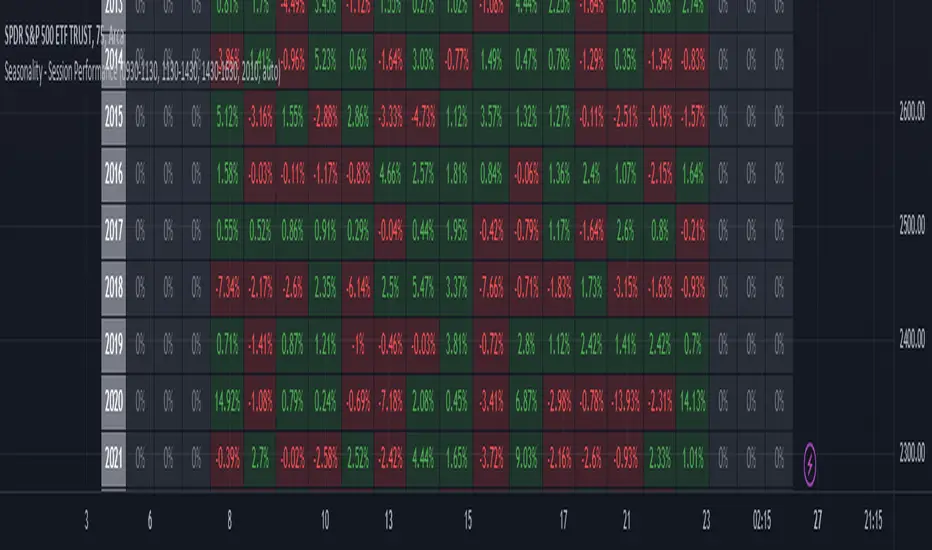
Seasonality - Session Performance - Morning Afternoon EveningUse this indicator on Intraday Timeframe. Higher the timeframe, more the data
This script calculates the performance of an instrument for different sessions.
Session inputs can be updated to study performance of
- Morning vs Afternoon vs Evening
- Pre-Market vs Market vs Post-Market (provided the data feed supports pre and post market)
- Overnight vs Intraday
Three session inputs are provided to tweak the session range
Performance is calculated as session close / session open - 1
Session timeframes can be set for various countries. Make sure the session timeframe aligns with the Candle open/close for the timeframe you choose. Some examples below
US Markets: 0930-1130 1130-1430 1430-1630 Timeframe 1 hour
India Markets: 0915-1030 1030-1415 1415-15:30 Timeframe 75min
Reivaj MA - PreSession This script contains 9 moving averages which can be changed each between "sma", "ema", "wma", "vwma.
The values of the moving averages are:
MMA20 = SMA20
MMA50 = SMA50
MMA100 = SMA100
MMA200 = SMA200
MMA300 = SMA300.
MMAextra1 = ema 8
MMAextra2 = ema21
MMAextra3 = sma400
MMAextra4 = sma500.
It has an Asian range that goes from 21: 00-07: 00 UTC which turns the color of the candle in green.
And pre-sessions that is one hour before the opening, the time of the opening and the hour after the opening of London and New York.

Forex Sessions by EF with DSTBased on the well known existing Sessions script
Changes:
- 3x daylight savings checkboxes for Australia, London and New York. No more manual script modifications when DST is on/off, just check/uncheck and go!
- sessions re-ordered to trading day
- 1 hour pre-market zones added (there is none for Australia as that is the start of the Forex day)
- modified transparency settings to make it more subtle
- default on are Asia open and New York open + their respective 1 hour Pre-Market
