KK Prev-Day/Week H/L with AlertsThis indicator auto plots previous day high and low, and previous week high and low.
Previousdayhighandlow

DWM HLOC, Mid & WicksSimple, yet effective.
1. Automatically calculate and projects key price levels from a previous period (Yesterday, OR Last Week / Month) onto the current trading session. It acts as an immediate Support & Resistance map based on historical price action.
2. Multi-Timeframe Logic
Modes --
Daily Mode: Projects yesterday's data onto today.
Weekly Mode: Projects last week's data onto the current week.
3. Key Levels Visualized The script calculates seven distinct price levels:
OHLC: Previous Open, High, Low, and Close.
Equilibrium (Mid): The exact 50% mark between the previous High and Low.
Wick Midpoints (New):
Upper Wick 50%: The midpoint between the High and the top of the body.
Lower Wick 50%: The midpoint between the Low and the bottom of the body.
4. Smart "Gap" Visualization The script uses unique starting points to help traders visualize market gaps:
Standard Levels (High, Low, Open, Mids): These lines originate from the Previous Period's Open, showing the full context of the level relative to time.
Close Level: This line originates from the Current Period's Open. This visually highlights the "Gap" (the jump in price between where the market closed previously and where it opened today).
5. Full Customization
Aesthetics: Every line can be individually toggled on/off.
Styling: Users can independently change the color, line style (Solid, Dotted, Dashed), and thickness for every specific level.

Gann Box LogicGann Box Logic
Overview
The Gann Box Logic indicator is a precision-based trading tool that combines the principles of Gann analysis with retracement logic to highlight high-probability zones of price action. It plots a structured box on the chart based on the previous day's high and low, overlays Fibonacci-derived retracement levels, and visually marks a critical “neutral zone” between 38.2% and 61.8% retracements.
This zone — shaded for emphasis — is a decision filter for traders:
- It warns against initiating trades in this area (low conviction zone).
- It identifies reversal pull targets when extremes are reached.
Core Principles Behind Gann Box Logic
Logic 1 — The Neutral Zone (38.2% ↔ 61.8%)
- The 38.2% and 61.8% retracement levels are key Fibonacci ratios often associated with consolidation or indecision.
- Price action between these two levels is considered a neutral, low-conviction zone.
- Trading Recommendation:
- Avoid initiating new trades while price remains within this shaded band.
- This zone tends to produce whipsaws and false signals.
- Wait for a decisive break above 61.8% or below 38.2% for clearer momentum.
- Why it matters:
- In Gann’s market structure thinking, the middle range of a swing is often a battleground where neither bulls nor bears are in full control.
- This is the zone where market makers often shake out weak hands before committing to a direction.
Logic 2 — Extremes Seek Balance (0% & 100% Reversal Bias)
- The indicator’s 0% and 100% levels represent the previous day’s low and high respectively.
- First Touch Rule:
- When the price touches 0% (previous low) or 100% (previous high) for the first time in the current session, there is a high probability it will attempt to revert toward the center zone (38.2% ↔ 61.8%).
- Trading Implication:
- If price spikes to an extreme, be alert for reversion trades toward the mid-zone rather than expecting a sustained breakout.
- Momentum traders may still pursue breakout trades, but this bias warns of potential pullbacks.
- Why it works:
- Extreme levels often trigger profit-taking by early entrants and counter-trend entries by mean-reversion traders.
- These forces naturally pull the market back toward equilibrium — often near the 50% level or within the shaded zone.
How the Indicator is Plotted
1. Previous Day High/Low Reference — The script locks onto the prior day’s range to establish the vertical bounds of the box.
2. Retracement Levels — Key Fibonacci levels plotted: 0%, 25%, 38.2%, 50%, 61.8%, 75%, 100%.
3. Box Structure — Outer Border marks the full prior day range, Mid Fill Zone is shaded between 38.2% and 61.8%.
4. VWAP (Optional) — Daily VWAP overlay for intraday bias confirmation.
Practical Usage Guide
- Avoid Trades in Neutral Zone — Stay out of the shaded area unless you’re already in a trade from outside this zone.
- Watch for First Touch Extremes — First touch at 0% or 100% → anticipate a pullback toward the shaded zone.
- Breakout Confirmation — Only commit to breakout trades when price leaves the 38.2–61.8% zone with strong volume and momentum.
- VWAP Confluence — VWAP crossing through the shaded zone often signals a balance day — breakout expectations should be tempered.
Strengths of Gann Box Logic
- Removes noise trades during low-conviction periods.
- Encourages patience and discipline.
- Highlights key market turning points.
- Provides clear visual structure for both new and advanced traders.
Limitations & Warnings
- Not a standalone entry system — best used in conjunction with price action and volume analysis.
- Extreme moves can sometimes trend without reversion, especially during news-driven sessions.
- Works best on intraday timeframes when referencing the previous day’s range.
In Summary
The Gann Box Logic indicator’s philosophy can be boiled down to two golden rules:
1. Do nothing in the middle — Avoid trades between 38.2% and 61.8%.
2. Expect balance from extremes — First touches at 0% or 100% often pull back toward the shaded mid-zone.
This dual approach makes the indicator both a trade filter and a targeting guide, allowing traders to navigate markets with a structured, Gann-inspired framework.
DISCLAIMER
The information provided by this indicator is for educational purposes only and should not be considered financial advice. Trading carries risk, including possible loss of capital. Past performance does not guarantee future results. Always conduct your own research and consult with a qualified financial professional before making trading decisions.

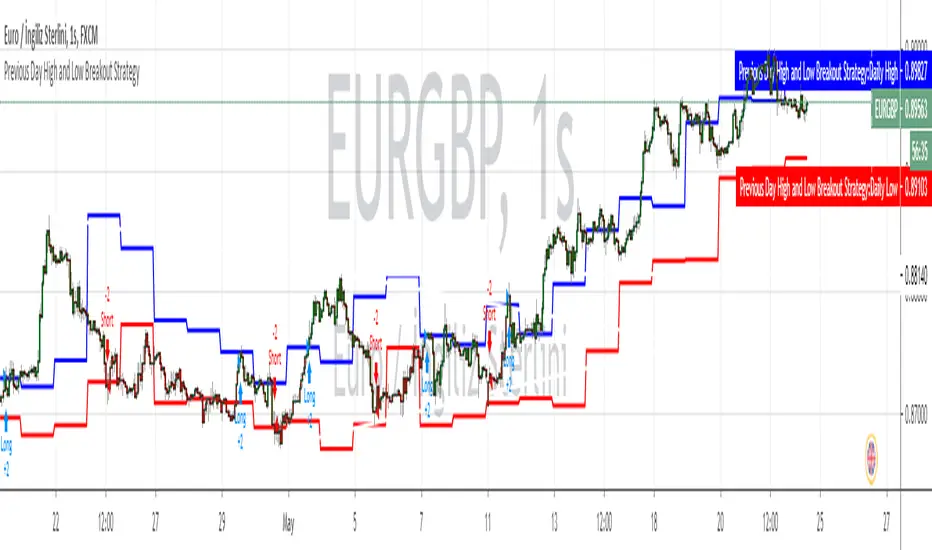
DTLLC Time & PriceDTLLC Time and Price with Signals
This indicator is built for traders who understand ICT concepts and want a structured, visual way to align time-based price action with key market levels. By combining customizable trading windows, breakout logic, and daily reference points, it helps you identify high-probability trade opportunities while filtering out market noise.
Key Features
1. Dual Custom Time Ranges (Kill Zones)
Set two independent time ranges per day (start/end hour and minute).
Each range identifies the highest high and lowest low within its window.
Built-in breakout detection generates buy/sell signals when price moves beyond these levels.
2. Volatility Filtering
Adjustable volatility threshold based on True Range relative to ATR.
Filters out low-quality signals during choppy, low-volatility conditions.
3. ATR-Based Stop Loss
Custom ATR length and stop-loss multiplier settings.
Automatically plots ATR-based stop levels for triggered trades.
4. Daily Key Levels
Plots Previous Day High, Previous Day Low, and Midnight Open continuously on the chart.
Useful for spotting breakout and reversal opportunities in line with ICT market structure concepts.
5. Liquidity & Engulfing Candle Highlights
Highlights potential liquidity grab zones (yellow candles) when significant highs/lows are set within your lookback period.
Detects bullish (green) and bearish (red) engulfing patterns for added confluence.
6. Visual & Signal Tools
Buy/Sell signals plotted directly on chart (separate colors for Range 1 and Range 2). Continuous plotting of reference levels to maintain market context throughout the session.
Example Use Case:
A common ICT-inspired reversal setup:
Wait for price to sweep the Previous Day’s High or Low during your chosen time range.
Look for a buy or sell signal with volatility confirmation.
Manage risk using the ATR-based stop-loss plot.
Disclaimer: This script is for educational purposes only and is not financial advice. Trade responsibly and always test strategies before applying them in live markets.

Previous Levels by HAZEDPrevious Day/Week/Month High/Low Levels with 50% Equilibrium
🎯 Key Features:
- Previous Period Levels: Automatically plots previous Day, Week, and Month highs and lows
- 50% Equilibrium Zones: Shows the midpoint between each period's high and low
- Precise Line Placement: Lines start from the exact bar where the high/low occurred (not period beginning)
- Clean Visual Design: Solid lines for key levels, semi-transparent for equilibrium zones
- Customizable Display: Toggle each timeframe independently with custom colors and styles
📊 How It Works:
The indicator identifies the previous period's high and low points, then draws horizontal lines starting from the exact time those levels were created. The 50% equilibrium levels mark the midpoint between each period's range, providing additional support/resistance reference points.
⚙️ Settings:
- Timeframe Controls: Enable/disable Daily, Weekly, Monthly levels
- Line Styles: Choose between solid, dashed, or dotted lines
- Color Customization: Set individual colors for each timeframe
- Label Options: Show/hide price values, adjust label size
- 50% Levels: Toggle equilibrium zones with semi-transparent styling
💡 Trading Applications:
- Support & Resistance: Previous highs/lows act as key S/R levels
- Breakout Trading: Monitor price action around these critical levels
- Mean Reversion: 50% equilibrium zones often act as magnet levels
- Multi-Timeframe Analysis: See how different timeframe levels interact
🔧 Technical Notes:
- Lines extend to the right for future reference
- Only shows levels when chart timeframe is equal or lower than the level timeframe
- Uses precise historical data to ensure accurate line placement
- Optimized for performance with clean code structure
Perfect for swing traders, day traders, and anyone using support/resistance analysis!
Feel free to leave feedback and suggestions for future updates!

Liquidity Sweep Detector - PDH/PDL LevelsPrevious Day High/Low Liquidity Sweep Detector (Intraday Accurate)
This indicator tracks the previous day's high and low using intraday data, rather than the daily candle, ensuring precise sweep detection across lower timeframes (15m to 4H).
It monitors for liquidity sweeps—moments when price briefly moves above the previous high or below the previous low—and visually marks these events on the chart.
Key Features
Intraday-accurate PDH/PDL tracking
Real-time sweep detection
On-chart labels marking sweep events
Toggleable table showing sweep status
Alert conditions for PDH/PDL sweep triggers
Best For
Traders who use Smart Money Concepts (SMC), liquidity-based strategies, or look for stop hunts and reversal zones tied to key prior-day levels.
Works well across FX, crypto, and indices on 15m, 1H, and 4H charts.

Custom Previous High/Low + Breakout AlertsThis indicator plots the previous high and low of the selected timeframe and alerts you when the price breaks either level.
To prevent spam, it triggers only once per period. If both the high and low break within the same period, you will receive an alert for each, but no duplicates if price hovers around these levels.
How to Set Up Alerts
1. Choose Your Timeframe
- In the indicator settings, select the timeframe for the high/low reference.
- Example: If you select 1 hour, the indicator will plot the previous 1-hour high and low and alert you when either level is broken
2. Create an Alert
- Condition → High/Low Break Alerts
- Function → Any alert() function call
Optional:
- If you want alerts only for high breakouts or low breakouts, select High Breakout or Low Breakout and use "Once Per Bar" as the trigger. (It will still alert only once per period.)
3. Setting Alerts for Multiple Timeframes
- If you want to create another alert for a different timeframe, first select the new timeframe in the indicator settings, then create a new alert
- Note: Previous alerts will continue to notify you based on the timeframe they were originally set for, even if you change the timeframe in the indicator settings.

PDH & PDL Indicator: Previous Day's High/Low with AlertsThe PDH & PDL Indicator plots the Previous Day's High (PDH) and Previous Day's Low (PDL) directly on the chart, providing a clear visual reference for key price levels. These levels are often used by traders to identify potential breakout or breakdown zones and to gauge market strength or weakness.
Features:
PDH (Green Line) : Represents the high of the previous trading day.
PDL (Red Line): Represents the low of the previous trading day.
Alerts:
Get notified when the price crosses above PDH or below PDL.
Custom alert messages to keep you informed in real-time.
Use Cases:
Identify key breakout and breakdown points for potential trade entries or exits.
Confirm the strength of a trend by monitoring price action relative to PDH and PDL.
Useful for intraday, swing, and positional traders who rely on historical price levels for strategy development.

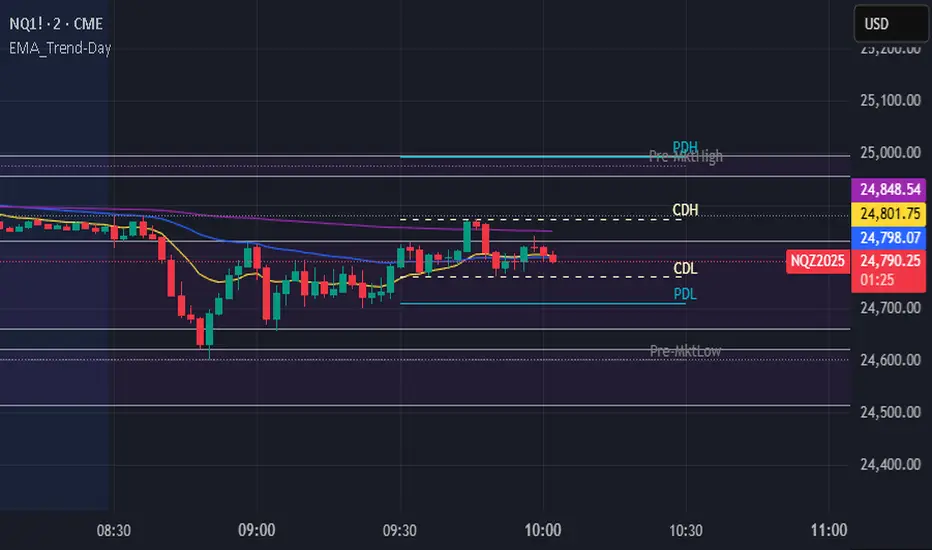
Previous Day and Current Day High/LowKey Features:
Previous Day High and Low Lines:
Displays the high (PDH) and low (PDL) levels of the previous trading day.
Allows customization of line colors, styles (solid, dashed, or dotted), and widths.
Extends these lines by a specified number of candles into the current day for better visualization.
Current Day High and Low Lines:
Displays the high (CDH) and low (CDL) levels during the current day's regular trading hours.
Customizable line attributes, including color, style, width, and extension length.
Customizable Input Options:
User-configurable settings for both the previous and current day high/low lines, grouped under respective sections for clarity.
Regular trading hours can be defined manually (default is 9:30 AM to 4:00 PM).
Ability to toggle the visibility of the lines for both the previous and current days.
Automatic Reset at the Start of a New Day:
Captures the high and low values of the completed day and resets for the new day.
Deletes old lines and labels to ensure clarity and avoid overlap.
Dynamic Updates:
Updates the current day's high and low lines and labels as new data comes in.
Adjusts previous day lines dynamically based on the user-defined number of candles to extend.
Session-Based Filtering:
Ensures the calculations and updates are restricted to the defined regular trading hours.
Code Logic:
Input Groups: The script uses grouped inputs to allow users to configure settings for previous and current day levels separately.
Line and Label Management: It creates and deletes lines and labels dynamically to prevent clutter and keep the chart organized.
Session Check: Uses the session input to determine if a bar falls within regular trading hours.
High/Low Calculation: Tracks the high and low for both the previous and current days during regular trading hours.
New Day Detection: Identifies the start of a new trading day to update previous day values and reset current day variables.
Applications:
Intraday Trading: Helps traders identify critical support and resistance levels from the previous and current days.
Trend Analysis: Provides visual cues for price movement trends across consecutive days.
Custom Visualization: With extensive customization options, traders can adapt the indicator to suit their trading style and chart aesthetics.
This script is highly configurable, making it versatile for a wide range of trading strategies and styles.

[TTM] ICT Key Levels🌟 Overview 🌟
This tool highlights key price levels, such as highs, lows, and session opens, that can influence market moves. Based on ICT concepts, these levels help traders spot potential areas for market reversals or trend continuations.
🌟 Key Levels 🌟
🔹 Week Open (00:00 EST)
Marks the start of the trading week. This level helps track price direction and is useful for framing the Weekly candle formation using ICT’s Power of 3.
🔹 Midnight Open (00:00 EST)
The Midnight Open (MNOP) marks the start of the new trading day. Price often retraces to this level for liquidity grabs, setting up larger moves in the daily trend. It's also key for framing the Daily Power of 3 and spotting possible market manipulation.
🔹 New York Stock Exchange Open (09:30 EST)
The NYSE Open is a major liquidity event, where price seeks liquidity from earlier in the day, like stop hunts or retracements to the London or Midnight Open. This time often brings reversals or trend continuations as volatility increases.
🔹 Previous Day High/Low
These levels show where liquidity rests, often serving as targets for price revisits, ideal for reversals or continuation trades.
🔹 Previous Week High/Low
Similar to daily levels but on a larger scale. They help identify swing trades and track broader market trends.
🔹 Previous Month High/Low
These monthly levels are important for long-term traders, as price often aims to clear them before setting new trends or market cycles.
Happy Trading!
TheTickMagnet

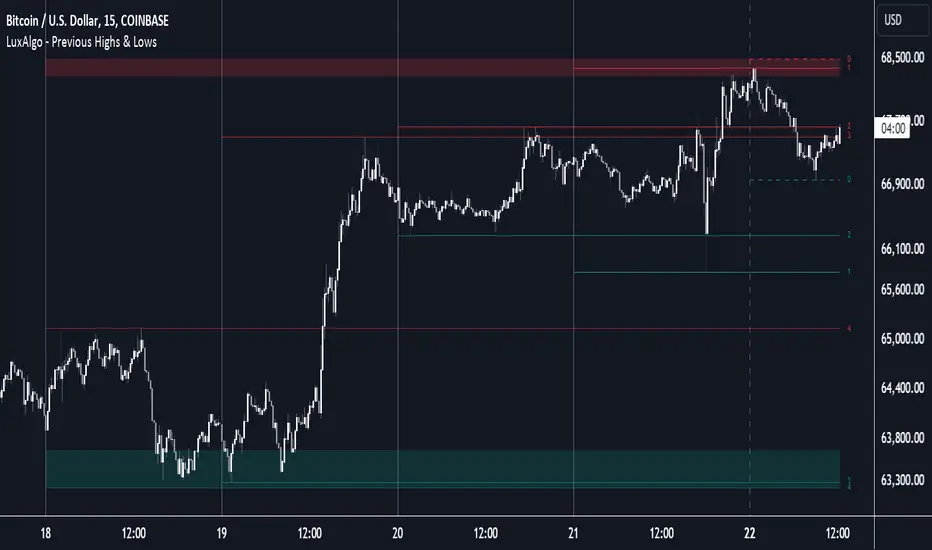
Previous Highs & Lows [LuxAlgo]The Previous Highs & Lows indicator highlights a user-set amount of previous maximum/minimum prices made within specific intervals, these are displayed as levels customizable levels.
Additionally, one upper and lower zone constructed from the previously displayed highs/lows is included, providing support/resistance areas.
🔶 USAGE
Previous highs/lows are often perceived as key trading levels with the potential of generating multiple reactions upon being reached.
While the daily interval is more commonly used, users can use different intervals, with the indicator supporting hourly, daily, weekly, monthly, and yearly intervals. Using higher intervals on low timeframes can return more distant levels relative to the most recent price, which might not be relevant.
Each level is numbered, with more recent previous highs/lows having a lower number associated with them, users can also highlight more recent levels through a transparency gradient.
Users can control the amount of previous highs/lows displayed using the "Show Last" settings, with a higher value providing more potential support/resistance. Returned previous highs/lows can eventually be filtered out based on their position by enabling the "Filter Based On Position" setting, only keeping previous highs above the current closing price and previous lows below the current closing price, giving more relevant levels as a result.
🔹 Previous High/Low Areas
The indicator includes two areas constructed from the respective percentiles of the returned previous highs/lows. These can be useful as more general support/resistance areas.
Wider areas are often indicative of a group of previous highs or lows being more dispersed, resulting in areas that are easier to reach. Wider areas can also be obtained by increasing the "Areas Width" setting.
Note: Areas will only be displayed if "Show Last" is greater than 1
🔶 SETTINGS
Show Last: Determines the amount of more recent previous highs and previous low levels displayed by the indicator.
Interval: Interval used to capture maximum/minimum price values,
Areas Width: Width of the displayed top/bottom areas, with higher values returning wider areas.
Filter Based On Position: When enabled only display previous highs above the current closing price and previous lows below the current closing price.
🔹 Style
Minimum Gradient Transparency: Minimum transparency value applied to the colors of the oldest displayed previous highs/lows levels.
PDHL levels with INTRADAY Auto FIBThe present script includes Previous day High/low levels and once the PDH or PDL breaks the present bar's background changes color according to the direction of price breakout.
It's helpful when working on lower timeframe charts with small screen space, so that the user can know that the PDHL has been taken out in one glance at the chart instead of scrolling all around to find out whether the PDH or PDL are broken or not.
The high and low of day before yesterday are also plotted for reference.
The intraday fib levels get drawn taking present day's high and low into account, useful to mark support/retest levels.
The color of the intraday AUTO FIB high and low lines also change from gray to respective assigned colors once the present day price crosses PDH or PDL this is helpful while viewing charts on mobile app.
Disclaimer: Only for studying price movement ideas, trading is not advised.

Day ClueDay Clue Indicator
live Market Information
Day Clue Indicator plots days information like " Initial Balance and Range ", " Day Range ", " Current Day Volume (for NIFTY and BANKNIFTY it takes the future volume) ", " ATR ", if the scrip is NIFTY or BANKNIFTY then it shows the difference between SPOT and Future price so that trader will come to know future is trading at premium or discount,it shows current day name at bottom right corner, and it plots the Ema-20 and Ema-200. These information will update during live market.
Information for Next Trading Session
Day Clue Indicator plots " Previous Day High" , " Previous Day Low ", " Central Pivot Range-CPR with S1 and R1 ","It indicate tomorrow is Trading Day or Trading Holiday(other than Weekend Holidays)" these are information used for next day that will be plot today itself once market closed
Limitations of Day Clue Indicator
Day Clue Indicator only work in Indian Market(NSE and BSE)
Day Clue Indicator only work in " 1-mins, 5-mins, 15-mins " Timeframes, if you switch to other timeframe like 30-mins,1-Hour, Daily then information will hide
Thank You