Futures Exchange SessionsIn the 24-hour trading of the futures market, this indicator provides the user with full customization concerning the most important factor: time. This indicator is centered around three main visualizations: labels, backgrounds, and lines that minimalistically allows the user to keep track of the many time intervals that occur during a futures market 24-hour trading cycle. It also artfully displays the previous days highs and lows. And everything can be individually toggled and configured so the user can get exactly what they want.
Labels
There are three main futures market sessions in a 24-hour period: the London, New York, and Asian Sessions. Each session is given an independent label for the open and close times. The six labels (LO, LC, NYO, NYC, AO, AC) can be individually toggled on or off, the label background color changed, the text switched between black or white, and the height can be lowered or raised. These customizations are intended to give the user full control of the session they are interested in at the moment.
Backgrounds
Backgrounds are the heart of this indicator. There are different colored transparent backgrounds for each of the futures sessions. So the user can clearly see the session they want to highlight without cluttering their chart and getting in the way of analyzing the candles.
If you are familiar with the London and New York killzones, these backgrounds are each individually configured.
If you are familiar with the Inner Circle Trader’s (ICT) NY Morning and Afternoon sessions, these are available. Also, most times weird price action occurs during the lunch hour of these sessions. The London and New York have a background for their respective lunch hours so the user is never caught of guard during these periods.
Lines
The markets are constantly looking for liquidity. To help the user see runs on liquidity, this indicator projects the previous days highs and lows on to the current day with a line and a price label. The line make it very easy to see where price may be headed. See the image below for the perfect example of this phenomenon. Each of the lines can be independently controlled by color, style, and width. And even the labels can be toggled on or off if the user would prefer just to see the lines. Lastly, there is a line that marks the midnight open price in EST.
Special Notes
This indicator is specifically designed for futures tickers.
All of the backgrounds are not designed to be turned on a once (there are many that overlap). They are designed to give the user ultimate control over exactly what timeframe backgrounds to display on their charts.
The labels only appear when timeframe is 1 hour or less.
Previoushighlow

Previous N Days/Weeks/Months High LowJapanese below / 日本語説明は下記
This indicator displays previous N days/weeks/months’ highs and lows simultaneously.
N is user input and users can separately input different N for highs and lows.
For instance, if you would like to show past 20days high and 10days low, you specify 20 for high and 10 for low.
Similar to highs and lows of yesterday, last week and last month which I previously developed a indicator for(see the link below), highs and lows of specific terms such as quarters are also respected as supports and resistances.
A legendary trader group, Turtles also uses 20days high/low break as one of their strategies.
Alerts can be set with the conditions below.
-Crossing over previous day’s high
-Crossing under previous day’s low
-Crossing over previous week’s high
-Crossing under previous week’s low
-Crossing over previous month’s high
-Crossing under previous month’s low
Please note that when we say past 2 days in this indicator, past 2days mean yesterday and day before yesterday, so “today” is not included as “today’s” high/low have yet to be fixed.
Related indicator: High/Low Yesterday&Last week&Last month&Last Year
By combining with this indicator, you can highlight important support and resistance.
—————————————————————
過去N日/N週間/Nヶ月の高値·安値を同時に表示することのできるインジケーターです。
Nはパラメーターとなっており、また高値と安値で異なる期間を指定することができます。
例えば、過去20日間の高値と過去10日間の安値という指定が可能です。
昨日、先週、先月の高値·安値と同様に、四半期などの過去一定期間の高値·安値はサポート·レジスタンスとして良く意識されます。
伝説のトレーダー集団タートルズも20日間の高値·安値のブレイクを取引ルールの一つとして使用していたことで有名です。
また、以下の条件でアラート設定が可能です。
-過去N日高値の上方ブレイク
-過去N日安値の下方ブレイク
-過去N週間高値の上方ブレイク
-過去N週間安値の下方ブレイク
-過去Nヶ月高値の上方ブレイク
-過去Nヶ月安値の下方ブレイク
このインジケーターで過去2日間の高値·安値といった場合、過去2日間とは昨日と一昨日の2日間を指します。まだ高値·安値の確定していない本日は含まないことに注意してください。
関連インジケーター: High/Low Yesterday&Last week&Last month&Last Year
当インジケーターと合わせて使用することで、主要なサポートレジスタンスを表示することができます。

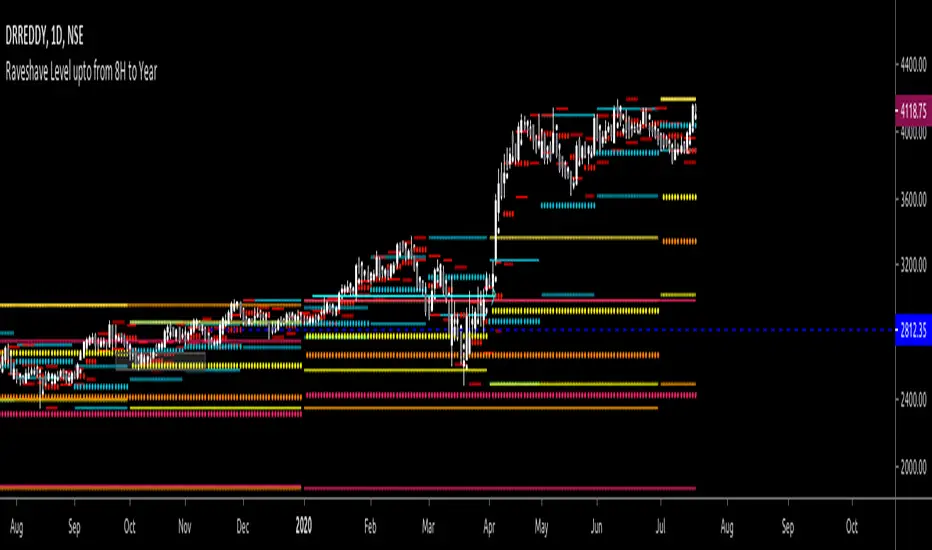
Litt Institutional LevelsThe Litt Institutional Levels Indicator plots previous time periods Highs, Lows, and Closes. Institutions track these levels and will use them as support and resistance to enter and exit their positions. Not every algorithm is a machine-learning wizard. Institutions still use these relatively simple levels to conduct their trades. The best way to use The Litt Institutional Levels Indicator is to find overlapping levels. These areas or lines are called confluence levels and will act as a stronger level than a single line.
For the labeling.
1. Y stands for Yesterday
2. L stands for Last.
3. H stands for High
4. Low stands for Low
5. C stand for Close
For example, LMC would equal Last Months Close.
LQH, would equal Last Quarters High.
YL, would equal Yesterdays Low.")

MILK (My Intraday Lazy Kit)I made this script to group information considered useful in forex day trading, of course it can be used on crypto or other markets.
First of all, feel free to suggest any improvement/new feature you would consider interesting for such an use. This is not especially a final version and I'm sure other relevant information can be added in this tool.
Current features are the following
An international clock showing time and session status (open/closed) for 5 different cities. You can modify it in parameters.
Drawings of previous days/weeks open/high/low/close prices, which will be often used as supports and resistances zones.
The Clock shows
City
Time (with a bgcolor corresponding to the "period" of the day (Morning, Afternoon, Evening, Night)
Session status (Cyan when the corresponding session is open, blue when it's closed)
Price levels names are
YTD-H : Yesterday's high
YTD-L : Yesterday's low
YTD-C : Yesterday's close
YTD-O : Yesterday's open
PWH : Previous week high
PWL : Previous week low
PWO : Previous week open
PWC : Previous week close
Levels width and colors can be modified.
You can also enable/disable the clock, and daily or weekly levels in the options panel.
Nothing more to say for now, I mainly integrated information I like to have, but I'll probably add new features in it if I get some.

Intraday FOREX london scalperThis forex System is only for ECN Broker Account.
Pairs: Major with spread < 0.0001 (EUR/USD).
Setup:
Wait for the market to make to 60 minute from the open.
If the market is near the intraday high be prepared to go short
If the market is near an intraday low for the same time period, then be prepared to go long.
Rules for entry
For sell setups: Enter on sell stop 1 pip from low of the last 15 min bar.
For buy setups: Enter in buy stop 1 pip from high of the last 15-minute bars.
Rules for exit
Take profit: Close out positions on 6 pips profit..
Stop Loss: Close out on 5 pips loss or if trade takes more than 1 minute.

NSDT Daily Key LevelsSimple script to show key levels of current day and previous day. Labels can be turned on and off as needed. Line colors, thickness and style can be changed. Modified the "M/W/D Level" script from paaax. Credit for original code goes to him. Link to script and profile posted in code of this script.

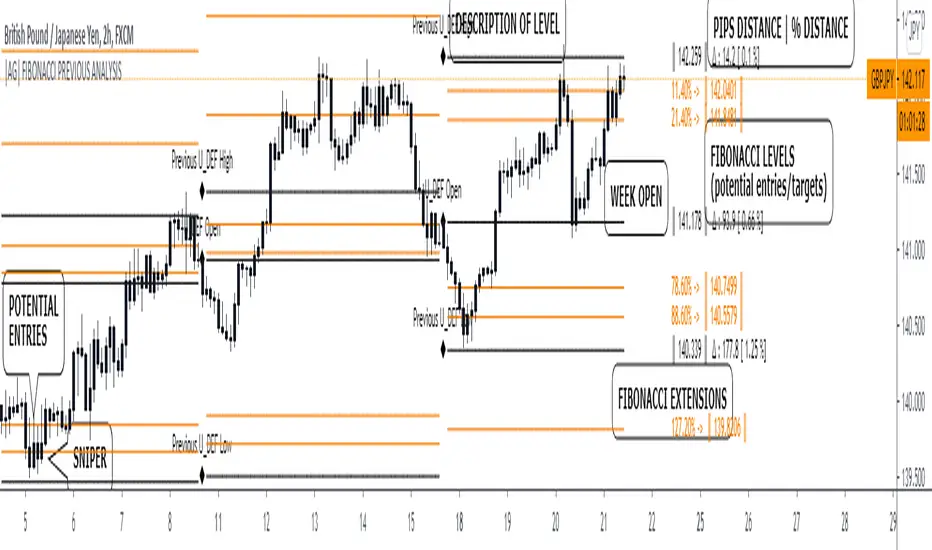
|AG| Previous Analysis█ OVERVIEW
Analysis of previous levels is one of the best strategies in order to get good entries or take profits levels. This analysis involves Monthly and Weekly Previous Levels and One User Definition Option. So u could select any period like Daily or even hours according to ur trading style. The previous levels are High and Low. And the Current (NOT PREVIOUS) open level.
This script also includes one Fibonacci Selector that will calculate the Fibbo level between previous High and Low Levels of the user selection. Almost everything could be modified in the input panel.
Input Options
A detailed explanation of input settings:
• # Of Previous
• This option leads us to select the number of previous weeks, months, or the user selection back.
• Example: If we select Previous High, Low WEEKLY so if # Of previous is one is going to be the past levels but if is 2 so consequently 2 previous levels.
• In the case of 0 is going to be the actual levels
• Fibbo & Label Selector
Here we can select the period.
• Monthly, Weekly, And User Definition is available.
• Fibonacci Selector :
• Here we could choose between different levels of Fibonacci or No_Plot Option
• Label Offset
• Here we select the amount of distance between label and actual price
• Time Start
• Here we could highlight one period START and END like one Week start day and end day.
• User Definition Value in order to be more flexible.
Interesting Code Lines:
• Fibonacci function
getFib(a, b)=>
fib1 = a + (b - a) * -0.618
fib2 = a + (b - a) * -0.270
fib3 = a + (b - a) * 0.114
fib4 = a + (b - a) * 0.214
fib5 = a + (b - a) * 0.382
fib6 = a + (b - a) * 0.500
fib7 = a + (b - a) * 0.618
fib8 = a + (b - a) * 0.786
fib9 = a + (b - a) * 0.886
ext_ = a + (b - a) * 1.270
ext1 = a + (b - a) * 1.618
• Exact Distance and % Distance
f_dist (_src, _src3) =>
float _dist = _src3 - _src
float _perc = _dist / _src3 //* 100
Floor Pivots_DWMBasic Pivot points.
Script is easy to modify to personal requirements, and explained step-by-step on Kodify.com.
Original script credits: Kodify.com (kodify.net)

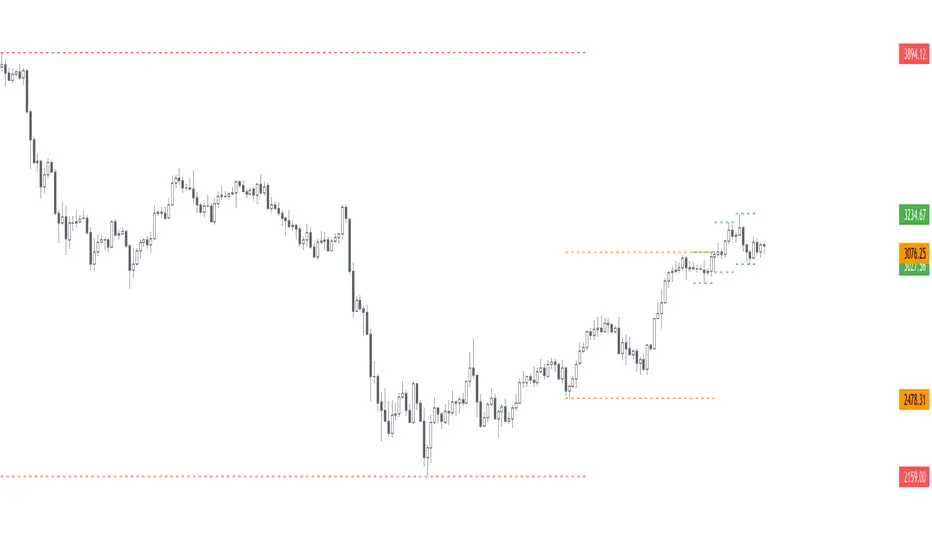
All past LevelsContains all past levels that we need
1. Previous Monthly High
2. Previous Monthly Low
3. Previous Weekly High
4. Previous Weekly Low
5. Previous Daily High
6. Previous Daily Low
7. Previous Monthly Range Average (PMH+PML)/2
8. Previous WeeklyRange Average (PWH+PWL)/2
9. Previous Daily Range Average (PDH+PDL)/2
10. Monthly Open
11. Weekly Open
12. Daily Open
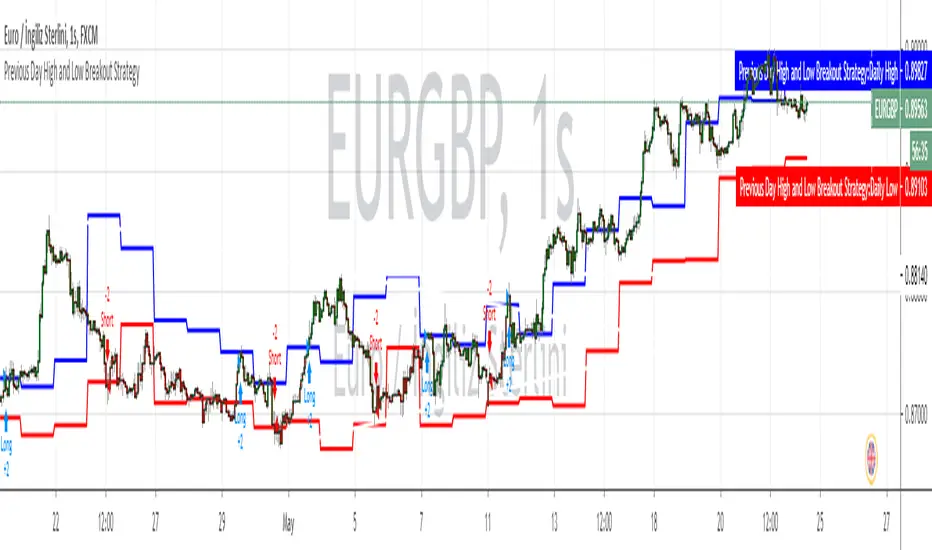
Previous Day Week Highs & LowsThis script plots the previous n day and week highs and lows (previous two days and previous week by default).
Here are some additional info about the script behavior:
Plots highs and/or lows
Plots for days and/or weeks
Day highs and lows are shown only on intraday timeframes
Week highs and lows are shown only on timeframes < weekly

Previous 2Days High/LowTesting simple range of highs/lows of previous 2 days, for reference, working on every timeframe.
