Zen ABR### **Average Bar Range (ABR) Levels** – A Simple Yet Powerful Scalping Tool
The **ABR Levels** indicator dynamically calculates the **average bar range** and plots three key levels on your chart:
✅ **0.5x ABR** – Half the average bar range
✅ **1x ABR** – The full average bar range
✅ **2x ABR** – Double the average bar range
This provides an **instant volatility gauge**, helping traders adjust position size, stop losses, and targets **based on current market conditions** rather than arbitrary numbers.
### **How It Works**
- The indicator calculates **the average range of the last 8 bars** (default setting, adjustable).
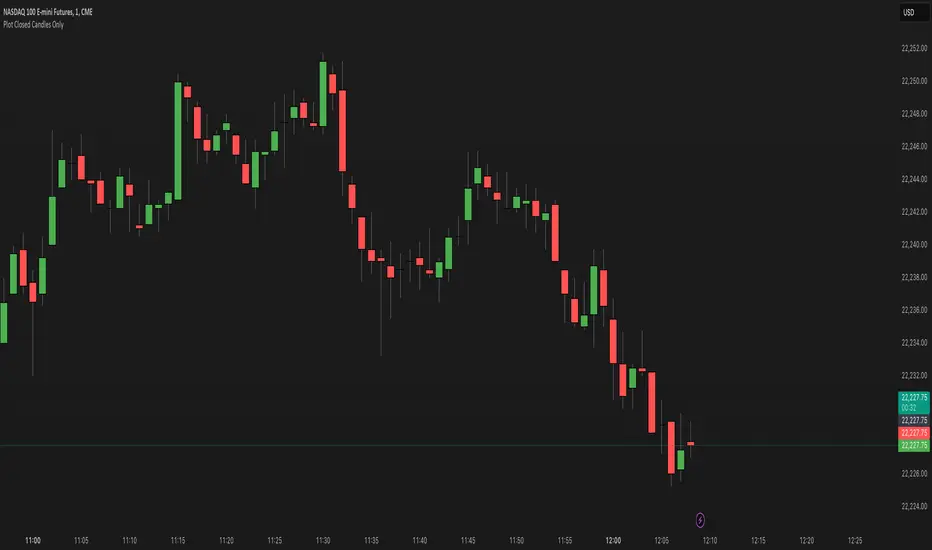
- The **ABR levels update in real time**, appearing in the **top-right corner of your chart** for easy reference.
- Works across **any instrument and timeframe** – great for scalpers and intraday traders.
### **Why Use ABR Levels?**
🚀 **Avoid oversized losses** – Trade dynamically instead of using fixed stops and targets.
📉 **Recognize shifts in market conditions** – Identify when volatility is expanding or contracting.
🎯 **Refine your entries & exits** – Use ABR levels to **scale** your positions intelligently.
### **Pro Tip:**
Never enter a trade **aiming for half-R** profits. If a trade goes badly, **you might manage it to break even or half-R**, but aiming for tiny wins will **wreck your long-term edge**.
🔹 **This script is open-source!** If you're not on TradingView, you can copy the code into any AI tool to generate it for your platform. 🚀
Penunjuk Pine Script®