100% Price Action Sequential Multi-TF Break Strategy Analyse 100% sur l'action du prix en regroupant timeframe H1, U15 et U5 sur un seul graphique
Priceactionstrategy

Sequential SMT + TCISD DeeptradeiqShort description. Educational indicator for studying Quarterly Theory Sequential smt concepts and True Change in State of Delivery across multiple timeframes.
FULL DESCRIPTION:
📊 Overview
An educational tool designed for studying Quarterly Theory Sequential concepts and temporal price analysis. This indicator visualizes divergence patterns between correlated instruments and tracks time-based price structures for analytical and learning purposes.
🔍 Key Features
Multi-Timeframe Analysis: Three modes - Quarters (6h), Sub-Quarters (90m), and Micro-Quarters (22.5m)
Sequential smt Divergence Visualization: Compare two instruments to study sequential divergence concepts with visual markers and invalidation tracking
True Change in State of Delivery (TCISD): Pattern identification with reference levels showing potential delivery state transitions
Customizable Visuals: Period boxes, high/low labels, color schemes, line styles, and information table
Timezone Support: DST-aware calculations for accurate period detection
⚙️ How It Works
The indicator divides trading sessions into time-based periods and tracks price extremes for each period. It compares the current instrument with a second pair (default: EURUSD) to identify when their price structures diverge sequentially - a key concept in Quarterly Theory education. Visual markers, lines, and labels help identify these patterns for study purposes.
🎯 Educational Applications
Study Quarterly Theory Sequential concepts in live market conditions
Understand temporal price structures and their characteristics
Analyze correlation and divergence between related instruments
Observe True Change in State of Delivery pattern formations
Practice pattern recognition and chart reading skills
Learn how price structures evolve across different timeframes
🛠️ Customization Options
Select analysis timeframe mode (Quarters/Sub-Quarters/Micro-Quarters)
Choose comparison pair for sequential analysis
Toggle visual elements (boxes, labels, lines, table)
Customize colors, styles, and sizes to match your chart theme
Show/hide invalidation markers and reference levels.
⚠️ IMPORTANT DISCLAIMER
This indicator is provided strictly for EDUCATIONAL and ANALYTICAL purposes. It does NOT provide trading signals, financial advice, or investment recommendations.
All patterns and markers are for study and observation only
Past price structures do not predict future movements
No guarantee of accuracy or profitability
Users must conduct independent analysis and risk assessment
All trading involves substantial risk of loss
Seek professional financial advice before making investment decisions
The creator assumes NO responsibility for trading decisions or financial outcomes from using this tool. This is a learning instrument - not a trading system.

Quantura - Quantified Price Action StrategyIntroduction
“Quantura – Quantified Price Action Strategy” is an invite-only Pine Script strategy designed to combine multiple price action concepts into a single trading framework. It integrates supply and demand zones, liquidity sweeps and runs, fair value gaps (FVGs), RSI filters, and EMA trend confirmation. The strategy also provides a visual overlay with dynamic trend-colored candles for easier chart interpretation. It is intended for multi-market use across cryptocurrencies, Forex, equities, and indices.
Originality & Value
The strategy is original in how it unifies several institutional-style price action elements and validates trades only when they align. This reduces noise compared to using single indicators in isolation. Its unique value lies in the combination of:
Supply & Demand detection: Dynamic boxes identified through pivots, ATR, and volume sensitivity.
Liquidity sweeps and runs: Detects when swing highs/lows are broken and retested, distinguishing between liquidity grabs (sweeps) and directional runs.
RSI filter: Can be set to normal or aggressive, confirming momentum before trades.
Fair Value Gaps (FVGs): Optional detection and filtering of price inefficiencies.
EMA filter: Aligns trades with the broader market trend.
Trend candle visualization: Candles dynamically colored bullish, bearish, or neutral, based on strategy positions.
This layered confluence approach ensures that entries are not taken on a single condition but require agreement across several dimensions of market structure, momentum, and order flow.
Functionality & Indicators
Supply & Demand Zones: Zones are created when pivots, ATR sensitivity, and volume thresholds overlap.
Liquidity: Swing highs and lows are tracked, with options for sweep (fakeout/reversal) or run (continuation) detection.
RSI: Confirms long signals when oversold and shorts when overbought, with configurable aggressiveness.
FVG filter: Adds validation by requiring price interaction with inefficiency zones.
EMA filter: Ensures longs are above EMA and shorts below EMA.
Signals & Visualization: Trade entries are marked on the chart, while candles change color to reflect trade direction and status.
Parameters & Customization
Supply & Demand: Sensitivity (swing range, volume multiplier, ATR multiplier) and display options.
Liquidity filter: Mode (Run or Sweep), display, and swing length.
RSI: Enable/disable, length, and style (normal or aggressive).
Fair Value Gaps: Sensitivity via ATR factor, optional volume filter, and display toggles.
EMA: Length, enable/disable, and visualization.
Risk management: Up to three configurable take-profit levels, stop-loss, break-even logic, and capital-based position sizing.
Visualization: Custom candle coloring and optional overlay for better clarity.
Default Properties (Strategy Settings)
Initial Capital: 10,000 USD
Position Size: 100% of equity per trade (backtest default)
Commission: 0.1%
Slippage: 1
Pyramiding: 0 (only one position at a time)
Note: The default of 100% equity per trade is used for testing purposes only and would not be sustainable in real trading. A typical allocation in practice would be between 1–5% of account equity per trade, sometimes up to 10%.
Backtesting & Performance
Backtests on XPTUSD over 2.5 years with the default settings produced:
164 trades
67.68% win rate
Profit factor: 1.7
Maximum drawdown: 27.81%
These results show how the confluence of supply/demand, liquidity, and RSI filters can produce robust setups. However, past performance does not guarantee future results. While the trade count (164) is sufficient for statistical analysis, results may vary across markets and timeframes.
Risk Management
Three configurable take-profit levels with percentage allocation.
Initial stop-loss based on user-defined percentage.
Dynamic stop-loss that adjusts with market movement.
Break-even logic that shifts stops to entry after predefined gains.
Position sizing based on risk percentage of equity.
This framework allows both conservative and aggressive configurations, depending on user preference.
Limitations & Market Conditions
Works best in volatile and liquid markets such as crypto, metals, indices, and FX.
May produce false signals in low-volume or sideways environments.
Unexpected news or macro events can override technical conditions.
Default position sizing of 100% equity is highly aggressive and should be reduced before any practical use.
Usage Guide
Add “Quantura – Quantified Price Action Strategy” to your chart.
Select Supply & Demand, Liquidity, RSI, EMA, and FVG settings according to your market and timeframe.
Configure risk management: take-profits, stop-loss, and risk-per-trade percentage.
Use the Strategy Tester to analyze statistics, equity curve, and performance under different conditions.
Optimize parameters before applying the strategy to different markets.
Author & Access
Developed 100% by Quantura. Published as an Invite-Only script.
Important
This description complies with TradingView’s publishing rules. It clarifies originality, explains the underlying logic, discloses default properties, and presents backtest results with realistic disclaimers.

Demand Supply Zones with MTFDemand Supply Zones with Multi-Timeframe Analysis
Overview:
Advanced institutional demand/supply zone detector with multi-timeframe analysis, proximity alerts, and trend dashboards. Identifies high-probability reversal areas using intelligent base detection and breakout validation across 4 simultaneous timeframes.
Core Unique Features:
• 💎 Elite Base Factor: Auto-detects institutional base patterns using pre-breakout candle body ratio analysis (adjustable 0.1-2.0).
• 🌐 4-Timeframe Zone Detection: Simultaneous MTF zones with individual "👁️ Tested" toggles for granular control - unprecedented in demand/supply indicators.
• 🚨 Proximity Dashboard: Real-time distance tracking to nearest zones (current + all MTF). Visual "APPROACHING!" alerts when price within threshold %.
• 📊 Zone Analytics Dashboard: Live counters for active/tested zones per timeframe with date range display and MTF status tracking.
• 📈 Multi-Timeframe Trend Analysis: 4-TF trend direction
• 🎯 Advanced EMA System: 10 multi-timeframe EMA-20 lines + Golden/Death Cross alerts with customizable styling.
• 📅 Date Range Filter: Performance optimization with calendar-based zone limits (10-500 zones).
• 🧩 Gap Filling: Optional gap bridging between base and leg-out candles for continuous zones.
• 🔐 No Repainting: MTF zones created only on confirmed bars with lookahead bias disabled.
How It Works:
1. Base Detection: Identifies consolidation candles (1-4 consecutive) with customizable body % threshold. Elite mode auto-detects when pre-breakout candle is significantly smaller.
2. Leg-Out Validation: Confirms breakout strength of legout
3. Zone Extension: Projects zones forward (10-500 bars).Fresh zones (green/red) turn gray when tested.
4. MTF Integration: Detects zones from 4 higher timeframes with independent parameters. Each MTF has individual tested zone toggle.
5. Analytics: Proximity dashboard calculates real-time distance to nearest zones. Trend dashboard shows direction across 4 TFs.
Important Notes:
• Educational Purpose: This indicator is for analysis and learning only. Does not guarantee future results.
• Risk Management Required: Always use stop losses and proper position sizing.
• Chart Type: Use standard Candlestick charts. Non-standard charts (Heikin Ashi/Renko) not recommended for accurate zone detection.
• Timeframe Requirements: MTF zones appear only when viewing lower timeframe than selected MTF (e.g., view 1H chart to see Daily MTF zones).
• Performance: Enable Date Range Filter when using multiple MTF timeframes to reduce computational load.
• Past Performance Disclaimer: Historical accuracy does not guarantee future trading results.
⭐ If you find this indicator valuable, please like and share!

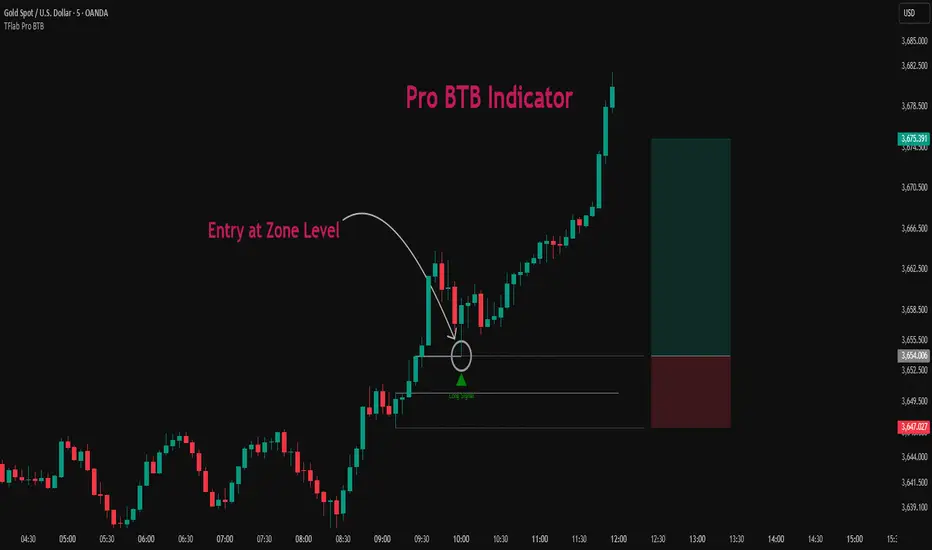
Pro BTB Pour Samadi Indicator [TradingFinder] Back To Breakeven🔵 Introduction
The Pro BTB (Professional Back To Breakeven) strategy is one of the most advanced price action setups, designed and taught by Mohammad Ali Poursamadi, an international Iranian trader and a well-known instructor of financial market analysis.
The main logic of this strategy is based on the natural behavior of the market :
Breakout of a key level: Price moves beyond an important support or resistance.
Retest / Back To Breakeven: Price returns to the broken level.
Continuation of the main trend: Entry at this point allows alignment with the dominant market direction.
To better understand Pro BTB, it is necessary to first know the concept of a Spike. A spike refers to a sudden and powerful movement of price in one direction, usually caused by heavy order flow. Such a move creates an Imbalance between buyers and sellers. Because the market does not have enough time to distribute orders fairly, it leaves an Inefficiency on the chart.
The direct result of this process is the formation of a Fair Value Gap (FVG) a gap between candles that shows trades were not distributed evenly. In simple terms: the spike is the cause, and Imbalance, Inefficiency, and FVG are its consequences.
In practice, Pro BTB works effectively in both bullish and bearish structures. In a Bullish Setup, a bullish spike first breaks a resistance level. Then, when price returns to that same level, a safe and low-risk buying opportunity is created. Conversely, in a Bearish Setup, a bearish spike breaks a support level, and when price comes back to the broken level, it provides the best conditions for a short entry. These two examples illustrate how Pro BTB logic provides precise, low-risk entries in both directions of the market.
🔵 How to Use
The Pro BTB (Back To Breakeven) strategy allows traders to enter precisely after price returns to the breakout level; this way the entry aligns with the natural market flow while risk is minimized. In practice, this method is simple yet powerful: first, identify a valid breakout on a key level, then wait for price to return to that level, and finally, take the entry in the direction of the main trend.
🟣 Bullish Setup
When a bullish spike occurs and a key resistance is broken, price usually returns to the same level. This level, now acting as support, provides the best opportunity for a long entry. In this scenario, the stop-loss is placed behind the breakout candle or slightly below the broken level, and the take-profit target should be defined with at least a 1:2 risk-to-reward ratio. With strong momentum, higher targets can also be considered.
🟣 Bearish Setup
In a bearish scenario, a bearish spike breaks a key support. After the breakout, price usually returns to the same level, which now acts as resistance. This creates the best conditions for a short entry. The stop-loss is placed behind the breakout candle or slightly above the broken level, while the take-profit target is set with a risk-to-reward ratio greater than 1:2.
🟣 General Rules of Pro BTB
To apply Pro BTB correctly, several key rules must be followed :
The breakout must be valid and occur on a key level.
Always wait for the retest; do not enter immediately after the breakout.
Entry should only happen when price touches the broken level and shows candlestick confirmation.
The stop-loss (SL) must be placed behind the breakout candle or the broken level.
The take-profit (TP) must always be at least twice the trade risk.
For higher reliability, the breakout should align with the trend on higher timeframes.
🟣 Six Entry Methods in Pro BTB
For greater flexibility, Pro BTB offers six standard entry methods :
Market Entry : Enter immediately at the breakout level.
Limit Order : Place a limit order on the breakout level.
Stop Order : Enter only after confirmation of continuation.
Confirmation Candle : Enter after a confirmation candle closes on the level.
Pattern Entry : Enter based on candlestick patterns such as Pin Bar or Engulfing.
Zone Entry : Enter from a zone instead of an exact point to account for market noise.
🔵 Setting
🟣 Spike Filter | Movement
Minimum Spike Bars : Defines the minimum number of consecutive candles required for a valid spike.
Movement Power : Enables or disables the momentum-based spike filter.
Movement Power Level : Sets the strength threshold; higher values filter out weaker moves and only detect strong spikes.
🟣 Spike Filter | Gap
Gap Filter : Enables or disables the gap filter.
Gap Type : Selects which type of gap should be detected (All Gaps, Significant, Structural, Major).
🟣 Spike Filter | Doji
Doji Tolerance : Defines whether doji candles are allowed within a spike.
Max Doji Body Ratio : Maximum ratio of body-to-total candle size for classifying a candle as a doji.
Max Doji in Spike Ratio : Maximum percentage of doji candles allowed within a spike.
🟣 Position Management
Stop-Loss Threshold : Enables or disables the stop-loss threshold feature.
Stop-Loss Threshold Value : Defines the value of the stop-loss threshold for risk management.
Risk-Reward Ratio : Sets the desired risk-to-reward ratio (e.g., 1:1 or 1:2).
Include SL Threshold in R:R : Determines whether the stop-loss threshold is included in risk-to-reward calculations.
🟣 Display Settings
Display Mode : Chooses between Setup (showing setups) or Signal (showing trade signals).
Show Entry Levels: Displays entry levels on the chart (buy/sell zones) when enabled
Only Display the Last Position : Displays only the most recent position on the chart when enabled.
Setup Width Drawing : Adjusts the visual width of the setup drawings on the chart for better visibility.
🟣 Alert
Alert : Enables alert notifications. When turned on, you can set TradingView alerts to receive notifications once the setup or signal conditions are met
🔵 Conclusion
The Pro BTB (Back To Breakeven) strategy is a smart and structured entry method based on natural market behavior after a breakout and retest of the broken level. It helps traders avoid emotional, high-risk entries by waiting for market confirmation and entering precisely at a point that aligns with the main trend and sits closest to the key level.
The simplicity of its rules, flexibility in entry methods, and a risk-to-reward ratio above 2 have made Pro BTB one of the most popular tools among price action traders. Nevertheless, as with any strategy, it is recommended to practice it in demo accounts or through personal backtesting before applying it to real trading, in order to find the entry conditions that best suit your trading style.
VIV 1.0 // AN IDEA BY Sunil SethiVIV (Very Important Volume) is a custom-built TradingView indicator designed to decode the psychology behind price and volume behavior — whether you are a breakout trader, reversal trader, or use your own discretionary logic. VIV reveals where institutional activity is likely taking place, highlights trend stages, uncovers volume footprints, and identifies high-probability trading zones — all with zero lag & 100% price-action-based logic.
Key Features (Expanded Concepts)
01. Trend-Based Analysis with Stages and Background Colors
VIV breaks down the market into three color-coded stages based on trend confirmation:
Stage 3: Uptrend (Short-Term Trend Confirmation)
Marks early accumulation or consolidation.
Shows possible reversal zones.
Short-term traders use this to spot opportunities before a breakout.
Stage 2: Uptrend (Medium-Term Trend Confirmation)
Highlights the start of a strong directional move.
Confidence zone for position building and breakout-following strategies.
Stage 1: Uptrend (Long-Term Trend Confirmation)
Indicates long term strength.
These trend stages reflect the emotional phases of market participants and the shifting balance of power between buyers and sellers. You can toggle trend backgrounds for intraday, daily, weekly, and monthly trends and change their background colors.
Note : If the % difference in Stage 3 exceeds 10%, the stock is considered extended. Such setups should be evaluated with caution before making any trade decisions.
02. . Volume Footprints (➕ Signs)
VIV intelligently identifies past candles with high-volume activity (accumulation/distribution).
These are not typical breakout volumes, but subtle footprints of smart money.
Help spot reversal points, liquidity zones, and retest levels.
Valuable for both breakout and reversal traders to confirm zone strength.
You can enable or disable these lines, adjust color, style, and width via VIV Line Settings.
03. VIV || H, VIV || L and VIV || C Zones
Automatically plots horizontal levels from high-volume, high-activity candles—revealing the footprints of smart money.
VIV || H (High) = Top of important bar.
VIV || L (Low) = Bottom of important bar.
VIV || C (Close) = Close price of important bar.
Key levels used by traders for:
Entries
Stop-loss placement
Targets
These zones show where price historically reacted due to strong institutional presence. They come with customizable label colors and backgrounds.
04. Price Tightness Detection
Detects when two or more candles compress within the range of a larger parent candle.
Represents indecision, contraction, or coiling behavior before major price moves.
Ideal for both:
Breakout traders looking for base formations.
Reversal traders watching for exhaustion.
Color-coded markers indicate such tight price zones — disabled by default but can be enabled.
05. Technical Stats Panel (Important Data Table)
An insightful dashboard providing:
ADR% – Volatility-based movement expectations (change period via input).
ATR – Real volatility indicator.
Average Volume / Price Volume – Customizable average period and currency unit (INR/USD).
Trend Data:
10/20/200 SMAs
10-week & 20-week trend stages (custom SMA period/timeframe supported)
Relative Strength vs Benchmark
RS grade: GREAT, GOOD, FAIR, UNCERTAIN, UNDER PERFORMER, LAGGARD, POOR
When RS is comparing: BOTH STRONG, BOTH WEEK
You can also display the benchmark symbol name and change the symbol for relative strength comparison.
06. Relative Strength Grade Change Alerts
VIV tracks relative strength changes against a chosen benchmark (e.g., Nifty MidSmallCap).
The above tells us that if the stock is stronger or weaker than the benchmark.
Detects when relative strength shifts from:
Strong → Weak (e.g., EXCELLENT → GOOD → FAIR)
Weak → Strong (e.g., LAGGARD → POOR → FAIR → GOOD)
Sudden transitions (e.g., WORST → FAIR, BOTH WEAK → GOOD, BOTH GOOD → POOR)
BOTH WEAK → GOOD or BOTH GOOD → POOR means stock's strength is better/poor than the benchmark
and more.
These alerts can help in:
Early trend following
Exiting when RS degrades
Adding positions when RS improves
07. Smart Alerts (Built-in Conditions)
You can set alerts for (any timeframe)
Positive Trend
Negative Trend
Rise in Volume
Relative Strength Changed
Set your preferred interval and trigger type in TradingView to stay updated without chart-watching.
08. Pivot Points
VIV allows visualizing pivot highs and lows using a dynamic window (left/right lookback).
Customizable label text and background color.
Helpful in identifying support or resistance zones and breakout points.
09. Customization Options
Toggle modules like trend background, labels, stats, and volume zones.
Customize colors for:
Labels
Zones
Trend backgrounds
Table text, borders, and alignment
Adjust visibility per timeframe (inputs tab)
How to Use VIV Effectively
Use trend background colors to identify phase (base, uptrend, top).
Look for stage 1, stage 2 and stage 3 for short, medium and long term trend.
Watch for old high-volume candles (➕ marks) to plan entries/exits.
Trade around ➕ marks, VIV || H and VIV || L levels.
Use tight price zones to anticipate explosive moves.
Monitor table for ATR/ADR, RS grade, and moving averages.
Use alerts to automate monitoring of trend, volume, or RS shifts.
Best Suited For:
Reversal traders (demand/supply based)
Breakout traders using base-building logic
Systematic or discretionary traders
Anyone who values price-volume behavior over lagging indicators

Black Tie Report FrameworkThe Black Tie Report Framework indicator is a market structure and bias analysis tool designed to provide traders with key price levels, session insights, and trend classification.
Key Features:
- Daily Separators: Automatically marks the start of each trading day for better session tracking.
- Bias Framework: Allows users to set a custom timeframe (e.g., daily, weekly, or monthly) to establish bullish, bearish, or neutral bias based on price action.
- Session Markers: Highlights key trading sessions such as Asia, London, and New York to identify volume shifts.
- Liquidity Levels: Plots significant highs and lows from different timeframes, helping traders focus on key liquidity zones.
- Automated Trend Identification: Uses predefined conditions to classify market direction and potential reversal points.
This framework is useful for traders looking to integrate objective market structure analysis into their strategy, eliminating noise and providing clear, actionable price levels for decision-making.

Flux Charts - PAT Automation💎 GENERAL OVERVIEW
The PAT Automation is a powerful and versatile tool designed to help traders rigorously test their trading strategies against historical market data. With an array of advanced settings, traders can fine-tune their strategies, assess performance, and identify key improvements before deploying in live trading environments. This backtester offers a wide range of configurable settings, explained within this write-up.
Features of the PAT Automation:
Step By Step : Configure your strategy step by step, which will allow you to have OR & AND logic in your strategies.
Highly Configurable : Offers multiple parameters for fine-tuning trade entry and exit conditions.
Multi-Timeframe Analysis : Allows traders to analyze multiple timeframes simultaneously for enhanced accuracy.
Provides advanced stop-loss, take-profit, and break-even settings.
Incorporates volume-based conditions, liquidity grabs , order blocks , market structures and fair value gaps for refined strategy execution.
🚩 UNIQUENESS
The PAT Automation stands out from conventional backtesting tools due to its unparalleled flexibility, precision, and advanced trading logic integration. Key factors that make it unique include:
✅ Comprehensive Strategy Customization – Unlike traditional backtesters that offer basic entry and exit conditions, PAT Automation provides a highly detailed parameter set, allowing traders to fine-tune their strategies with precision.
✅ Multi-Timeframe Price Action Features – This is the first-ever tool that allows traders to backtest price action with multi-timeframe features such as Fair Value Gaps (FVGs), Inversion Fair Value Gaps (IFVGs), Order Blocks & Breaker Blocks.
✅ Customizable Take-Profit Conditions – Offers various methods to set take-profit exits, including using core features from price action, and fixed exits like ATR, % change or price change, enabling traders to tailor their exit strategies to specific market behaviors.
✅ Customizable Stop-Loss Conditions – Provides several ways to set up stop losses, including using concepts from price action and trailing stops or fixed exits like ATR, % change or price change, allowing for dynamic risk management tailored to individual strategies.
✅ Integration of External Indicators – Allows the inclusion of other indicators or data sources from TradingView for creating strategy conditions, enabling traders to enhance their strategies with additional insights and data points.
By integrating these advanced features, PAT Automation ensures that traders can rigorously test and optimize their strategies with great accuracy and efficiency.
📌 HOW DOES IT WORK?
The first setting you will want to set it the pyramiding setting. This setting controls the number of simultaneous trades in the same direction allowed in the strategy. For example, if you set it to 1, only one trade can be active in any time, and the second trade will not be entered unless the first one is exited. If it is set to 2, the script will handle both of them at the same time. Note that you should enter the same value to this pyramiding setting, and the pyramiding setting in the "Properties" tab of the script for this to work.
For deep backtesting, you can set "Max Distance To Last Bar" to "Unlimited". If you encounter any memory issues, try decreasing this setting to a lower value.
You can enable and set a backtesting window that will limit the entries to between the start date & end date.
Then, you can enter your desired settings to Price Action features like FVGs, IFVGs, Order Blocks, Breaker Blocks, Liquidity Grabs, Market Structures, EQH & EQL and Volume Imbalances. You can also enable and set up to 3 timeframes, which you can use later on when customizing your strategies enter / exit conditions.
Entry Conditions
From the "Long Conditions" or the "Short Conditions" groups, you can set your position entry conditions. For settings like "initial capital" or "order size", you can open the "Properties" tab, where these are handled.
The PAT Automation can use the following conditions for entry conditions :
1. Order Block (OB)
Detection: Triggered when an Order Block forms or is detected
Retest: Triggered when price retests an Order Block. A retest is confirmed when a candle enters an Order Block and closes outside of it.
Retracement: Triggered when price touches an Order Block
Break: Triggered when an Order Block is invalidated by candle close or wick, depending on the user's input.
2. Breaker Block (BB)
Detection: Triggered when a Breaker Block forms or is detected
Retest: Triggered when price retests a Breaker Block. A retest is confirmed when a candle enters a Breaker Block and closes outside of it.
Retracement: Triggered when price touches a Breaker Block
Break: Triggered when a Breaker Block is invalidated by candle close or wick, depending on the user's input.
3. Fair Value Gap (FVG)
Detection: Triggered when an FVG forms or is detected
Retest: Triggered when price retests an FVG. A retest is confirmed when a candle enters an FVG and closes outside of it.
Retracement: Triggered when price touches an FVG
Break: Triggered when an FVG is invalidated by candle close or wick, depending on the user's input.
4. Inversion Fair Value Gap (IFVG)
Detection: Triggered when an IFVG forms or is detected
Retest: Triggered when price retests an IFVG. A retest is confirmed when a candle enters an IFVG and closes outside of it.
Retracement: Triggered when price touches an IFVG
Break: Triggered when an IFVG is invalidated by candle close or wick, depending on the user's input.
5. Break of Structure (BOS)
Detection: Triggered when a BOS forms or is detected
6. Change of Character (CHoCH)
Detection: Triggered when a CHoCH forms or is detected
7. Change of Character Plus (CHoCH+)
Detection: Triggered when a CHoCH+ forms or is detected
8. Volume Imbalance (VI)
Detection: Triggered when a Volume Imbalance forms or is detected
9. Equal High (EQH)
Detection: Triggered when an EQH is detected
10. Equal Low (EQL)
Detection: Triggered when an EQL is detected
11. Buyside Liquidity Grab
Detection: Triggered when a liquidity grab occurs at Buyside Liquidity (BSL).
12. Sellside Liquidity Grab
Detection: Triggered when a liquidity grab occurs at Sellside Liquidity (SSL).
🕒 TIMEFRAME CONDITIONS
The PAT Automation supports Multi-Timeframe (MTF) features, just like the Price Action Toolkit. When setting an entry condition, you can also choose the timeframe.
To set up MTF conditions, navigate to the 'Timeframes' section in the settings, select your desired timeframes, and enable them. You can choose up to three timeframes.
Once you've selected your timeframes, you can use them in your strategy. When setting long and short entry / exit conditions, you can choose from Timeframe 1, Timeframe 2, or Timeframe 3.
External Conditions
Users can use external indicators on the chart to set entry conditions.
The second dropdown in the external condition settings allows you to choose a conditional operator to compare external outputs. Available options include:
Less Than or Equal To: <=
Less Than: <
Equal To: =
Greater Than: >
Greater Than or Equal To: >=
The position entry conditions work like this ;
Each side has 5 Price Action conditions and 1 Source condition. Each condition can be enabled or disabled using the checkbox on the left side.
For Price Action Conditions, you can set a direction: "Any", "Bullish" or "Bearish".
Then a Price Action Feature, like "FVG" or "Order Block".
The last part of our constructed condition is the alert type, which you can select between "Detection", "Retest", "Retracement" or "Break".
Now you should have a constructed condition, which should look like "Bullish Order Block Retest".
You can select which timeframe should this condition work on from Timeframe 1, 2 or 3. If you select "Any Timeframe", the condition will work for all timeframes.
Lastly select the step of this condition from 1 to 6.
The Source Condition
The last condition on each side is a source condition that is different from the others. Using this condition, you can create your own logic using other indicators' outputs on your chart. For example, suppose that you have an EMA indicator in your chart. You can have the source condition to something like "EMA > high".
The Step System
Each condition has a step number, and conditions are in topological order based on them.
The conditions are executed step by step. This means the condition with step 2 cannot be executed before the condition with step 1 is executed.
Conditions with the same step numbers have "OR" logic. This means that if you have 2 conditions with step 3, the condition with step 4 can trigger after only one of the step 3 conditions is executed.
➕ OTHER ENTRY FEATURES
The PAT Automation allows traders to choose when to execute trades and when not to execute trades.
1. Only Take Trades
This setting lets users specify the time period when their strategy can open or execute trades.
2. Don't Take Trades
This setting lets users specify time periods when their strategy can't open or execute trades.
↩️ EXIT CONDITIONS
1. Exit on Opposite Signal
When enabled, a long position will close when short entry conditions are met, and a short position will close when long entry conditions are met.
2. Exit on Session End
When enabled, positions will be closed at the end of the trading session.
📈 TAKE PROFIT CONDITIONS
There are several methods available for setting take profit exits and conditions.
1. Entry Condition TP
Users can use entry conditions as triggers for take-profit exits. This setting can be found under the long and short exit conditions.
2. Fixed TP
Users can set a fixed TP for exits. This setting can be found under the long and short exit conditions. Users can choose between the following:
Price: This method triggers a TP exit when price reaches a specified level. For example, if you set the Price TP to 10 and buy NASDAQ:TSLA at $190, the trade will automatically exit when the price reaches $200 ($190 + $10).
Ticks: This method triggers a TP exit when price moves a specified number of ticks.
Percentage (%): This method triggers a TP exit when price moves a specified percentage.
ATR: This method triggers a TP exit based on a specified multiple of the Average True Range (ATR).
📉 STOP LOSS CONDITIONS
There are several methods available for setting stop-loss exits and conditions.
1. Entry Condition SL
Users can use entry conditions as triggers for stop-loss exits. This setting can be found under the long and short exit conditions.
2. Fixed SL
Users can set a fixed SL for exits. This setting can be found under the long and short exit conditions. Users can choose between the following:
Price: This method triggers a SL exit when price reaches a specified level. For example, if you set the Price SL to 10 and buy NASDAQ:TSLA at $200, the trade will automatically exit when the price reaches $190 ($200 - $10).
Ticks: This method triggers a SL exit when price moves a specified number of ticks.
Percentage (%): This method triggers a SL exit when price moves a specified percentage.
ATR: This method triggers a SL exit based on a specified multiple of the Average True Range (ATR).
3. Trailing Stop
An explanation & example for the trailing stop feature is present on the write-up within the next section.
Exit conditions have the same logic of constructing conditions like the entry ones. You can construct a Take-Profit Condition & a Stop-Loss Condition. Note that the Take-Profit condition will only work if the position is in profit, regardless of if it's triggered or not. The same applies for the Stop-Loss condition, meaning that it will only work if the position is in loss.
You can also set a Fixed TP & Fixed SL based on the price movement after the position is entered. You have options like "Price", "Ticks", "%", or "Average True Range". For example, you can set a Fixed TP like "5%", and the position will be entered once it moves 5% up in a long position.
Trailing Stop
For the Fixed SL, you also have a "Trailing" stop option, which you can set it's activation level as well. The Trailing stop activation level and it's value are expressed in ticks. Check this scenerio for an example :
We have a ticker with a tick value of $1. Our Trailing Stop is set to 10 ticks and activation level is set to 30 ticks.
We buy 1 contract when the price is $100.
When the price becomes $110, we are in $10 (10 ticks) profit and the trailing stop is now activated.
The current price our stop's on is $110 - $30 (30 ticks), which is the level of $80.
The trailing stop will only move if the price moves up the highest high the price has been after we entered the position.
Let's suppose that price moves up $40 right after our trailing stop is activated. The price will now be $150, and our trailing stop will sit on $150 - $30 (30 ticks) = $120.
If the price is down the $120 level, our stop loss will be triggered.
There is also a "Hard SL" option designed for a backup stop-loss when trailing stops are enabled. You can enable & set this option and if the price goes down before our trailing stop even activates, the position will be exited.
You can also move stop-loss to the break-even (entry price of the position) after a certain profit is achieved using the last setting of the exit conditions. Note that for this to work, you will need to have a Fixed SL set-up.
➕ OTHER EXIT FEATURES
1. Move Stop Loss to Breakeven
This setting allows the strategy to automatically move the SL to Breakeven (BE) when the position is in profit by a certain amount. Users can choose between the following:
Price: This method moves the SL to BE when price reaches a specified level.
Ticks: This method moves the SL to BE when price moves a specified number of ticks.
Percentage (%): This method moves the SL to BE when price moves a specified percentage.
ATR: This method moves the SL to BE when price moves a specified multiple of the Average True Range (ATR).
Example Entry Scenario
To give an example , check this scenario; out conditions are :
LONG CONDITIONS
Bullish Order Block Detection, Step 1
Bullish CHoCH Detection, Step 2
Bullish Volume Imbalance Detection, Step 2
Bullish IFVG Retest, Step 3
First, the strategy needs to detect a Bullish Order Block in order to start working.
After it's detected, now it's looking for either a CHoCH, or a Volume Imbalance to proceed to the next step, the reason for this is that they both have the same step number.
After one of them is detected, the strategy will consistently check all IFVGs for a retest. If the retest occurs, a long position will be entered.
⏰ ALERTS
This indicator uses TradingView's strategy alert system. All entries and exits will be sent as an alert if configured. It's possible to further customize these alerts to your liking. For more information check TradingView's strategy alert customization page: www.tradingview.com
⚙️ SETTINGS
1. Backtesting Settings
Pyramiding: Controls the number of simultaneous trades allowed in the strategy. This setting must have the same value that is entered on the script's properties tab on the settings pane.
Max Distance to Last Bar: Determines the depth of historical data used to prevent memory overload.
Enable Custom Backtesting Period: Restricts backtesting to a specific date range.
Start & End Time Configuration: Define precise start and end dates for historical analysis.
2. Fair Value Gaps Settings
Zone Invalidation: Select between "Wick" and "Close" invalidation.
Filtering: Choose between "Average Range" and "Volume Threshold".
FVG Sensitivity: Ranges from Extreme to Low to detect FVGs with varying strictness.
Allow Gaps: Enables analysis on tickers that have different open-close price gaps.
3. Inversion Fair Value Gaps Settings
Zone Invalidation: Choose between "Wick" and "Close".
4. Order Block Settings
Swing Length: Adjusts the minimum number of bars required for OB formation.
Zone Invalidation Method: Select between "Wick" and "Close".
5. Breaker Block Settings
Zone Invalidation: Set invalidation method as "Wick" or "Close".
6. Liquidity Grabs Settings
Pivot Length: Adjusts the number of bars used to detect liquidity grabs.
Wick-Body Ratio: Defines the proportion of wick-to-body size for liquidity grab detection.
7. Multi-Timeframe Analysis
Enable Up to Three Timeframes: Select and analyze trades across multiple timeframes.
8. Market Structures
Swing Length: Defines the number of bars required for structure shifts.
Includes BOS, CHoCH, CHoCH+ Detection.
9. Equal Highs & Lows
ATR Multiplier: Defines the sensitivity of equal highs/lows detection.
10. Volume Imbalances
Gap Size Sensitivity: Ranges from "Ultra" to "Low".
Disable Overnight Gaps: Filters out volume imbalances occurring due to overnight gaps.
11. Entry Conditions for Long & Short Trades
Multiple Conditions (1-6): Configure up to six independent conditions per trade direction.
Condition Types: Options include Detection, Retest, Retracement, and Break.
Timeframe Specification: Choose between "Any Timeframe", "Timeframe 1", "Timeframe 2", or "Timeframe 3".
Trade Execution Filters: Restrict trades within specific trading sessions.
12. Exit Conditions for Long & Short Trades
Exit on Opposite Signal: Automatically exit trades upon opposite trade conditions.
Exit on Session End: Closes all positions at the end of the trading session.
Multiple Take-Profit (TP) and Stop-Loss (SL) Configurations:
TP/SL based on % move, ATR, Ticks, or Fixed Price.
Hard SL option for additional risk control.
Move SL to BE (Break Even) after a certain profit threshold.

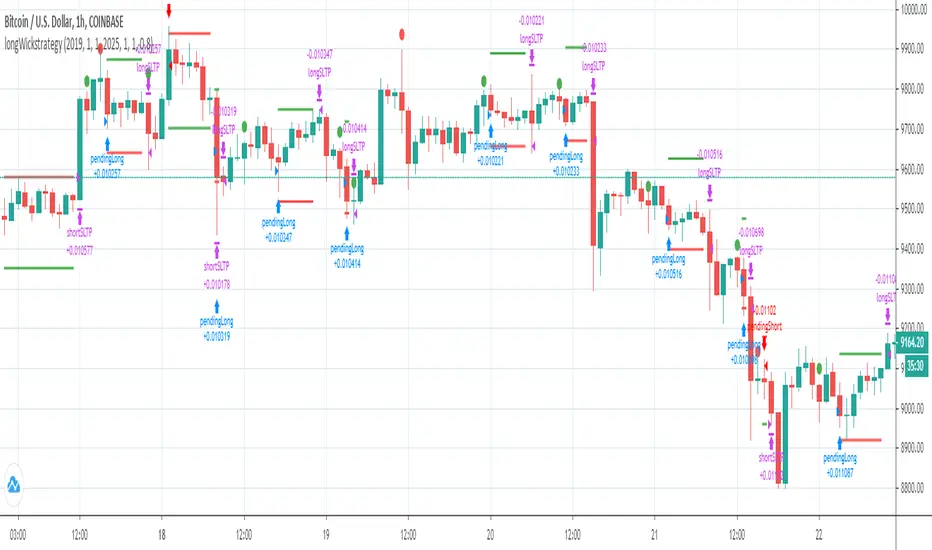
Simple Time-Based Strategy(Price Action Hypothesis)Core Theory: Trend Continuation Pattern Recognition**
1. **Price Action Hypothesis**
The strategy is built on the assumption that consecutive price movements (3-bar patterns) indicate momentum continuation:
- *Long Pattern*: Three consecutive higher closes combined with ascending highs
- *Short Pattern*: Three consecutive lower closes combined with descending lows
This reflects a belief that sustained directional price movement creates self-reinforcing trends that can be captured through simple pattern recognition.
2. **Time-Based Risk Management**
Implements a dynamic exit mechanism:
- *Training Phase*: 5-bar holding period (quick turnover)
- *Testing Phase*: 10-bar holding period (extended exposure)
This dual timeframe approach suggests the hypothesis that market conditions may require different holding durations in different market eras.
3. **Adaptive Market Hypothesis**
The structure incorporates two distinct phases:
- *Training Period (11 years)*: Pattern recognition without stop losses
- *Testing Period*: Pattern recognition with stop losses
This assumes markets may change character over time, requiring different risk parameters in different epochs.
4. **Asymmetric Risk Control**
Implements stop-losses only in the testing phase:
- Fixed 500-pip (point) stop distance
- Activated post-training period
This reflects a belief that historical patterns might need different risk constraints than real-time trading.
5. **Dual-Path Validation**
The split between training/testing phases suggests:
- Pattern validity should first be confirmed without protective stops
- Real-world implementation requires added risk constraints
6. **Market Efficiency Paradox**
The simultaneous use of both long/short entries assumes:
- Markets exhibit persistent inefficiencies
- These inefficiencies manifest differently in bullish/bearish conditions
- A symmetric approach can capture opportunities in both directions
7. **Behavioral Finance Elements**
The 3-bar pattern recognition potentially exploits:
- Herd mentality in trend formation
- Delayed reaction to price momentum
- Cognitive bias in trend confirmation
8. **Quantitative Time Segmentation**
The annual-based period division (training vs testing) implies:
- Market cycles operate on multi-year timeframes
- Strategy robustness requires validation across different market regimes
- Parameter sensitivity needs temporal validation
This strategy combines elements of technical pattern recognition, temporal adaptability, and phased risk management to create a systematic approach to trend exploitation. The theoretical framework suggests markets exhibit persistent but evolving patterns that can be systematically captured through rule-based execution.

Higher Timeframe Price Action ScannerThis is a higher timeframe scanner that detects the price action trend on multiple timeframes and displays them all as red or green dots. You’ll be able to see the real time and historical price action trends so you can trade in the same direction of the overall trend on higher timeframes. You can also set it to scan a different ticker if you choose. If you find pairs that correlate very well, you can use two scanners and look at both of them for extra trend confluence.
CALCULATIONS
This scanner uses the same price action formula from our other indicator titled 1 Minute Scalping Indicator which can be found on our profile. It has Scalp Mode and Swing Mode. Both modes use the exact same price action parameters for signals, but Swing Mode will only give signals when the price action parameters are met AND the close is higher than the previous high for bull signals or when the close is lower than the previous low for bear signals.
HOW TO USE
The top line of the scanner shows the price action trend for the current chart timeframe and the rest are using the higher timeframe that you set in the input settings. They start with higher timeframe #1 as the second line from the top and go down from there.
When most or all of the dots are green, you should be looking for long positions and when most or all of the dots are red, you should be looking for short positions.
Since this scanner is using pure price action to identify trends, it’s a reliable way to see what multiple timeframes are doing.
PAIRINGS
Use this with the 1 Minute Scalping Indicator so you can get the signals and candles colored per the price action on your chart as well as see the higher timeframe price action trend from the scanner. Using both together will help you make better trading decisions.
MARKETS
You can use this scanner on any market.
TIMEFRAMES
This scanner will scan the current chart timeframe and display the result on the top line, then the lines below that will display the results from the higher timeframes you choose in the settings. It has timeframes from 1 minute all the way up to 1 year.

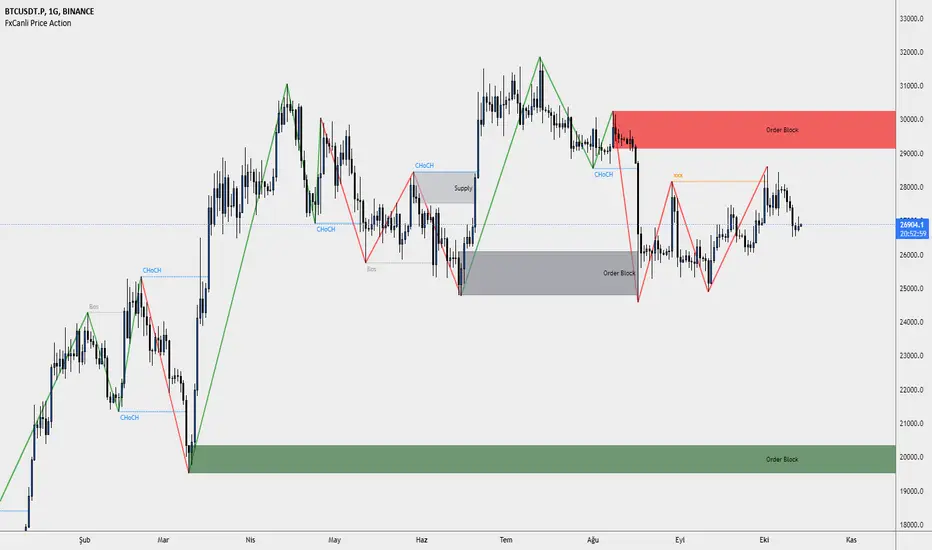
FxCanli Price ActionEN - FxCanli TradingView Price Action indicator can draw and alert at;
Break of Structure (BOS),
Change of Character (CHoCH),
Liquidity,
Order Block,
Power Zone.
TR - FxCanli TradingView Price Action indikatörü grafiklerinizde;
Break of Structure (BOS)
Change of Characte (CHoCH)
Liquidity
Order Block
Power Zone seviyelerini otomatik olarak çizer ve alarm verir.
FEATURES & EXAMPLES / ÖZELLİKLER & ÖRNEKLER
**************************************************************
Market Structure;
EN - You can easly follow market structure, Up Trend with green waves, Down trend with Red waves
TR - Market yapısını kolayca takip edebilirsiniz. Yukarı trendi yeşil dalgalar ile, Aşağı trendi kırmızı dalgalar ile.
Change of Character (CHoCH)
*************************************
EN - Shows trend reversals
TR - Trend dönüşümlerini gösterir
Break of Structure (BOS)
******************************
EN - Shows trend continuations
TR - Devam eden trendleri gösterir
Liquidity
***********
EN - Shows Liquidity levels
TR - Likidite seviyelerini gösterir
Order Block
***************
EN - Shows Order Block levels which is a technical analysis technique that tracks the accumulation of orders (when bullish) and distribution of orders (when bearish) of banks and institutional traders.
TR - Bankaların ve kurumsalların emir birikimini (yükseliş olduğunda) ve emir dağılımını (düşüş olduğunda) Order Block olarak gösterir.
HorseShoe - At NalıHorseShoe - At Nalı
English
HORSEHOE FORMATION
It is actually a kind of bobbin. As with the bobbin, the needles of the candles are not taken into account much.The difference is that there are only four candlesticks in this formation. There is no limit to this in the bobbin.In addition, it is important which of the bars forming the bobbin is longer or shorter than which.is not. This is very important in a horseshoe. There is a rule for the length and shortness of the bars.Candlesticks in a horseshoe showing the bearish sequentially rising, falling, rising and repeatingin the form of falling bars. Also the lengths of the first and fourth bars, i.e. price opening andThe differences between the closing must be longer than the second and third bar. So those on the sideshould be clearly larger than the middle ones. For the rise, the bars are falling-rising-falling in order.The rising candle should be in the form of a bar. Likewise the first and last barsshould be longer than the middle ones.Of the first and fourth bars, it is better if the fourth bar is longer than the first.was the signal. But the fact that they are equal or the first one is long does not mean this formation. Attentionthe first and last bars that need to be beat are clearly longer than the middle onesrequired. A millimeter long means a very weak signal.
It is valid for every price and parity. But this is not a magic wand, so every horseshoemay not be the correct signal. Trend, Supdem, Correlation and other similar components are alsois involved, a highly efficient signal is formed. Well reviewed onexperience must be gained. More like an indicator to show the direction of the price rather than a signalshould be used.
Turkish
AT NALI FORMASYONU
Aslında bir tür bobindir. Bobinde olduğu gibi mumların iğneleri çok dikkate alınmaz. Farkı, bu oluşumda sadece dört mum çubuk vardır. Bobinde bunun sınırı yoktur. Ayrıca bobini oluşturan barların hangisinin hangisinden uzun ya da kısa olduğu önemli değildir. At nalında bu çok önemlidir. Barların uzunluğu kısalığı ve sırasında bir kural vardır. Düşüşü gösteren at nalında mum çubuklar sırayla yükselen düşen yükselen ve tekrar düşen barlar şeklindedir. Ayrıca birinci ve dördüncü barların uzunlukları, yani fiyat açılış ve kapanışı arasındaki farkları, ikinci ve üçüncü bardan daha uzun olmalıdır. Yani kenardakiler ortadakilerden net bir şekilde büyük olmalı. Yükseliş için ise barlar sırayla düşen-yükselen düşen-yükselen mum çubuk şeklinde olmalıdır. Aynı şekilde ilk ve son barlar ortadakilerden uzun olmalıdır. Birinci ve dördüncü barlardan dördüncü barın birinciden uzun olması daha güze bir sinyaldi. Fakat eşit olmaları ya da birincinin uzun olması da bu oluşumu bozmaz. Dikkat edilmesi gereken ilk ve son barların açık bir şekilde ortadakilerden uzun olması gerekmektedir. Milim farkla uzun olması çok zayıf bir sinyal olması anlamına gelir.
kaynak:
Price Action TR

Traders Hedge - Pro with AlertsDear Traders,
"You can't connect the dots looking forward; you can only connect them looking backwards. So you have to trust that the dots will somehow connect in your future." ~Steve Jobs
This quote from Steve Jobs, explains the very essence of this indicator.
Trading is Simple, Why make it complicated. ~ Ravi Chandran
The main motto building this Traders Hedge - Pro indicator is to equip retail traders with a multi purpose tool which in itself will act as a complete trading setup.
This indicator will help you in understanding the market structure and planning your possible entries & exits well in advance.
The indicator & setup is independent of time frames & will work for all trading instruments.
Traders Hedge - Pro Indicator with Alerts you can also set Alerts on your favourite scripts and time frames, to get notification when a Demand or a Supply Zone is created or any Price rejection is formed.
List of all the features is provided below.
1. Trade Type - A quick auto setup for Intraday or Swing trades
2. CPR - Identifies the market structure and helps to plan mean reversions trade setups
3. Weekly Support & Resistance - Automatically identifies and displays the higher time frame support & resistance levels
4. Price Action Triggers - Alert with a trigger symbol shown on the respective candle where a possible price reversal is expected
5. Targets - Plots the possible Major & Minor targets, which helps in planning our possible profit booking & stop loss zones
6. Developing Pivots - Plots the price mean reversion zones for the upcoming trading session
7. Supply & Demand Zones - Plots the demand and supply zones by changing the color of the candle
8. Dynamic Dz & Sz Price Tracking - It dynamically identifies and plots the support & resistance levels
9. Opening Range - Plots the identified opening range on the chart
10. PEMA - Helps in visualizing the trend and also acts as a dynamic support & resistance levels
To set Alerts follow the steps provided below.
1. Go to the symbol chart and select the time frame on which you want to set Alerts.
2. Select Alerts Tab and click on Create Alert, shortcut key Alt+A
3. In Condition Select the option “Price Rejection Alerts“ or “Zone Alerts“ for which you want the alerts to be shown
4. In Options, select Once Per Bar Close
5. Select expiry as per your preference or keep it open-ended
6. Select Alerts Actions as per your preference
7. Alert name is optional
8. Default message is “Price Rejection Alerts“ or “Zone Alert” and can be modified
9. Click on Create and in the warning window select Continue Anyway
How to get the indicator:
To know more about the indicator & to download please check the link in the signature below.
Once you have active alert, you will keep getting notification whenever a Price rejection or new Demand / Supply zone gets created in the identified symbol and time frame you have selected.
Please do feel free to use the indicator and give your valuable feed backs which will help me in optimizing it to a great extent.
I would love to thank each of the traders in this Trading View community in helping me improve on my trading skills.
Happy Trading!

Accumulation & Distribution DetectorThis indicator lets us to automatically detect and mark strong and clear Price Action levels in which there were Accumulation and Distribution phases in any timeframe.
This Accumulation and Distribution is associated with a laterality in the market and they are usually important price levels to take into account for either future Price Action trades in Supports and Resistances or in Supply and Demand levels since they are usually turning points in the market.
This indicator, unlike other existing ones, allows us to adjust through the parameters both the level of demand and the size of these candles regarding the ATR and the size of the candle itself. The tighter we are, the fewer candles marked there will be and, therefore, the desired level to trade will be more powerful and stronger.
Note : The order of elements on the chart must be configured so this indicator should be above the candles, otherwise it will not be displayed correctly.
Este indicador nos permite detectar y marcar de forma automática los niveles fuertes y claros de Price Action donde ha habido fases de Acumulación y Distribución en cualquier marco de tiempo.
Esta Acumulación y Distribución se asocia a una lateralidad en el mercado y suelen ser niveles de precio importantes a tener en cuenta para futuras operaciones de Price Action en Soportes y Resistencias o sobre niveles de Oferta y Demanda ya que suelen los puntos de giro en el mercado.
Este indicador, a diferencia de otros existentes, nos permite ajustar mediante los parámetros el nivel de exigencia y tamaño de estas velas con respecto al ATR y el tamaño de la propia vela. Mientras más estrictos seamos, menos velas marcadas habrá y más potente y fuerte será el nivel deseado para operar.
Nota : Se debe configurar el orden de elementos en el gráfico para que el indicador esté por encima de las velas, de lo contrario no se visualiza correctamente.
Parameters Settings / Parámetros Ajustables:
MAX Body size vs Full Candle (%) : Max body vs Full Candle size percentatge required, default 50% / Porcentaje Máximo Permitido para el tamaño del “Cuerpo” sobre el tamaño completo de la propia vela, por defecto 50%
MAX Candle Size vs ATR (%) : Max candle size vs ATR percentage required, default 70% / Porcentaje Máximo admitido para el tamaño total de la vela con respecto al ATR, por defecto 70%
ATR Length : Candles Number to calculate ATR average, default 30 / Cantidad de velas para medir el ATR, por defecto 30
Use ATR filter? : We can activate or deactivate the ATR calculates, default activated / Podemos anular el cálculo sobre el ATR y hacerlo normal, por defecto activado
Color Settings / Colores Ajustables:
Print Char : Char and Color printed in candle / Símbolo y Color que dibuja sobre la vela detectada

Booming Bull 15 Min StrategyBooming Bull 15 Min strategy
Conditions
First 15 min candle high-low must be less than .75%
Next candle is crossing either high or low

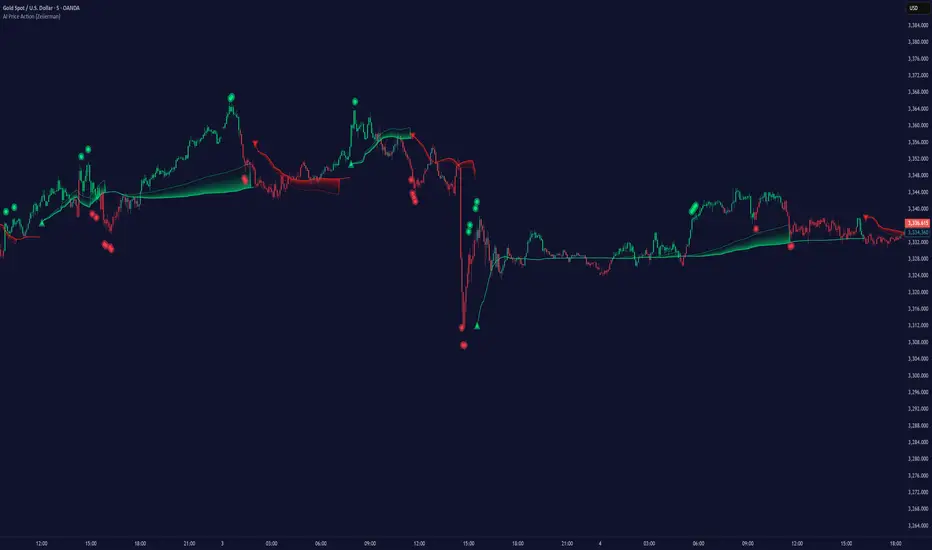
Intelligent Price Action - Movement Up (Expo)Intelligent Price Action - Movement Up (Expo)
DESCRIPTION
Intelligent Price Action - Movement Up (Expo) identifies important up movements that have an impact on current price characteristics. The indicator is visualizing buying pressure! These price patterns are valuable insight when trading the market.
This indicator response faster to price movement and is more focused on detecting buying pressure rather than exhausted buyers.
• Buying pressure is seen in reversal points.
• Buying pressure can be seen when the buyers are exhausted.
• Buying pressure can be seen in positive breakouts.
HOW TO USE
1. Use the indicator to identify buying pressure.
2. Use the indicator to identify reversal points.
3. Use the indicator to identify exhausted buyers.
4. Use the indicator to identify breakouts.
Combine the indicator with ‘ Intelligent Price Action - Movement Down (Expo) ’ or with my other Price Action indicators.
INDICATOR IN ACTION
EURUSD
BTCUSD
BTCUSD
GOLD
WALL STREET
WALL STREET
BTCUSD
EURUSD
The indicator works with RENKO, HEIKIN ASHI and with KAGI charts as well.
I hope you find this indicator useful , and please comment or contact me if you like the script or have any questions/suggestions for future improvements. Thanks!
I will continue to work on this indicator, so please share your experience and feedback with me so that I can continuously improve it. Thanks to everyone that have contacted me regarding my scripts. Your feedback is valuable for future developments!
ACCESS THE INDICATOR
• Contact me on TradingView or use the links below
-----------------
Disclaimer
Copyright by Zeiierman.
The information contained in my scripts/indicators/ideas does not constitute financial advice or a solicitation to buy or sell any securities of any type. I will not accept liability for any loss or damage, including without limitation any loss of profit, which may arise directly or indirectly from use of or reliance on such information.
All investments involve risk, and the past performance of a security, industry, sector, market, financial product, trading strategy, or individual’s trading does not guarantee future results or returns. Investors are fully responsible for any investment decisions they make. Such decisions should be based solely on an evaluation of their financial circumstances, investment objectives, risk tolerance, and liquidity needs.
My scripts/indicators/ideas are only for educational purposes!
Intelligent Price Action - Movement Down (Expo)Intelligent Price Action - Movement Down (Expo)
DESCRIPTION
Intelligent Price Action - Movement Down (Expo) identifies important down movements that have an impact on current price characteristics. The indicator is visualizing selling pressure! These price patterns are valuable insight when trading the market.
This indicator response faster to price movement and is more focused on detecting selling pressure rather than exhausted sellers.
• Selling pressure is seen in reversal points.
• Selling pressure can be seen when the sellers are exhausted.
• Selling pressure can be seen in negative breakouts.
HOW TO USE
1. Use the indicator to identify selling pressure.
2. Use the indicator to identify reversal points.
3. Use the indicator to identify exhausted sellers.
4. Use the indicator to identify breakouts.
Combine the indicator with ‘ Intellilligent Price Action - Movement Up (Expo) ’ or with my other Price Action indicators.
INDICATOR IN ACTION
EURUSD
EURUSD
BTCUSD
BTCUSD
GOLD
WALL STREET
WALL STREET
EURUSD
BTCUSD
BRENT
The indicator works with RENKO, HEIKIN ASHI and with KAGI charts as well.
I hope you find this indicator useful , and please comment or contact me if you like the script or have any questions/suggestions for future improvements. Thanks!
I will continue to work on this indicator, so please share your experience and feedback with me so that I can continuously improve it. Thanks to everyone that have contacted me regarding my scripts. Your feedback is valuable for future developments!
ACCESS THE INDICATOR
• Contact me on TradingView or use the links below
-----------------
Disclaimer
Copyright by Zeiierman.
The information contained in my scripts/indicators/ideas does not constitute financial advice or a solicitation to buy or sell any securities of any type. I will not accept liability for any loss or damage, including without limitation any loss of profit, which may arise directly or indirectly from use of or reliance on such information.
All investments involve risk, and the past performance of a security, industry, sector, market, financial product, trading strategy, or individual’s trading does not guarantee future results or returns. Investors are fully responsible for any investment decisions they make. Such decisions should be based solely on an evaluation of their financial circumstances, investment objectives, risk tolerance, and liquidity needs.
My scripts/indicators/ideas are only for educational purposes!

Intelligent Price Action - Positive Close (Expo)Intelligent Price Action - Positive Close (Expo)
DESCRIPTION
Intelligent Price Action - Positive Close (Expo) identifies important positive closes that have an impact on current price characteristics. The indicator is visualizing buying pressure! These price patterns are valuable insight when trading the market.
• Buying pressure is seen in reversal points.
• Buying pressure can be seen when the buyers are exhausted.
• Buying pressure can be seen in positive breakouts.
HOW TO USE
1. Use the indicator to identify buying pressure.
2. Use the indicator to identify reversal points.
3. Use the indicator to identify exhausted buyers.
4. Use the indicator to identify breakouts.
Combine the indicator with ‘I ntellilligent Price Action - Negative Close (Expo) ’ or with my other Price Action indicators.
INDICATOR IN ACTION
EURUSD
EURUSD
BTCUSD
BRENT
WALL STREET
WALL STREET
WALL STREET
BTCUSD
BTCUSD
EURUSD
EURUSD
The indicator works with RENKO, HEIKIN ASHI and with KAGI charts as well.
I hope you find this indicator useful , and please comment or contact me if you like the script or have any questions/suggestions for future improvements. Thanks!
I will continue to work on this indicator, so please share your experience and feedback with me so that I can continuously improve it. Thanks to everyone that have contacted me regarding my scripts. Your feedback is valuable for future developments!
ACCESS THE INDICATOR
• Contact me on TradingView or use the links below
-----------------
Disclaimer
Copyright by Zeiierman.
The information contained in my scripts/indicators/ideas does not constitute financial advice or a solicitation to buy or sell any securities of any type. I will not accept liability for any loss or damage, including without limitation any loss of profit, which may arise directly or indirectly from use of or reliance on such information.
All investments involve risk, and the past performance of a security, industry, sector, market, financial product, trading strategy, or individual’s trading does not guarantee future results or returns. Investors are fully responsible for any investment decisions they make. Such decisions should be based solely on an evaluation of their financial circumstances, investment objectives, risk tolerance, and liquidity needs.
My scripts/indicators/ideas are only for educational purposes!
