Auto Trend Line (ATL) IndicatorAuto Trend Line (ATL) Indicator
Description:
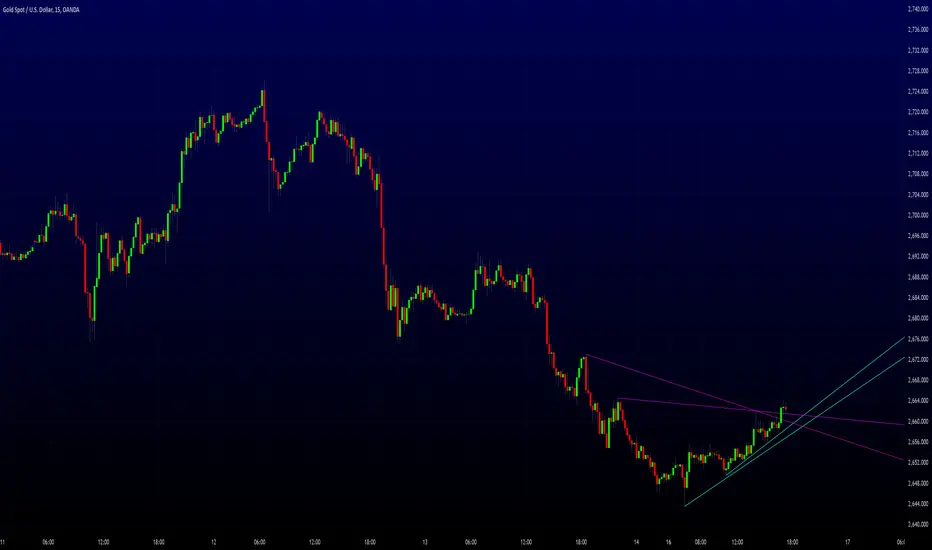
The Auto Trend Line indicator is an useful tool designed to automatically identify and draw key support and resistance levels on your chart. These levels are calculated based on historical price action, providing traders with a visual guide to potential market turning points. The indicator is highly customizable, allowing users to adjust parameters for history bars, factor values, and range values, ensuring adaptability to various trading strategies and timeframes.
Key Features:
• Automatic Support and Resistance Detection: Uses advanced algorithms to identify significant price levels.
• Customizable Line Styles and Colors: Personalize the appearance of support and resistance lines for clarity.
• Dynamic Updates: Adjusts lines in real-time based on price action.
• Extended Visibility: Draws lines that extend into the future, offering potential zones of interest for upcoming price movements.
Inputs:
• History Bars Count: Controls the range of historical data used in calculations.
• Factor and Range Values: Fine-tune the sensitivity of trend line detection.
• Line Styles and Colors: Choose between solid, dotted, or dashed lines for support and resistance, with customizable colors.
Use Case:
This indicator is ideal for traders who rely on support and resistance levels for decision-making in various markets, including stocks, forex, and cryptocurrencies. By automating the detection of these critical levels, the Auto Trend Line indicator saves time and eliminates subjective bias, empowering traders to focus on their strategies.
Explore the Auto Trend Line indicator to enhance your trading insights!
Developed by iSTAGs
Pricetrend
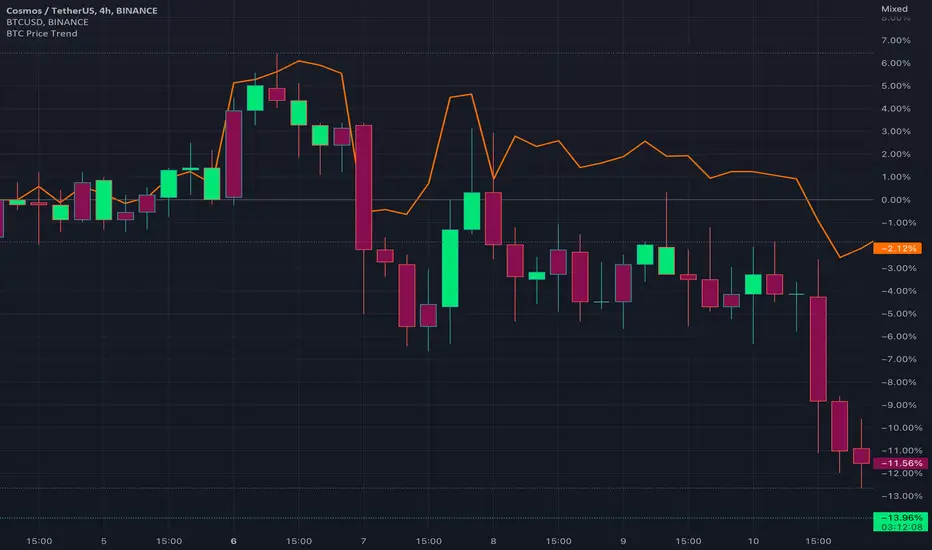
BTC Price TrendThe crypto market is reacting very quickly based on BTC price, thus monitoring the BTC price is very helpful.
This script will color the candles based on the BTC price trend. Set the timeframe and down/up percentage to monitor the BTC price trend, and the script should not repaint.
The indicator will monitor the BTC price in a high frame, for example, for 4 hours, if the price goes down the set percentage during one candle, will change the candle color. Thereafter, if the price goes up within a small timeframe (as you set) then the candle color will be changed.
So, in case the bar color is red, then it is recommended to avoid trading since the BTC price is down trending.
The indicator is requesting the BTC price as of now, and the previous closed price, then it will calculate the price difference, if it result is minus, then the price is in a downtrend, else it is in an uptrend.
VolWaves‴ | Volume Waves‴What does it do?
This indicator allows you to identify possible top and bottom reversals by having a prior volume reversal identifiable by positive (top reversal) and negative (bottom reversal) waves.
How does it work?
Everytime the wave starts ending its movement by shrinking the size of the histogram bars, it might be signing that a price reversal is on its way. It is possible to adjust the wave shape by increasing/decreasing its gradient value analysis, but it's so easy to use that sometimes no reconfiguration is needed, just add it and let it guide you.
What's my filling?
I've been testing this indicator for weeks and so far with incredible reversal signals.


Stiffness IndicatorThis indicator was originally developed by Markos Katsanos (Stocks & Commodities, V.36:12 (November, 2018): "The Stiffness Indicator").
Like and follow for more open source indicators!
Happy Trading!
