Alson Chew PAM EXE and Mother BarIndicators for strategies taught by Alson Chew's Price Action Manipulation (PAM) course
Two functions.
First it identifies EXE bars (Pin, Mark, Icecream bars).
Second it identifies Mother bars and draws an extension line for 6 bars.
Applicable to all time frames and can customise how many signals to show.
To be used in conjunction with trading strategies like
- 20 SMA, 50 SMA, 200 SMA FS formation
- Force Bottom, Force Top FS formation
- UR1 and DR1 using EXE Bar
Profits

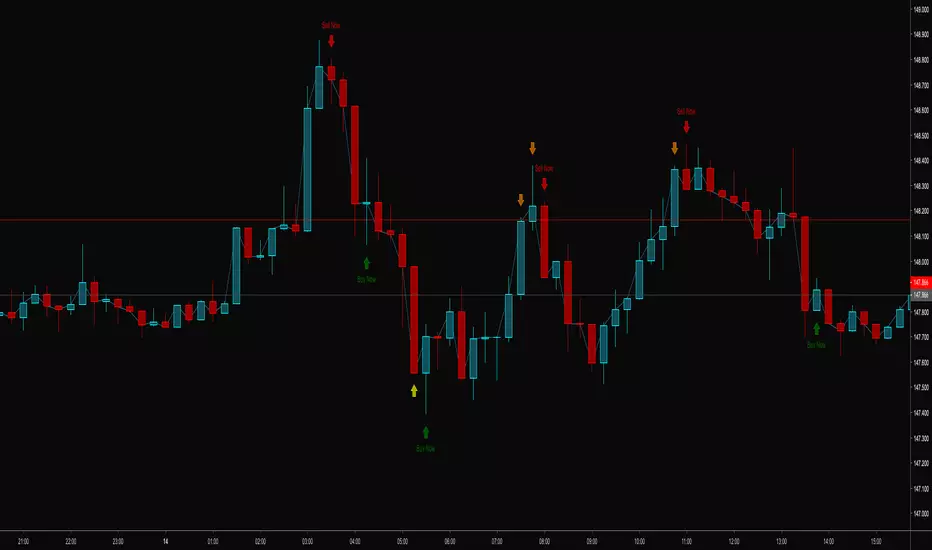
Profit booking Indicatorell signal when RSI < 40, MACD crosses zero or signal line downward in negative zone, close below 50 EMA, candle bearish.
Strong sell signal confirmed on 5-minute higher timeframe with same conditions.
Square off half/full signals as defined.
Target lines drawn bold based on previous swing lows and extended as described.
Blue candle color when RSI below 30.
One sell and one full square off per cycle, blocking repeated sells until full square off.

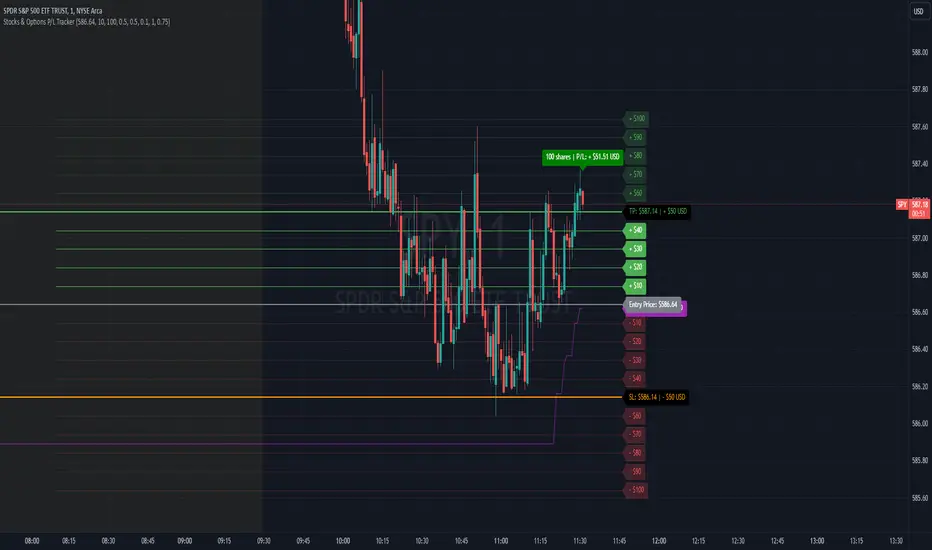
Stocks & Options P/L TrackerOverview:
The Stocks & Options P/L Tracker is a custom TradingView indicator developed to offer traders precise tracking of stocks & options trades’ profit and loss in real-time. It features a detailed display of P/L intervals, stop-loss and take-profit levels, and an adaptable trailing stop mechanism to help traders manage risk and optimize their trading strategies. This tool is particularly useful for active traders who seek immediate visual feedback on their trades’ performance.
Key Features:
Real-Time P/L Display: Computes and displays the P/L per contract/share and total P/L dynamically on the chart based on the specified entry price, relative to the current market price, and number of contracts or shares.
Configurable Take Profit and Stop Loss: Users can set take-profit and stop-loss amounts, and the indicator will visually mark these levels with corresponding dollar amounts for easy reference.
Trailing Stop Functionality: Offers an option to enable a trailing stop that automatically adjusts based on price movements.
Interval-Based P/L Tracking: Uses customizable intervals to display projected P/L levels above and below the entry price, helping users understand potential profit or loss scenarios at a glance.
Dynamic Labeling and Alerts: Visual labels are used to mark P/L, take-profit, stop-loss, trailing stop, and entry levels. These labels update dynamically on each new price bar to provide immediate insights into trade performance. NOTE: Due to TradingView's limitations with server-side alerts on fixed prices, dynamic alerts (for Take Profit, Stop Loss, and Trailing Stop) that adjust with price changes are not yet available. Alerts must be manually reset to your desired price each time.
Clean and Responsive Design: Utilizes color-coded labels and lines for P/L intervals, making it easy to distinguish profit, loss, stop, and take-profit zones. Colors adjust automatically to the current price to maintain clarity.
User Input Validation: Ensures appropriate input values for items like entry price, contract/share size, and profit/loss intervals to prevent errors and optimize performance.
Efficient Object Management: Implements object reusability for lines and labels to stay within Pine Script's object limits, ensuring smooth operation and maximum accuracy in real-time tracking.
Automatic Adjustments Based on Market Changes: Calculates and adjusts trailing stop levels dynamically based on highest price movement, which provides traders flexibility while maintaining risk controls.
Trader Benefits:
This indicator empowers traders with a robust tool to manage their trades visually and strategically on TradingView. The real-time feedback and customization options help traders make informed decisions, minimize risks, and maximize potential profits.
Happy Trading! :)
Profit Percentage TrackerThis script provides a quick and easy way to visualize profits in a chart, based on the given entry date and price.
Optionally, alerts can be sent when profits cross up the given " profit unit ".
In short:
Tracks how much profit one could take based on the input " entry date " and the input " entry price "
These inputs are interactive (www.tradingview.com)
Displays the result in a label on top of the last candle
(Optional) Sends alerts based on the given " profit unit ", that is: if ' 0.5 ' is given, then an alert is triggered every time the profit is raised by that number
(Be careful with low values, as TradingView could stop an alert if it triggers too much.)
For alerts to be displayed, a " script alert " must be created right after the script was added to the chart:
- www.tradingview.com
(Choose ' Profits ' as condition and ' Any alert() function call ')
Good to know: if you check " Notify on app ", alerts can be delivered directly to your phone:
i.imgur.com
Prerequirements :
The chart's timezone has to be set to " Exchange " (this is required in order to support the alert's logic):
- kodify.net

TSI CCI Hull with profit$$$This is a modified version of @SeaSide420 TSI CCI Hull with profits exit on long and short order
ORIGINAL SCRIPT:
/// /// feel free to edit/improve and comment

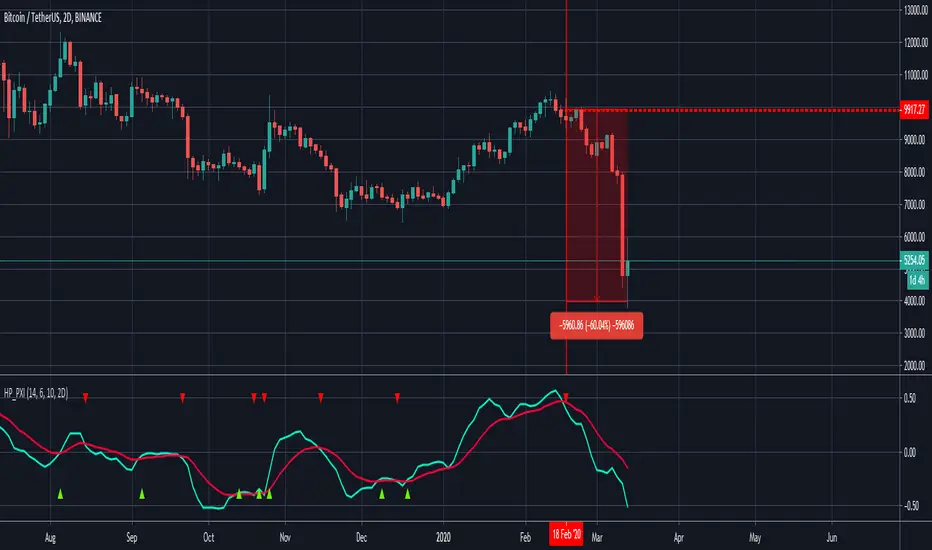
Plutus eXploration Index - PXIGreetings Fellow Traders!
We have developed this simple and easy to use indicator so that all users can benefit from it by:
• Reducing the amount of time spent trading.
• Minimizing the risk of loss.
• Accurate timing on entries and exits.
• Signals are accurate in volatile market conditions.
What is the PXI?
The Plutus eXploration Index falls under the centred momentum oscillator category which means that it fluctuates above and below a central point or line. Apex levels exist, where the indicator will reach a peak, and start moving in the opposite direction. Two lines move in unison and crossovers will signal a buy and a sell.
Setting up the indicator:
Once you have received your invite, the indicator will appear under your "my invite only" scripts in trading view detailed charts screen. Select PXI and add it to your chart. For free accounts on TradingView, the indicator limit is set to x3, so please de-activate something if you hit this limit.
You can access the PXI setting in the string of icons that follow after the indicators name in the top left corner of the indicator chart. In order:
Name | Visibility | Settings | Show source code | Delete | More
Under the settings, there are two tabs. One for the style, which you may freely change to suit your preferences. And then the first tab, for Inputs. The default settings for Long Minima, Short Maxima and Integrated EMA should not be changed.
The critical change to make in the input settings is the time frame !
The time frame on the price chart and the time frame on the indicator have to match! The range of allowable time frames is as follows:
15min | 30min | 1h | 4h | 12h | 1d | 2d | 1week
How to use the PXI:
The apex levels on the oscillator differ for each asset and vary depending on the selected time frame. The signals provided near apex points shall hold more weight. We recommend that traders assess these levels properly before considering a position.
Sell signal: Sell signals occur when the quick line (default blue) crosses over the slow line (default orange) from above.
A red arrow down will mark this point in time out on the chart.
Buy signal: Buy signals occur when the quick line (default blue) crosses the slow line (default orange) from bellow.
A green arrow down will mark this point in time out on the chart.
Maximizing Risk/Reward and profitability:
The indicator strives to keep positions open long enough to reap real rewards in the market. Maximum profit levels naturally occur around the apex points on the indicator chart, and the onus is on the trader to attempt an early exit once these levels are achieved.
Addition points to consider:
Most profitable trading signals occur on the daily time frames while considering the duration of trades and timing of the signals. For the lowest risk levels, weekly time frames are most suitable. From the weekly time frame down, the risk increases incrementally until you reach the 15min time frame. Signals at the lower levels occur more often and they are effective but, they should, however, be monitored closely. Also, the lower the time frame, the higher the chances of false-positive signals.
will not be liable for damages of any kind resulting from your use of or inability to use the indicator or content.
BEST Trailing Take Profit StrategyHello traders
Hope you enjoyed your weekend on my behalf. Was staying home working ... ^^
This is my first strategy educational post I'm doing ever
While I'm generally against posting strategies because it's very easy to fake performance numbers... I cannot prevent myself from sharing a few cool strategy snippets anyway.
So from now on, I'll be sharing a few strategies also - generally not to showcase performance but only to show what pinescript can do.
As once again strategy performance can be faked is so many ways... :)
What's on the menu?
We all know what a trailing-stop is. right? right? Ok... sharing the definition here :)
A trailing stop is designed to protect gains by enabling a trade to remain open and continue to profit as long as the price is moving in the investor's favor. The order closes the trade if the price changes direction by a specified percentage or dollar amount.
But...do you know what a trailing profit is?
Short definition : Well the same but with your profit limit order.
Long definition : A trailing profit is designed to increase your gains by enabling a trade to remain open and continue to profit as long as the price is moving in the investor's favor. The order closes the trade if the price hits the trailing profit level specified percentage or dollar amount.
Some trading strategies used both a trailing stop AND trailing profit. Not making any recommendation here - only sharing what's possible in the realm of trading and pinescripting
Trigger me I'm famous
I developed many trading strategies in my career and often I've been asked to trigger a trailing-stop or trailing-profit once a certain % move has been made.
I integrated here a Take Profit trigger - once hit, it will activate the trailing profit
On the screenshot below, the TP trigger is plotted in orange. Once the price goes past that level for the first time, I'll start trailing the profit level.
In other words, when we see a price makes an interesting move in percentage value - we decide to offset the profit as we concluded that once it reached such distance - then it leads often to more profit
Of course, using only a trailing profit without stop/trailing-stop/invalidation isn't smart and the surest way to kiss goodbye a trading capital and trading and your good mood
See you tomorrow for another strategy snippet
All the BEST
Dave

Swing trade - Libertus - STRATEGYHello all.
Month of hard work, testing and fine tunning went into making of this strategy.
I wanted to be able to leave trading to bot and spend more time away from charts and this strategy finally enabled me to do just that!
It's a swing trade strategy which will always keep you in trade (if used on exchange which allows you to short).
If you use 4H time frame you'll get about 2-3 trades a week.
As you should be able to see bellow, strategy has very good profitability of 60+% in last 6 months with small drag-down and nice profits.
It's optimized for ETH on 4H time, but settings can be adapted for different assets and time frames.
Best settings for ETH 4H time frame are default 0/0 with both Filter 1 and Filter 2 enabled.
Settings can be changed in positive +1, +2, +3 etc., and negative -1, -2, -3...
Strategy profitability is based on buying and selling 10 ETH (not more, not less) in every trade. You can see +20 or -20 on every trade which means 10 ETH for closing current position and 10 ETH for opening new position. If you are trading more or less then this, you can easily calculate your profitability via this.
Indicator which could be used manually or via bot is in production, will be finished soon!
Good luck trading!

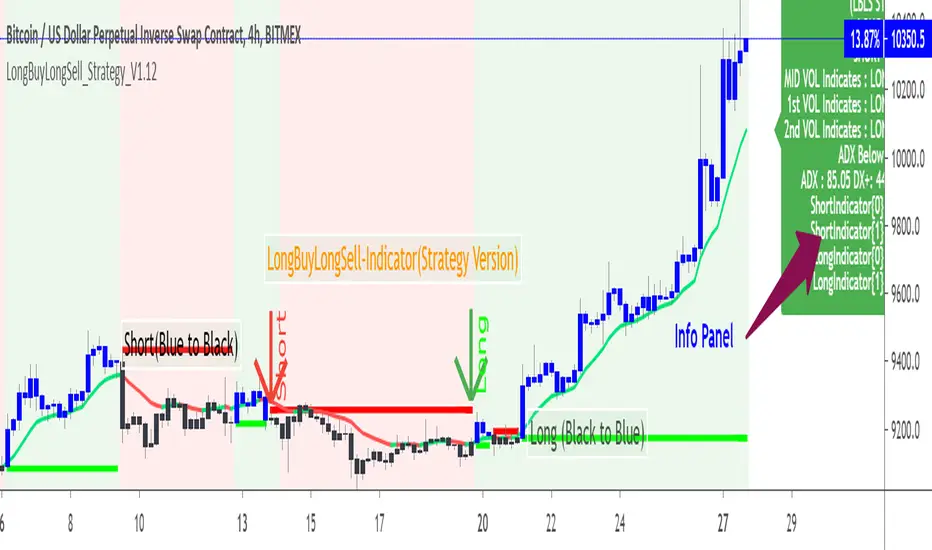
LongBuyLongSell 90% profit Excellent Win Rate Strategy indicatorI seldom prefer the strategy version ,As you have requested to share the backtest results sharing the details here for your info only. to check how the "LongBuyLongsell" indicator is working.
BTCUSD 30min time frame used ,Tested with Forex ,Equity results are >80% when right entry is predicted.
This is, published to show only the test results of the original "LongBuyLongSell" indicator that was published in tradingview initially on 27Jun.
The test scripts are only available to do testing by me and it is keycode protected,Here sharing the results of BTCUSD of 30min time frame with the improved logic in "longbuylongsell" indicator version.
This script cannot be used for generating Alerts realtime as tradingview does not support user "Alerts" in strategy scripts . So please get access for "longbuylongsell" indicator.
Information are shared to show the accuracy of this LongBuyLongsell Indicator.
No indicator will work 100% in all time ;Win rate will be 80% ; Just sharing this as a result here and as a performance report of LongBuyLongsell Indicator script available in Tradingview.
Again,This is shared only for info ,not to be used. If you wish to use the indicator check and get the access for the working "longbuylongsell" indicator version 1 and Version 2 and not to this.
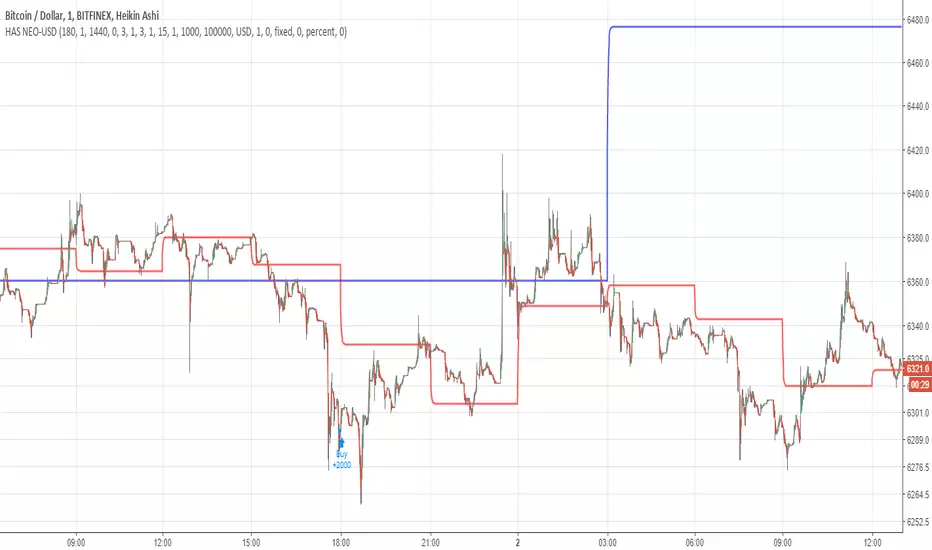
Has Indıcator Has indicator uses heiken ashi and macd (macd is custom)
works almost any cryptocurrency
1- 1min chart recommended
2- Use only USD pairs
3-Each trade is 10,000 USD
4-Comission is 0.13
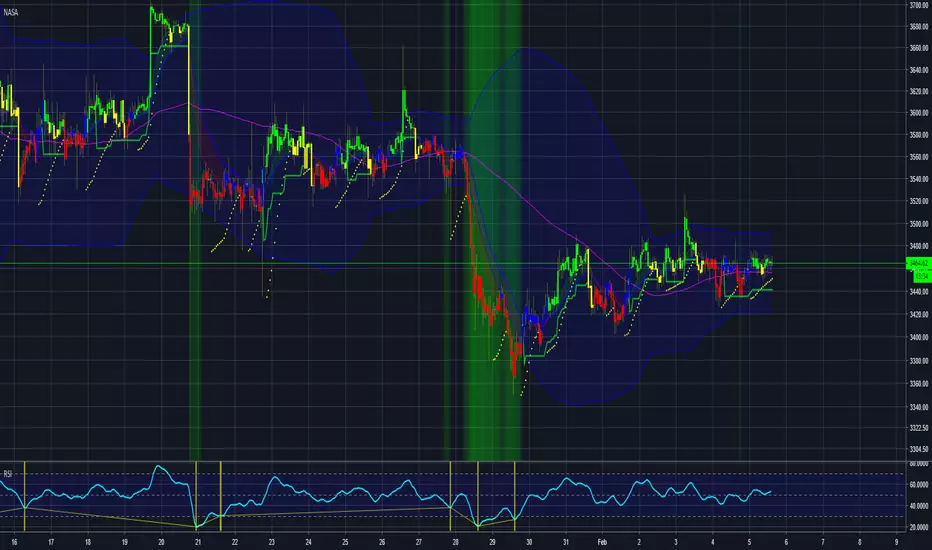
Draculapresley's Daytrading Scalping STRAT O' DoomUsing some custom settings with a few indicators and a custom movement algorithm I have backtested this script and used it with great results. Excellent for getting in and out for quick scalping trades. The results are typically 1% + and sometimes even a great deal more. The indicator gives you buy and sell points and works great with 15 min candles though you can modify the inputs to work with any time frame. Use all 3 indicators for safest bets but most of the time just using the Stoch input with the movement algorithm almost always yields positive results with tons of buys. Works pretty well even in a downturn but absolutely kills in a bull market.
Check out the screenshots below.
imgur.com

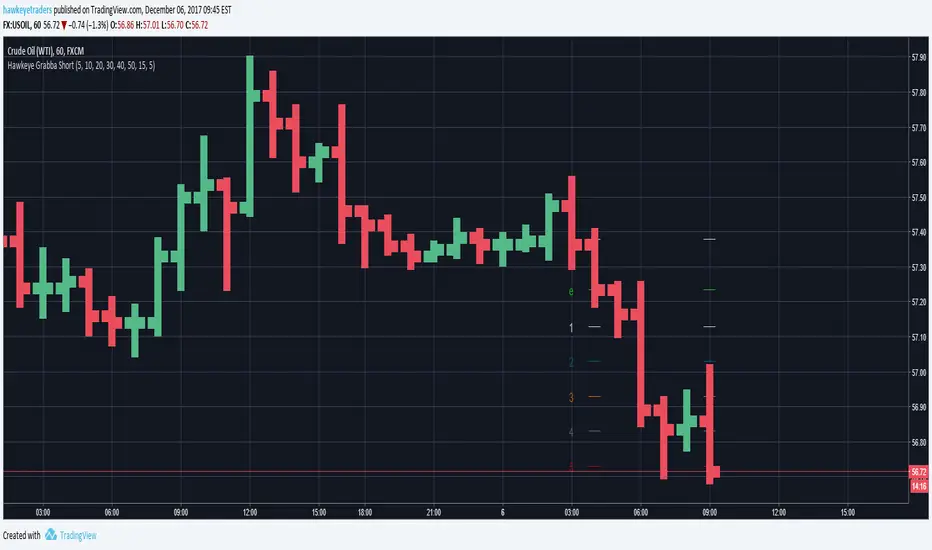
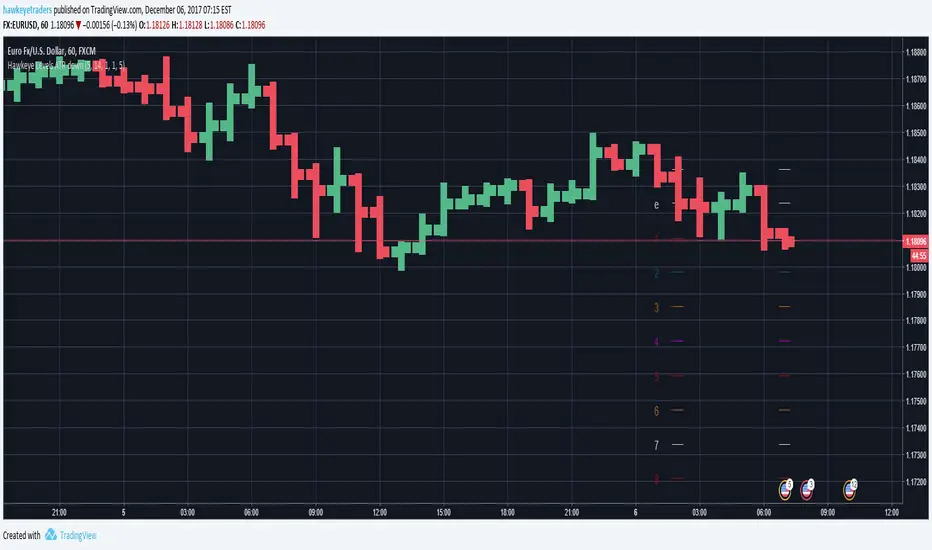
Hawkeye Grabba ShortGrab pips with Hawkeye Grabba
Grabba is a simple mechanical system that you can manage yourself, using your own risk and reward profile.
The Hawkeye Grabba is a risk management tool which provides traders with a visual representation of the risk-to-reward profile on every trade.
For example, you can apply your own profit targets (say 10 pips) and each line will show you that multiple.
As with all the Hawkeye Indicators, Grabba can be applied to any timeframe and any chart and can be custom set to be used on any market, i.e. Forex, stock indices, commodities, etc.
Hawkeye Grabba LongGrab pips with Hawkeye Grabba
Grabba is a simple mechanical system that you can manage yourself, using your own risk and reward profile.
The Hawkeye Grabba is a risk management tool which provides traders with a visual representation of the risk-to-reward profile on every trade.
For example, you can apply your own profit targets (say 10 pips) and each line will show you that multiple.
As with all the Hawkeye Indicators, Grabba can be applied to any timeframe and any chart and can be custom set to be used on any market, i.e. Forex, stock indices, commodities, etc.

Hawkeye Levels ATR downExit at the right time with Levels ATR!
Levels ATR is a powerful series of user pre-defined levels, which act as both potential exit positions and stop loss management.
The Levels ATR indicator helps traders identify clear exit strategies.
Inexperienced traders can:
spend too long focusing on where to enter the position
spend no time on where to exit or take profits
allow the market to dictate the exit following a particular chart pattern or set up
be panicked into exiting
Few traders concentrate on their exit strategies, yet this is where the big profits are made!
Hawkeye Levels ATR upExit at the right time with Levels ATR!
Levels ATR is a powerful series of user pre-defined levels, which act as both potential exit positions and stop loss management.
The Levels ATR indicator helps traders identify clear exit strategies.
Inexperienced traders can:
spend too long focusing on where to enter the position
spend no time on where to exit or take profits
allow the market to dictate the exit following a particular chart pattern or set up
be panicked into exiting
Few traders concentrate on their exit strategies, yet this is where the big profits are made!

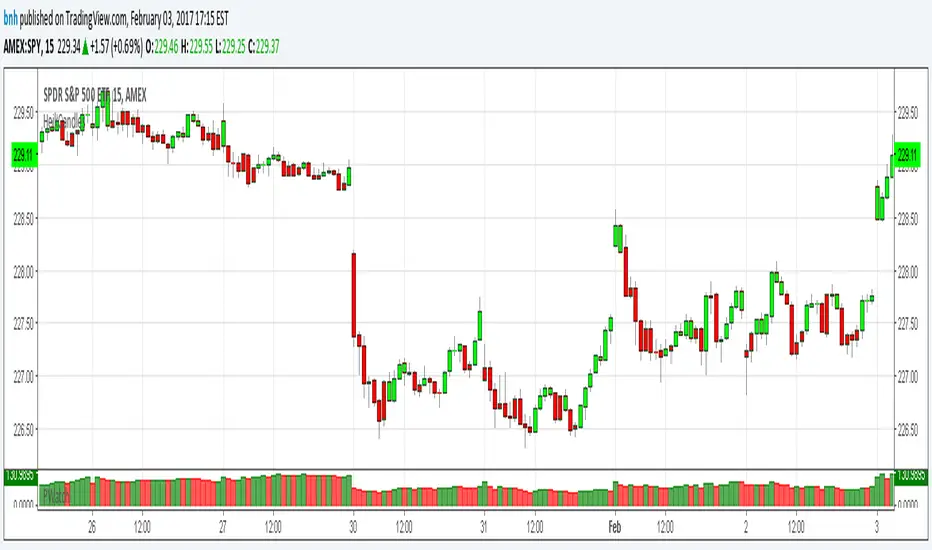
Hershey's Portfolio WatchThanks to user rwestbury for the idea!
Watch the profit in dollars of your portfolio in REAL TIME, love it!
Put this in a window that doesn't change often, for it takes long to initially load.
I use it in my window where I monitor the US index SPY.
Edit and add as many symbols as you want below, you should be able to figure it out.
Just add symbol, number of shares and price.
I'll improve on this later, like trim the code down with function calls, etc.
Good trading!
Brian Hershey
Chinkou_ProWelcome traders,
I have made this script wishing a higher gain,
Originally, this strategy is taken from Ichimoku Kinko Hyo
Simply:
ChinkouPro crossing with price is giving a clear opportunity.
Review it, master it, work it.
first version
change log
Delete function of lazy trader { smooth candle }
Delete function of alert , { make alert from chart it's better }
Enjoy with it , and contact me for any reason :)
