Apex-Wallet - Risk & Reward Calc (Futures/Prop-Firm)Overview The Apex Risk & Reward Calc is a specialized utility tool designed for Futures traders, particularly those working with Prop Firms (Apex, MyFundedFutures, etc.). It eliminates the need for manual calculations by providing an instant, clear visualization of your Risk/Reward parameters directly on the chart.
How it works Trading Futures (ES, NQ, MES, MNQ) requires knowing exactly how many ticks correspond to your financial target. This script automatically detects the active instrument and calculates the precise number of ticks needed for both your Take Profit (TP) and Stop Loss (SL) based on your desired cash outcome and chosen ratio.
Key Features:
Automatic Ticker Recognition: Supports ES, NQ, MES, and MNQ with built-in tick values.
Cash-Based Planning: Enter your desired profit in dollars (e.g., $50), and the script tells you the required tick move.
Dynamic Ratio Selection: Choose from 9 different R:R ratios (from 1/5 to 5/1) to instantly see the impact on your Stop Loss.
Compact Professional UI: A clean, 3-column dashboard at the bottom-right of your screen showing active lots, ticks, and gross cash values.
Trading Application Perfect for intraday scalpers who need to set their ATM strategies in platforms like Tradovate or NinjaTrader. It ensures your execution remains consistent with your risk management plan.
Propfirm

Vib ORB Range (Free)Vib ORB Range (Free) plots the Opening Range High and Low for the session based on a user-defined start time and duration.
This tool is designed for traders who want a clean, no-noise display of the ORB zone without extra indicators or automation.
Features:
Customizable Opening Range start time
Customizable Opening Range duration
Automatically resets daily
Plots ORB High, ORB Low, and optional ORB Midline
Shaded range zone for improved clarity
Works on all timeframes and markets
How to Use:
Set the ORB start time (default 9:30 New York)
Set the ORB duration (default 15 minutes)
The indicator will draw the ORB zone once the range completes
Use the outlines or shaded zone to visually identify potential breakout areas
This free tool is intended as a simple, reliable ORB visualizer without alerts, filters, or strategy logic.

Pannello Multi-Account con Spread e Dimensione Regolabile📘 Indicator Description: Multi-Account Execution Panel with Spread-Adjusted Risk
This indicator is designed for traders who manage multiple accounts with different capital sizes and execution models—such as a personal account and a prop firm account. It provides a visual panel that calculates and displays the ideal position size for each account, factoring in stop loss, spread, and risk preferences.
🔧 Key Features:
- Manual risk input in USD for the personal account (e.g., $2, $5, $10)
- Percentage-based risk for the prop firm account (e.g., 1% of €5,000)
- Spread-adjusted stop loss for each account, ensuring accurate risk calculation
- Real-time pip value calculation based on the current symbol
- Position size output:
- In units for the personal account
- In standard lots for the prop firm account
- Adjustable table size (Compact, Standard, Extended) to fit your screen and workflow
🧠 Ideal for:
- Traders who execute sequentially across multiple accounts
- Those who want precise, spread-aware sizing without manual calculations
- Discretionary strategies that require visual clarity and execution discipline
Italian

Panel Multi-Cuenta con Spread y Tamaño Ajustable📘 Indicator Description: Multi-Account Execution Panel with Spread-Adjusted Risk
This indicator is designed for traders who manage multiple accounts with different capital sizes and execution models—such as a personal account and a prop firm account. It provides a visual panel that calculates and displays the ideal position size for each account, factoring in stop loss, spread, and risk preferences.
🔧 Key Features:
- Manual risk input in USD for the personal account (e.g., $2, $5, $10)
- Percentage-based risk for the prop firm account (e.g., 1% of €5,000)
- Spread-adjusted stop loss for each account, ensuring accurate risk calculation
- Real-time pip value calculation based on the current symbol
- Position size output:
- In units for the personal account
- In standard lots for the prop firm account
- Adjustable table size (Compact, Standard, Extended) to fit your screen and workflow
🧠 Ideal for:
- Traders who execute sequentially across multiple accounts
- Those who want precise, spread-aware sizing without manual calculations
- Discretionary strategies that require visual clarity and execution discipline
Spanish

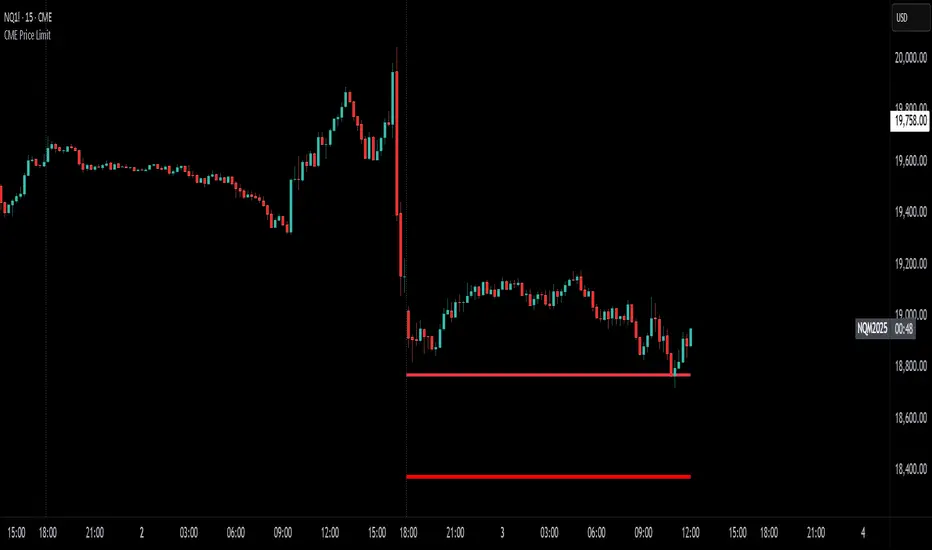
CME Price LimitCalculates the CME Price Limit
The reference price is obtained from the previous day's closing settlement price
(data pulled from the asset's daily chart with settlement enabled)
Percentage limit can be modified in settings
Buffer can be enabled (for example, 2% buffer on a 7% limit, so a line gets drawn at 5% too)
Alert can be enabled for price crossing a certain percentage from reference on the day
You can choose to plot the historical lines on every day, or the current day only
The reference price output can be found in the data window, or in the indicator status line if enabled in the settings.
Before placing real trades with this, you should compare the indicator's reference price to what's shown on CME's website, to double check that TradingView's data matches for your contract.
www.cmegroup.com
[COW] Day Percent LevelsThis indicator plots on your chart 2 levels, the daily percentage changes required to know by most prop firms and other exchanges. 5% is often a cutoff point for prop firm day traders and can get you banned if you trade past these levels. This indicator allows you to adjust the percentage as well as the lines and labels to your liking.
This is key when using prop firms as it is a level you must be aware of when trading. This can help you avoid being banned, your account being closed, or other disciplinary action based on trading past these levels.
Enjoy!

FTMO Rules MonitorFTMO Rules Monitor: Stay on Track with Your FTMO Challenge Goals
TLDR; You can test with this template whether your strategy for one asset would pass the FTMO challenges step 1 then step 2, then with real money conditions.
Passing a prop firm challenge is ... challenging.
I believe a toolkit allowing to test in minutes whether a strategy would have passed a prop firm challenge in the past could be very powerful.
The FTMO Rules Monitor is designed to help you stay within FTMO’s strict risk management guidelines directly on your chart. Whether you’re aiming for the $10,000 or the $200,000 account challenge, this tool provides real-time tracking of your performance against FTMO’s rules to ensure you don’t accidentally breach any limits.
NOTES
The connected indicator for this post doesn't matter.
It's just a dummy double supertrends (see below)
The strategy results for this script post does not matter as I'm posting a FTMO rules template on which you can connect any indicator/strategy.
//@version=5
indicator("Supertrends", overlay=true)
// Supertrend 1 Parameters
var string ST1 = "Supertrend 1 Settings"
st1_atrPeriod = input.int(10, "ATR Period", minval=1, maxval=50, group=ST1)
st1_factor = input.float(2, "Factor", minval=0.5, maxval=10, step=0.5, group=ST1)
// Supertrend 2 Parameters
var string ST2 = "Supertrend 2 Settings"
st2_atrPeriod = input.int(14, "ATR Period", minval=1, maxval=50, group=ST2)
st2_factor = input.float(3, "Factor", minval=0.5, maxval=10, step=0.5, group=ST2)
// Calculate Supertrends
= ta.supertrend(st1_factor, st1_atrPeriod)
= ta.supertrend(st2_factor, st2_atrPeriod)
// Entry conditions
longCondition = direction1 == -1 and direction2 == -1 and direction1 == 1
shortCondition = direction1 == 1 and direction2 == 1 and direction1 == -1
// Optional: Plot Supertrends
plot(supertrend1, "Supertrend 1", color = direction1 == -1 ? color.green : color.red, linewidth=3)
plot(supertrend2, "Supertrend 2", color = direction2 == -1 ? color.lime : color.maroon, linewidth=3)
plotshape(series=longCondition, location=location.belowbar, color=color.green, style=shape.triangleup, title="Long")
plotshape(series=shortCondition, location=location.abovebar, color=color.red, style=shape.triangledown, title="Short")
signal = longCondition ? 1 : shortCondition ? -1 : na
plot(signal, "Signal", display = display.data_window)
To connect your indicator to this FTMO rules monitor template, please update it as follow
Create a signal variable to store 1 for the long/buy signal or -1 for the short/sell signal
Plot it in the display.data_window panel so that it doesn't clutter your chart
signal = longCondition ? 1 : shortCondition ? -1 : na
plot(signal, "Signal", display = display.data_window)
In the FTMO Rules Monitor template, I'm capturing this external signal with this input.source variable
entry_connector = input.source(close, "Entry Connector", group="Entry Connector")
longCondition = entry_connector == 1
shortCondition = entry_connector == -1
🔶 USAGE
This indicator displays essential FTMO Challenge rules and tracks your progress toward meeting each one. Here’s what’s monitored:
Max Daily Loss
• 10k Account: $500
• 25k Account: $1,250
• 50k Account: $2,500
• 100k Account: $5,000
• 200k Account: $10,000
Max Total Loss
• 10k Account: $1,000
• 25k Account: $2,500
• 50k Account: $5,000
• 100k Account: $10,000
• 200k Account: $20,000
Profit Target
• 10k Account: $1,000
• 25k Account: $2,500
• 50k Account: $5,000
• 100k Account: $10,000
• 200k Account: $20,000
Minimum Trading Days: 4 consecutive days for all account sizes
🔹 Key Features
1. Real-Time Compliance Check
The FTMO Rules Monitor keeps track of your daily and total losses, profit targets, and trading days. Each metric updates in real-time, giving you peace of mind that you’re within FTMO’s rules.
2. Color-Coded Visual Feedback
Each rule’s status is shown clearly with a ✓ for compliance or ✗ if the limit is breached. When a rule is broken, the indicator highlights it in red, so there’s no confusion.
3. Completion Notification
Once all FTMO requirements are met, the indicator closes all open positions and displays a celebratory message on your chart, letting you know you’ve successfully completed the challenge.
4. Easy-to-Read Table
A table on your chart provides an overview of each rule, your target, current performance, and whether you’re meeting each goal. The table adjusts its color scheme based on your chart settings for optimal visibility.
5. Dynamic Position Sizing
Integrated ATR-based position sizing helps you manage risk and avoid large drawdowns, ensuring each trade aligns with FTMO’s risk management principles.
Daveatt
