HMM Trend Exhaust Detector (Partial TP Areas)🔹 HMM Trend Exhaust Detector (Partial TP Areas)
HMM Trend Exhaust Detector is a professional risk-management and partial profit awareness tool, designed to highlight moments when price becomes over-extended within a strong trend.
This indicator is not an entry system and not a reversal predictor.
It is built to help traders protect profits, manage open positions, and avoid chasing price when the market is already stretched.
🧠 How it works (Simple Explanation)
When price moves aggressively away from its trend structure:
The candle color changes in real time, warning that price is entering a potential exhaustion zone.
A dotted guide level appears at the exact threshold price, showing where profit pressure begins.
After the candle closes, Partial TP Areas are marked on the chart to provide structure and context.
This two-step approach ensures:
Live awareness during the candle
Confirmed visual zones after close
🎯 What this indicator is best used for
✔ Partial profit booking
✔ Risk reduction during strong trends
✔ Avoiding late entries into extended moves
✔ Trade management & discipline
⚙️ Sensitivity Modes
The indicator includes a single Sensitivity setting to adapt to different trading styles:
Relaxed → Earlier warnings, more frequent partial TP zones
Strict → Balanced, institutional default
Very Strict → Only major, extreme exhaustion moves
(All internal calculations are handled automatically.)
📌 Important Notes
This indicator does not generate buy or sell signals.
Rectangle height is just based on candle heights at that time (Not strength based)
Partial TP Areas are confirmed after candle close by design.
Live candle highlighting and guide levels provide real-time awareness, not prediction.
Best used alongside your existing strategy or entries.
🧩 Recommended Use
Scalping / Fast markets → Relaxed
Intraday trading → Strict
Swing / News / Higher timeframes → Very Strict
🚀 About HMM
House of Market Minds -(HMM) indicators focus on clarity, discipline, and decision support — not hype or unrealistic promises.
This is the first public release in the HMM series, built with a long-term professional vision.
Propfirm

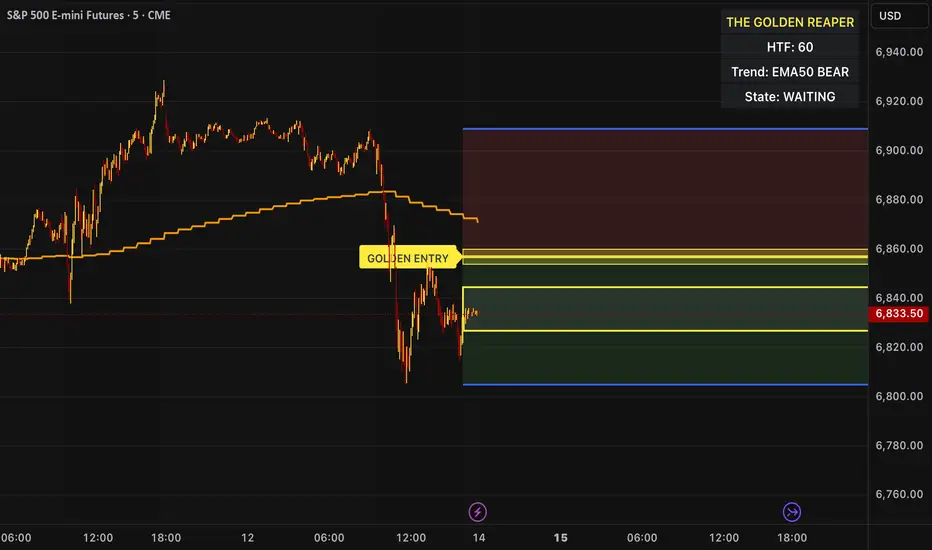
The Golden Reaper 🟡 THE GOLDEN REAPER
HTF OTE + EMA50 — Futures Scalping Framework
The Golden Reaper is a high-timeframe execution framework designed specifically for futures scalpers who trade with precision, patience, and structure.
This indicator focuses on HTF market structure, Optimal Trade Entry (OTE) zones, and equilibrium (50%) reclaim confirmation to identify high-probability execution areas for fast, controlled scalps.
It is not a signal spam tool.
It is a framework built for disciplined traders who wait for price to come to them.
⸻
🔑 Designed For
✔ Futures markets (ES, NQ, MNQ, MES, GC, MGC, CL, etc.)
✔ Scalpers & intraday traders
✔ 1H structure → 5m / 1m execution
✔ Traders who prefer few high-quality setups
⸻
🧠 Core Logic (How It Works)
1️⃣ High-Timeframe Structure (HTF)
The indicator identifies the most recent HTF swing high and low to define the active trading leg.
2️⃣ OTE Zone (Premium / Discount)
Price is expected to react within the OTE zone where liquidity is commonly targeted.
3️⃣ Golden Entry (EQ 50%)
The 50% equilibrium level is marked as the Golden Entry.
Price must reclaim this level for a setup to become valid.
4️⃣ Golden Execution Zone
After reclaim, a golden execution zone appears to define where entries are allowed.
5️⃣ EMA 50 Trend Filter
Trades are taken only in the direction of the HTF EMA 50 to avoid counter-trend scalps.
⸻
⚡ How Futures Scalpers Use It
Recommended Timeframes
• HTF Structure: 1 Hour
• Execution: 5 Minute / 1 Minute
Process
• Wait for price to reach the OTE zone
• Allow the setup to arm
• Enter only after price reclaims the Golden Entry
• Execute within the Golden Execution Zone
• Manage stops and targets manually
This approach helps scalpers:
✔ Avoid chasing price
✔ Reduce over-trading
✔ Improve entry precision
✔ Maintain consistency
⸻
🔔 Alerts Included
• OTE Touched – Setup is armed
• C-Reclaim Confirmed – Entry condition met
(Alerts are designed to assist — not replace — trader judgment.)
⸻
⚠️ Important Notes
• Designed for futures markets only
• Best used with price action confirmation
• No built-in stop loss or take profit (manual risk management required)
• Not financial advice
⸻
🧬 Who This Indicator Is For
✔ Futures scalpers
✔ ICT / Smart Money traders
✔ Structure-based traders
✔ Traders who value patience over frequency
❌ Not for:
• Signal chasers
• Indicator stacking
• Automated trading
• Beginners who want instant entries
⸻
🟡 Created By
ChartReaper / Tactiko
Instagram:
@officialchartreaper
@tactiko
Vib ORB Range (Free)Vib ORB Range (Free) plots the Opening Range High and Low for the session based on a user-defined start time and duration.
This tool is designed for traders who want a clean, no-noise display of the ORB zone without extra indicators or automation.
Features:
Customizable Opening Range start time
Customizable Opening Range duration
Automatically resets daily
Plots ORB High, ORB Low, and optional ORB Midline
Shaded range zone for improved clarity
Works on all timeframes and markets
How to Use:
Set the ORB start time (default 9:30 New York)
Set the ORB duration (default 15 minutes)
The indicator will draw the ORB zone once the range completes
Use the outlines or shaded zone to visually identify potential breakout areas
This free tool is intended as a simple, reliable ORB visualizer without alerts, filters, or strategy logic.

Pannello Multi-Account con Spread e Dimensione Regolabile📘 Indicator Description: Multi-Account Execution Panel with Spread-Adjusted Risk
This indicator is designed for traders who manage multiple accounts with different capital sizes and execution models—such as a personal account and a prop firm account. It provides a visual panel that calculates and displays the ideal position size for each account, factoring in stop loss, spread, and risk preferences.
🔧 Key Features:
- Manual risk input in USD for the personal account (e.g., $2, $5, $10)
- Percentage-based risk for the prop firm account (e.g., 1% of €5,000)
- Spread-adjusted stop loss for each account, ensuring accurate risk calculation
- Real-time pip value calculation based on the current symbol
- Position size output:
- In units for the personal account
- In standard lots for the prop firm account
- Adjustable table size (Compact, Standard, Extended) to fit your screen and workflow
🧠 Ideal for:
- Traders who execute sequentially across multiple accounts
- Those who want precise, spread-aware sizing without manual calculations
- Discretionary strategies that require visual clarity and execution discipline
Italian

Panel Multi-Cuenta con Spread y Tamaño Ajustable📘 Indicator Description: Multi-Account Execution Panel with Spread-Adjusted Risk
This indicator is designed for traders who manage multiple accounts with different capital sizes and execution models—such as a personal account and a prop firm account. It provides a visual panel that calculates and displays the ideal position size for each account, factoring in stop loss, spread, and risk preferences.
🔧 Key Features:
- Manual risk input in USD for the personal account (e.g., $2, $5, $10)
- Percentage-based risk for the prop firm account (e.g., 1% of €5,000)
- Spread-adjusted stop loss for each account, ensuring accurate risk calculation
- Real-time pip value calculation based on the current symbol
- Position size output:
- In units for the personal account
- In standard lots for the prop firm account
- Adjustable table size (Compact, Standard, Extended) to fit your screen and workflow
🧠 Ideal for:
- Traders who execute sequentially across multiple accounts
- Those who want precise, spread-aware sizing without manual calculations
- Discretionary strategies that require visual clarity and execution discipline
Spanish

MNQ Hybrid Scalper Pro - Advanced NASDAQ Futures Scalping System🎯 Overview
The MNQ Hybrid Scalper Pro is a comprehensive scalping system engineered specifically for NASDAQ futures traders. This indicator implements a modern hybrid approach that combines institutional-grade VWAP analysis with momentum oscillators optimized for the unique volatility characteristics of the NASDAQ market. Developed through extensive research on MNQ/NQ price action patterns, this indicator provides clear, actionable signals while filtering out market noise during high-volatility periods.
✨ Key Features
1. VWAP Foundation
Session-anchored VWAP with automatic reset
Dynamic standard deviation bands (1σ and 2σ)
Color-coded price bars based on VWAP positioning
VWAP test detection with momentum confirmation
2. Optimized Momentum Suite
Fast RSI (7): Aggressive settings (85/15) for quick scalping signals
Scalping MACD (5,13,6): Optimized parameters with SMA option
Quick Stochastic (9,3,3): Tuned for 1-minute chart responsiveness
Divergence Detection: Automated bullish/bearish divergence alerts
3. Multi-Timeframe Trend Filter
Triple EMA system (9, 21, 50) on current and higher timeframes
Trend strength scoring (-3 to +3) for directional bias
Prevents counter-trend trades in strong trending markets
Visual trend alignment indicators
4. Smart Signal Generation
Long Signals: VWAP pullback + RSI oversold + MACD bullish turn + HTF trend alignment
Short Signals: VWAP rally + RSI overbought + MACD bearish turn + HTF trend alignment
Signal cooldown period to prevent overtrading
Session-based filtering for optimal trading windows
5. Risk Management Visualization
Automatic profit target levels (10 & 20 points)
Dynamic stop loss levels (6 & 8 points)
Risk/reward ratio calculation (minimum 1.5:1)
Breakeven level display after 5 points profit
Visual entry, target, and stop lines on chart
6. Session Intelligence
NY opening range highlight (first 30 minutes)
Optimal scalping window shading (9:30-11:30 AM EST)
Major session markers (Asia, Europe, NY)
Session countdown timer
Contract rollover reminders
7. Real-Time Performance Dashboard
Current trend status across timeframes
Signal statistics and win rate tracking
Position relative to VWAP
Momentum indicator status (OB/OS/Neutral)
Volume analysis (relative to 20-period average)
Volatility monitoring with ATR spike detection
8. Professional Alert System
High-probability entry alerts with specific levels
VWAP test notifications with momentum confirmation
Target and stop loss hit alerts
Trend alignment notifications
Comprehensive alert messages with entry, stop, and target prices
📈 How to Use
Optimal Setup:
Timeframe: Best on 1-minute charts (also works on 3-min and 5-min)
Instrument: Optimized for MNQ (Micro E-mini NASDAQ), works with NQ
Session: Most effective during NY session (9:30-11:30 AM EST)
Chart Type: Standard candlestick or bars
Signal Interpretation:
Green Triangle (▲): Long entry signal - all conditions aligned for upward scalp
Red Triangle (▼): Short entry signal - all conditions aligned for downward scalp
DIV Labels: Momentum divergence detected - potential reversal zones
Colored Bars: Green = above VWAP (bullish bias), Red = below VWAP (bearish bias)
Entry Checklist:
Wait for signal arrow to appear
Confirm trend alignment in dashboard (HTF Trend)
Check momentum status isn't extreme
Verify you're within optimal trading window
Enter at market with predetermined stop and target
⚙️ Customization Options
Display Settings:
Toggle individual components on/off
4 color schemes (Professional, Dark, Light, Classic)
Adjustable transparency and visual elements
Dashboard position selection
Signal Settings:
Adjust momentum indicator parameters
Modify risk/reward levels
Configure session filters
Set signal cooldown periods
Advanced Features:
Multi-timeframe period adjustment
Volatility filter sensitivity
Contract type selection (MNQ/NQ)
Alert configuration options
📊 Best Practices
Start in Simulation: Test the indicator in paper trading first
Respect the Trend: Don't fight the higher timeframe trend
Manage Risk: Use the suggested stop losses consistently
Time Your Trades: Focus on the optimal scalping window
Confirm Signals: Best results when multiple confirmations align
⚠️ Important Notes
Supplementary Tool: This indicator supplements but doesn't replace proper market analysis and order flow reading
No Repainting: All signals are confirmed on bar close
Education Required: Understanding of scalping principles recommended
Risk Management: Always use proper position sizing and risk management
Market Conditions: Performance varies with market volatility and conditions
🎓 Educational Value
This indicator serves as an excellent educational tool for:
Learning VWAP-based trading strategies
Understanding momentum indicator optimization
Practicing multi-timeframe analysis
Developing systematic scalping approaches
Risk management visualization
💻 Technical Specifications
Pine Script Version: v6
Calculation Method: Non-repainting, real-time
Performance: Optimized for minimal lag
Compatibility: All TradingView plan levels
Updates: Regularly maintained and improved
🏆 What Makes This Unique
Unlike generic indicators, the MNQ Hybrid Scalper Pro is specifically engineered for NASDAQ futures volatility patterns. It combines institutional trading concepts (VWAP) with retail-friendly visualization and clear signals, bridging the gap between professional and accessible trading tools.
📬 Support & Feedback
Questions, suggestions, or feedback? Leave a comment below or send a private message. Your input helps improve the indicator for the entire community.
CME_MINI:MNQ1!
Disclaimer: This indicator is for educational and informational purposes only. It does not constitute financial advice. Trading futures involves substantial risk of loss and is not suitable for all investors. Past performance is not indicative of future results. Always conduct your own analysis and consult with a qualified financial advisor.

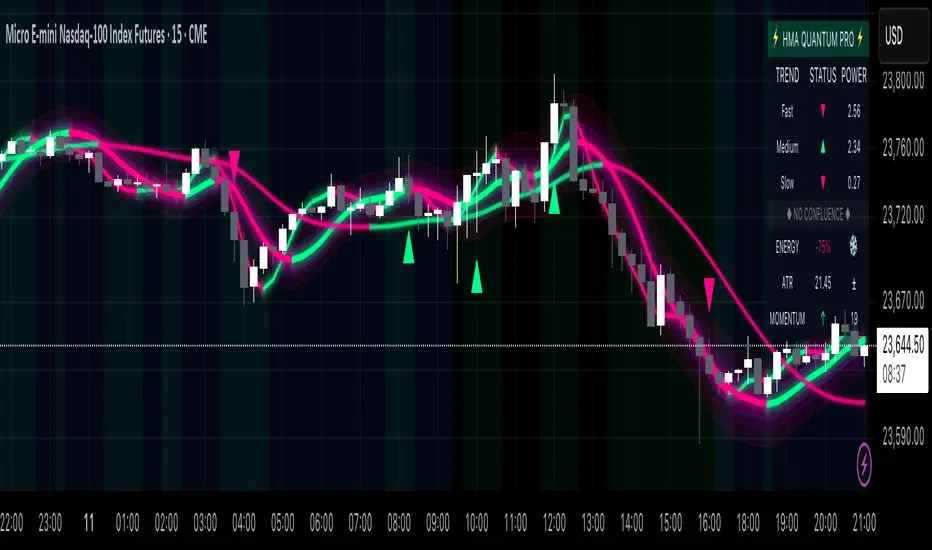
Hull Moving Average Quantum Pro - Advanced Trading SystemThe Hull Moving Average Quantum Pro is a next-generation technical analysis tool that combines the legendary smoothness of Alan Hull's HMA formula with advanced quantum field visualization technology. This professional-grade indicator features three synchronized Hull Moving Average periods working in harmony to identify high-probability trading opportunities.
🎯 KEY FEATURES:
• Multi-Timeframe HMA Confluence - Triple HMA system (9, 21, 55 periods) for comprehensive trend analysis
• Quantum Field Visualization - Fibonacci-based dynamic support/resistance bands with 0.618, 1.0, and 1.618 ratios
• Energy Flow Momentum - Real-time visual representation of market momentum and directional bias
• Confluence Zone Detection - Automatically highlights areas where multiple HMAs converge for high-probability setups
• Professional Holographic Dashboard - Real-time trend strength, momentum, and market status display
• Three Visual Themes - Dark Intergalactic (Quantum Trading), Light Minimal (Clean Charts), Pro Modern (Low Saturation)
⚡ WHAT MAKES IT UNIQUE:
Unlike traditional moving average indicators, the HMA Quantum Pro eliminates lag while maintaining smoothness, providing traders with faster signals without sacrificing reliability. The quantum field visualization adds a new dimension to price action analysis by creating dynamic zones that adapt to market volatility.
📊 PERFECT FOR:
• Day Trading & Scalping - Fast HMA (9) provides quick entry/exit signals
• Swing Trading - Medium HMA (21) confirms trend continuation
• Position Trading - Slow HMA (55) identifies major trend changes
• All Markets - Forex, Stocks, Crypto, Futures, Indices
🔧 ADVANCED SETTINGS:
• Customizable HMA periods for any trading style
• Adjustable confluence threshold for precision filtering
• Visual intensity control for optimal chart clarity
• Field transparency settings for multi-indicator setups
💡 HOW TO USE:
1. Strong Bullish Signal - All three HMAs aligned upward with price above quantum fields
2. Strong Bearish Signal - All three HMAs aligned downward with price below quantum fields
3. Confluence Zones - High probability reversal/continuation areas
4. Energy Flow - Confirms momentum direction and strength
⭐ FREE VERSION FEATURES:
This free version includes all visual features and calculations. Premium version (coming soon) will add advanced alerts, multi-timeframe analysis, and AI-powered trade suggestions.
Created by professional traders for serious market participants. The Hull Moving Average formula was created by Alan Hull to reduce lag while maintaining smoothness - this indicator enhances that foundation with modern visualization technology.
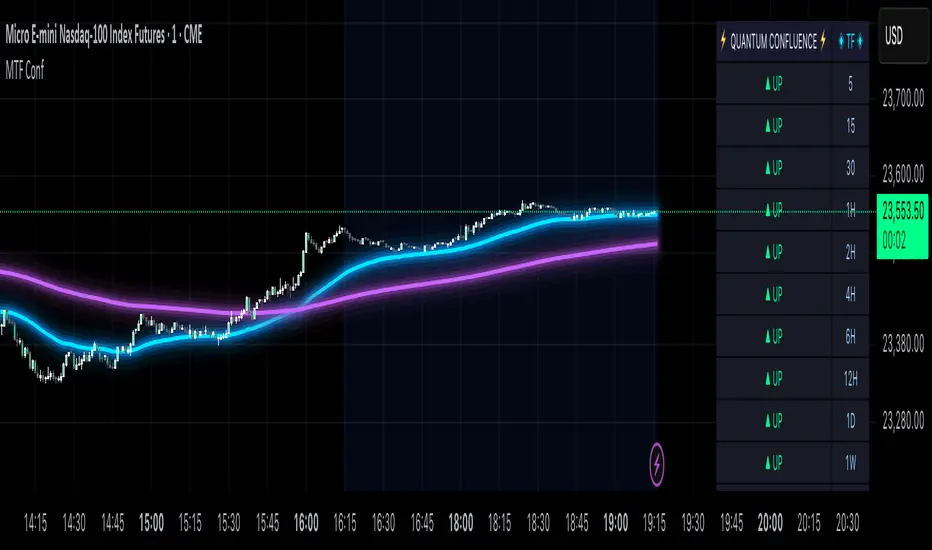
MTF Confluence Dashboard (Multi‑Timeframe Trend/Bias)MTF Confluence Dashboard — Multi‑Timeframe Trend/Bias Table + EMA
The MTF Confluence Dashboard is a fast, non‑repainting multi‑timeframe (MTF) confluence tool that shows higher‑timeframe trend and bias alignment in a compact, on‑chart table. It’s built for prop‑firm challenges and futures day traders who need instant top‑down confirmation without switching charts. Get a clean read of trend direction across your selected timeframes, plus on‑chart MAs for timing.
Why traders use it
* MTF Confluence at a glance: Trend/Bias table aggregates short vs long MA on 1m→1W (you pick which TFs show).
* Non‑repainting: Uses closed-bar higher‑TF data; reliable for alerts and evaluations.
* Futures + prop‑firm friendly: Minimal lag, lightweight, session‑agnostic; perfect for ES/NQ/CL/GC scalping or intraday swings.
Core features
* Trend/Bias Table: “Up / Down” per timeframe and an overall AVG sentiment.
* MA Engine: Choose MA type (SMA/EMA/WMA/HMA) and lengths (e.g., 50/200) to define bias.
* On‑Chart Confirmation: Plots short/long MAs for entry timing on your trading TF.
* Smart Alerts: Built‑in alerts for Strong Up/Up/Neutral/Down/Strong Down average bias.
* Custom Layout: Vertical or Horizontal table, resizable text (Tiny → Huge), corner positioning.
* Pro Visual Themes:
* Dark Intergalactic (neon/futuristic for dark charts)
* Light Minimal (clean light mode)
* Pro Modern (low‑saturation, desk‑ready)
How to trade it
* Scalps (1m–5m): Only take longs when 5m/15m/1H/D are “Up” and AVG is Up/Strong Up; use MA crosses/pulls for entries.
* Intraday swings (5m–15m–1H): Wait for a higher‑TF flip to align; trail under the long MA.
* Risk discipline: If AVG shifts to Neutral/Down, stop looking for longs until bias realigns.
Settings you’ll care about
* Timeframes to display (1m, 2m, 3m, 5m, 10m, 15m, 30m, 1H, 2H, 4H, 6H, 12H, 1D, 1W).
* MA Type: SMA / EMA / WMA / HMA.
* Short/Long lengths (defaults 50/200).
* Theme, orientation, and size.
Notes
* Works on all symbols and timeframes.
* No repainting; alerts trigger on closed conditions.
* Built by PineProfits.
Prop Firm Guard: Risk & Sizing Tracker by TFTProp Firm Guard: Risk & Sizing Tracker by TFT
Overview:
This script is designed to help prop firm traders stay within risk rules and avoid emotional overtrading. It tracks your max loss limits, daily loss rules, and gives real-time position sizing suggestions based on your account status.
This tool is especially helpful for newer traders navigating prop firm challenges and rules like trailing drawdowns and daily stopouts.
Key Features:
✅ Real-time tracking of max loss and daily loss limits
✅ Supports both Intraday and End-of-Day (EOD) drawdown styles
✅ Calculates remaining “distance” to max/daily loss levels
✅ Automatically locks max loss once it trails up to starting balance
✅ Provides smart, tier-based position sizing suggestions (5%–50%)
✅ Shows profit target progress and live daily P&L
Use Case Example:
Let’s say you’re trading a $50,000 prop account with a $2,000 max drawdown limit.
If you're using Intraday Drawdown:
• You start the day at $50,000.
• During the day, your balance grows to $51,000 (including unrealized profits).
• The drawdown logic will trail this intraday high — so your new max loss limit becomes $49,000 (51K - 2K).
• If your balance drops to $49,400, this tool will show you’re $400 away from breaching the limit.
• Sizing suggestions will adjust accordingly to keep you in a safe range.
If you're using End-of-Day (EOD) Drawdown:
• The same scenario (account grows to $51,000 intraday) won’t affect your max loss limit immediately.
• EOD drawdown is only updated based on your end-of-day closing balance.
• So even if you hit $51K intraday, your max loss limit still remains at $48,000 (50K - 2K) until the trading day closes and updates your best equity.
• This mode offers more flexibility during the day — and the tool reflects this in how it calculates distances and sizing.
📌 It will then suggest a conservative sizing range — maybe 5–10% of your allowed contract size — until you're safer again.
📌 Make sure you update your current balance after each trade and follow your risk settings.
Inputs Explained (with Tips):
• Overall Account Starting Balance: Your full prop account size (e.g., 50000 or 100000, 150000, 300000, so on)
• Day Start Balance: What your balance was when the trading day started
• Daily Max Loss: How much you’re allowed to lose in one day (used only for EOD drawdown)
• Daily Profit Target: Your goal for the day (e.g., 500 or 1000 or so on)
• Allowed Overall Drawdown: Usually 4% for prop firms — like 2000 on 50K, or 6000 on 300K
• Drawdown Mode:
→ Intraday: Includes floating/unrealized profits in drawdown logic
→ EOD: Uses only end-of-day equity for drawdown logic
• Best Day High: Your highest balance to date. If not above your starting balance, this is ignored
• Intraday High (Manual): Optional override if your peak balance isn’t same as equity (used only for intraday drawdown mode)
• Current Equity: Update this during the session to reflect your live balance — everything else updates automatically
What You’ll See on the Chart:
🟩 Equity Section: Start balance, current balance, intraday high, best day high
🟥 Risk Section:
• Max loss limit (based on trailing logic)
• Distance from current balance to that limit
• Daily loss limit and distance (EOD mode only)
🟦 Performance Metrics:
• Daily P&L in $ and %
• Progress to profit target (shows ✅ Accomplished when goal is hit)
📦 Sizing Suggestion:
Based on how close you are to a drawdown breach, and your total drawdown tier.
Ranges from ⚠️ 5–10% to ✅ 40–50% of your max allowed contract size.
Who It's Best For:
• Built and optimized for 50K prop firm accounts
• Works well with 100K, 150K, or even 300K — but the sizing logic is most precise at 50K
• Best suited for futures or forex prop firm traders using account challenge-style rules
Manual Input Required:
Due to TradingView limitations, we cannot read your actual trades or live balance.
You'll need to update the Current Equity field yourself — but the rest is auto-calculated from there.
Most inputs (like overall balance and drawdown) are set once and rarely changed.
Beta Notice:
This tool is currently in beta and under testing. It's free for now and designed to help the trading community — but accuracy may vary.
Please send feedback if you'd like to suggest improvements or report bugs.
Disclaimer:
This tool is for educational purposes only and does not provide trading advice or signal any trades.
Always trade according to your firm’s rules. The author is not responsible for losses resulting from use of this script.

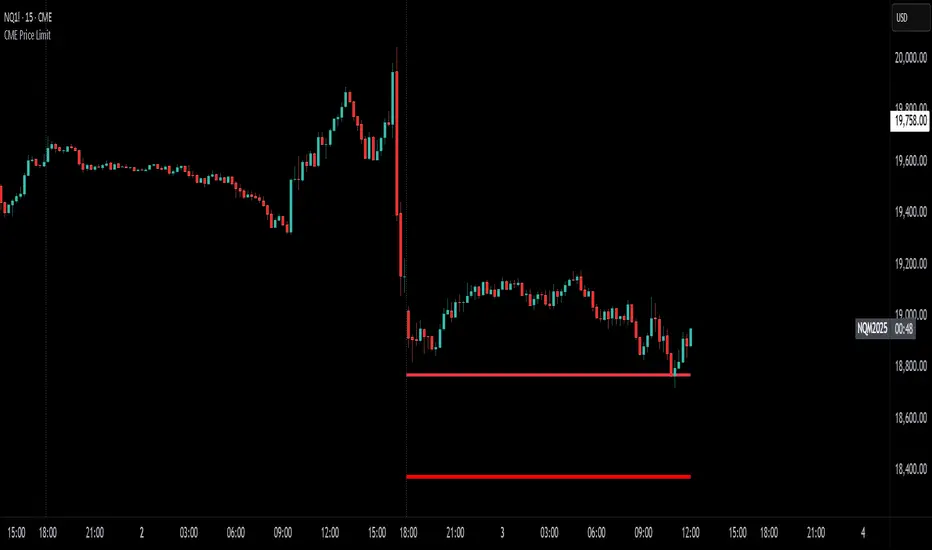
CME Price LimitCalculates the CME Price Limit
The reference price is obtained from the previous day's closing settlement price
(data pulled from the asset's daily chart with settlement enabled)
Percentage limit can be modified in settings
Buffer can be enabled (for example, 2% buffer on a 7% limit, so a line gets drawn at 5% too)
Alert can be enabled for price crossing a certain percentage from reference on the day
You can choose to plot the historical lines on every day, or the current day only
The reference price output can be found in the data window, or in the indicator status line if enabled in the settings.
Before placing real trades with this, you should compare the indicator's reference price to what's shown on CME's website, to double check that TradingView's data matches for your contract.
www.cmegroup.com
[COW] Day Percent LevelsThis indicator plots on your chart 2 levels, the daily percentage changes required to know by most prop firms and other exchanges. 5% is often a cutoff point for prop firm day traders and can get you banned if you trade past these levels. This indicator allows you to adjust the percentage as well as the lines and labels to your liking.
This is key when using prop firms as it is a level you must be aware of when trading. This can help you avoid being banned, your account being closed, or other disciplinary action based on trading past these levels.
Enjoy!

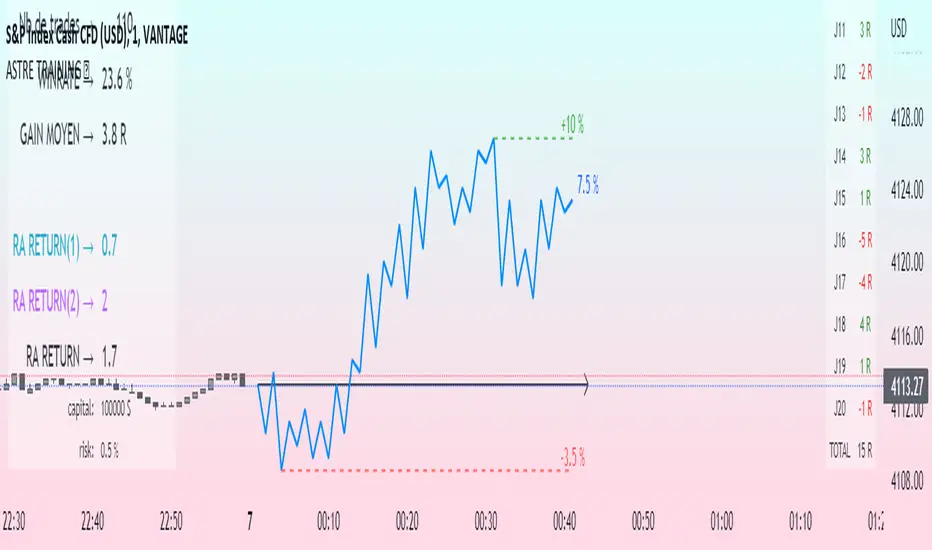
Challenge training (journal)Dynamic trading journal with equity curve display. Detailed results with prop firm objectives, editable, $/month estimation, possibility to compare two strategies.
one line in parameter = one trading day. 20 days max.
For each trading day, specify : The number of trades, the number of SL, the number of total winning RR.
A table at the bottom right summarizes the days and performances during the backtest in order to have an idea of the current performance.
The bottom left table summarizes the overall performance with some key information.
Depending on the number of days traded, a monthly "salary" is deducted, taking into account the prop firm commission.
there is the possibility to define a "Type" for each trading day, 1 or 2. It allows to compare in a binary way, example for type 1: when the high time frame structure is doing well and I am confident for scalping, otherwise type 2.
Again: type 1: SL shorter by 50%, type 2: normal SL etc..
the button "separate 1 and 2" allows to display two additional equity curves : type 1 and type 2. It allows to have a quick visual comparison on the impact of our parameter studied in our backtest on our performance. at the scale of the main equity curve
All the conditions to succeed in the challenge are adjustable in the parameters. The drawdown calculation has been simplified - in order not to have to put 80 trades in the parameters window, I have gathered them by "day", and pessimistically, we consider first the stoplosses and then the take profits, simplifying the performances of the day into "one losing trade" and "one winning trade" (graphically). It is a good compromise between quantity and quality.
Use "A random day trading" indicator to spice up your training.
I hope this will be useful for you to track your performance !