Puell Multiple Variants [OperationHeadLessChicken]Overview
This script contains three different, but related indicators to visualise Bitcoin miner revenue.
The classical Puell Multiple : historically, it has been good at signaling Bitcoin cycle tops and bottoms, but due to the diminishing rewards miners get after each halving, it is not clear how you determine overvalued and undervalued territories on it. Here is how the other two modified versions come into play:
Halving-Corrected Puell Multiple : The idea is to multiply the miner revenue after each halving with a correction factor, so overvalued levels are made comparable by a horizontal line across cycles. After experimentation, this correction factor turned out to be around 1.63. This brings cycle tops close to each other, but we lose the ability to see undervalued territories as a horizontal region. The third variant aims to fix this:
Miner Revenue Relative Strength Index (Miner Revenue RSI) : It uses RSI to map miner revenue into the 0-100 range, making it easy to visualise over/undervalued territories. With correct parameter settings, it eliminates the diminishing nature of the original Puell Multiple, and shows both over- and undervalued revenues correctly.
Example usage
The goal is to determine cycle tops and bottoms. I recommend using it on high timeframes, like monthly or weekly . Lower than that, you will see a lot of noise, but it could still be used. Here I use monthly as the example.
The classical Puell Multiple is included for reference. It is calculated as Miner Revenue divided by the 365-day Moving Average of the Miner Revenue . As you can see in the picture below, it has been good at signaling tops at 1,3,5,7.
The problems:
- I have to switch the Puell Multiple to a logarithmic scale
- Still, I cannot use a horizontal oversold territory
- 5 didn't touch the trendline, despite being a cycle top
- 9 touched the trendline despite not being a cycle top
Halving-Corrected Puell Multiple (yellow): Multiplies the Puell Multiple by 1.63 (a number determined via experimentation) after each halving. In the picture below, you can see how the Classical (white) and Corrected (yellow) Puell Multiples compare:
Advantages:
- Now you can set a constant overvalued level (12.49 in my case)
- 1,3,7 are signaled correctly as cycle tops
- 9 is correctly not signaled as a cycle top
Caveats:
- Now you don't have bottom signals anymore
- 5 is still not signaled as cycle top
Let's see if we can further improve this:
Miner Revenue RSI (blue):
On the monthly, you can see that an RSI period of 6, an overvalued threshold of 90, and an undervalued threshold of 35 have given historically pretty good signals.
Advantages:
- Uses two simple and clear horizontal levels for undervalued and overvalued levels
- Signaling 1,3,5,7 correctly as cycle tops
- Correctly does not signal 9 as a cycle top
- Signaling 4,6,8 correctly as cycle bottoms
Caveats:
- Misses two as a cycle bottom, although it was a long time ago when the Bitcoin market was much less mature
- In the past, gave some early overvalued signals
Usage
Using the example above, you can apply these indicators to any timeframe you like and tweak their parameters to obtain signals for overvalued/undervalued BTC prices
You can show or hide any of the three indicators individually
Set overvalued/undervalued thresholds for each => the background will highlight in green (undervalued) or red (overvalued)
Set special parameters for the given indicators: correction factor for the Corrected Puell and RSI period for Revenue RSI
Show or hide halving events on the indicator panel
All parameters and colours are adjustable
Puellmultiple

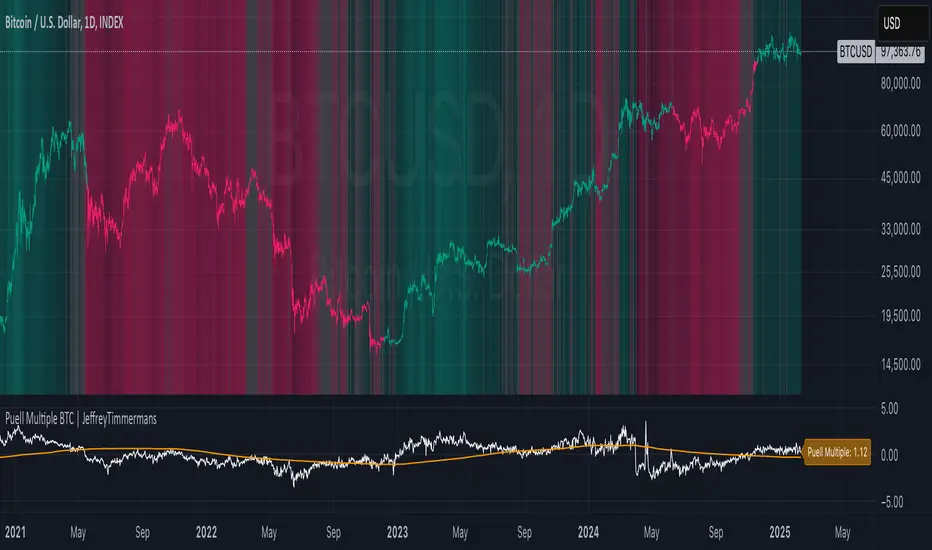
Puell Multiple BTC | JeffreyTimmermansThe Puell Multiple is a metric that assesses the relationship between mining profitability and market cycles. It is calculated by comparing the daily value of newly issued coins (USD) to the 365-day moving average of daily coin issuance (USD).
This indicator works best on the 1D BTC Chart. When interpreting the Puell Multiple, it can generally be understood as follows:
High values indicate that miner profitability is significantly higher than the yearly average. This may lead to an increased incentive for miners to sell off their holdings, putting additional selling pressure on the market.
Low values suggest that miner profitability is lower than the yearly average. In this case, miners might experience financial strain, causing some to reduce their hash power by shutting down mining rigs. This, in turn, can reduce the number of coins being sold into the market, as remaining miners need to liquidate fewer coins to maintain operations, thereby decreasing the impact on the liquid supply.
The Puell Multiple is a metric used primarily in the cryptocurrency space, specifically for Bitcoin, to assess whether Bitcoin is overvalued or undervalued in relation to its mining rewards. It helps to gauge the profitability of miners and, by extension, to assess market conditions.
Use:
This Puell Multiple is invented for Long-Term, Trend Following Systems.
The Puell Multiple trend can be visualized through the color of the bars, which represents the direction of the trend, while the background indicates the strength of that trend.
Bar Color: The color of the bars typically changes to reflect whether the trend is bullish or bearish. For example, green bars may indicate a strong bullish trend, while red bars signal a bearish or declining trend. The color coding helps to quickly interpret the market's overall movement in relation to mining profitability.
Background Color: The background of the chart is used to reflect the strength of the trend. A darker or more intense background may signify a stronger trend, indicating that the market conditions are more pronounced, while a lighter background can suggest a weaker or more uncertain trend, showing less certainty in the market’s direction.
Together, the combination of bar color and background provides a clearer picture of both the trend's direction and its strength, making it easier to assess potential market behavior based on miner profitability and market cycles.
Puell Multiple and Moving Average: They can be used as an extra tool to confirm the bullish or bearish trend. When the Puell Multiple is above the Moving Average, this will suggest and confirm that the trend is bullish.
How you score this for your own systems is up to you.
-Jeffrey

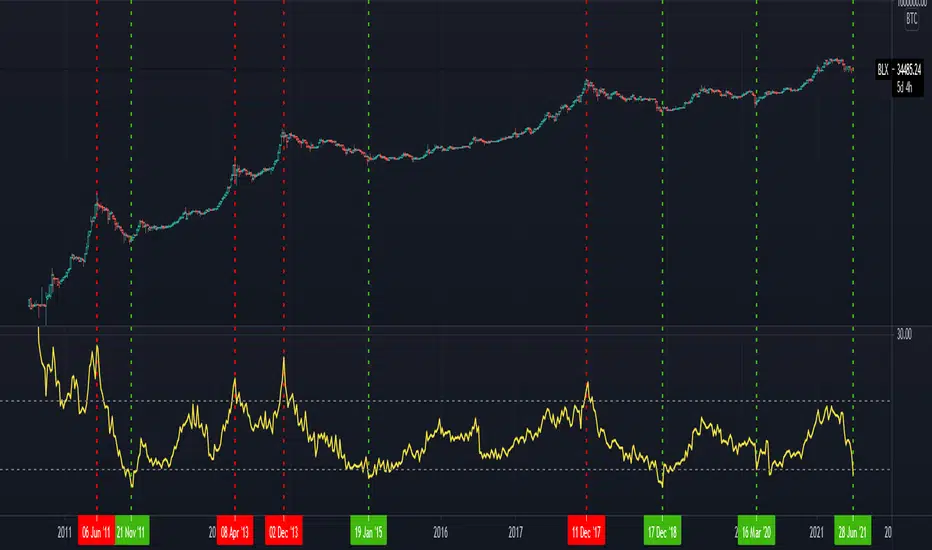
Bitcoin Puell Multiple (BPM)The Bitcoin Puell Multiple is a key indicator for evaluating buying and selling opportunities based on the profitability of Bitcoin miners.
The Idea
The Bitcoin Puell Multiple is a ratio that measures the daily profitability of Bitcoin miners in relation to the historical annual average of this profitability. It is calculated by dividing the amount of newly issued Bitcoins (in USD) each day by the 365-day moving average of that same amount. This indicator provides valuable information on Bitcoin's market cycles, helping investors to identify periods when Bitcoin is potentially undervalued or overvalued.
How to Use
To use the Bitcoin Puell Multiple, investors watch for extreme levels of the indicator. A high Puell Multiple suggests that miners are making exceptionally high profits compared to the previous year, which could indicate an overvaluation of Bitcoin and a selling opportunity (red zones). Conversely, a low Puell Multiple indicates that miners' earnings are low relative to history, suggesting an undervaluation of Bitcoin and a potential buying opportunity (green zones). The trigger thresholds for these zones can be configured in the tool's parameters.
What makes this tool different from the other "Puell Multiple" scripts available is that it is up to date in terms of its data sources, with a more precise calculation, and allows you to view the entire history.
Zone trigger limits and their visualization, as well as colors, are all configurable via the tool parameters.
Here, for example, is a configuration with more sensitive trigger levels and a different color:

Trend Tracer IndexThis is the first iteration of an effort to make multiple well-known analytical tools collaborate to help give an objective consensus to the current market conditions.
This indicator ONLY works on a 1 Day Bitcoin Chart!
It contains the following indicators:
Puell Multiple (ours: )
Hash ribbons (by capriole_charles: )
Weekly moving average
Logaritmic growth curve (by quantadelic: )
Stock to flow model (ours: )
Each indicator can be viewed one at a time as either an overlay or oscillator version of itself. Make sure to read the tooltip (the little "i") on how to switch between them since you need to manually move it between the oscillator pane and the chart pane.
A global index was added which will take the average of all these indicators to show the final consensus.
You can assign weights to each indicator, this will affect the Global index. They can be viewed as a 0 to 1 or a 0 to 100 scale, it should work the same.
For example if you don't want the stock to flow index as part of your equation leave that at 0, maybe you want the weekly moving average at half it's weight you can put it at 0.5. This way the global index average will primarily be decided by the other 3 indicators, and slightly be affected by the weekly moving average.
There is a table that contains all the index values of each indicator for a quick overview.
Finally, alerts have been added for each indicator and the global index.
I will maintain this indicator with updates and perhaps even add more analytical tools based on any suggestions.

B1rd's Puell MultipleThis metric looks at the supply side of Bitcoin's economy - bitcoin miners and their revenue.
It explores market cycles from a mining revenue perspective. Bitcoin miners are sometimes referred to as compulsory sellers due to their need to cover fixed costs of mining hardware in a market where price is extremely volatile. The revenue they generate can therefore influence price over time.
The Puell Multiple is calculated by dividing the daily issuance value of bitcoins (in USD) by the 365-day moving average of daily issuance value.
So far, buying below 0.5 and taking profit above 4.0 has been proven profitable over the years.
This version allows you to expiriment with different moving average types.
I might update this version in the future with more expirimental tools of measurements, I just need some idea's to work with. So feel free to comment on what you'd like to see added to this version.
[Maco] PUELL MULTIPLEReverse formulated what the closed source version is and releasing open source publicly to give back to the community.
If you have any questions feel free to join our Discord!

🔗Blockchain Fundamentals - PUELL MULTIPLE! by Cryptorhythms🔗Blockchain Fundamentals - PUELL MULTIPLE! by Cryptorhythms
Intro
The PUELL MULTIPLE! is a way to gauge market cycles from a mining profitability / compulsory sellers' perspective. It takes total miner revenue and adjusts by its yearly moving average. Calculation = mining revenue / 365-day simple moving average of mining revenue.
(The indicator is written that way in all caps at the request of its Creator David Puell)
Still over half a dozen blockchain based indicators to come (follow me and dont miss them!)
IS THE BOTTOM IN ?
The PUELL MULTIPLE! seems to suggest it is. With an insanely accurate call history this is a long term bitcoin maximalists dream indicator. You're welcome!
Extras
As usual we took care of you with some selectable options for the MA type and length so you can experiment.
Want more information?
For a better write up that I could do, check out this thread here: medium.com
👍 Enjoying this indicator or find it useful? Please give me a like and follow! I post crypto analysis, price action strategies and free indicators regularly.
💬 Questions? Comments? Want to get access to an entire suite of proven trading indicators? Come visit us on telegram and chat, or just soak up some knowledge. We make timely posts about the market, news, and strategy everyday. Our community isn't open only to subscribers - everyone is welcome to join.
For Trialers & Chat: t.me
