Ranges by TraderHaroThis indicator highlights a custom price range for a selected date/time period on your chart. It draws key levels (0.00, 0.25, 0.50, 0.75, 1.00) within the range, visually marking the Premium Zone (upper range) and Discount Zone (lower range).
Features:
- Define a specific date/time range for the analysis.
- Optional fill between top and bottom levels with customizable color and transparency.
- Shows mid-levels (0.25, 0.50, 0.75) for additional guidance.
- Lines and fill can be extended to the right side of the chart.
- Labels for levels can be displayed or hidden.
Use Case:
Quickly identify where price is trading relative to a defined range, visualize potential zones of premium (resistance) and discount (support), and make better-informed trading decisions.
Rangebound

Recent Range DetectorOverview
The Recent Range Detector is a specialized indicator designed to identify when an asset is currently range-bound, providing traders with clear support and resistance levels for range trading strategies. Unlike traditional indicators that focus on trend detection, this tool specifically answers the question: "Is the price range-bound right now, and what are the exact trading levels?"
Key Features
✅ Smart Range Detection - Uses a multi-factor scoring system to identify legitimate ranges
✅ Dynamic Support/Resistance Levels - Automatically calculates and displays key trading levels
✅ Range Quality Scoring - Provides confidence levels (Strong/Moderate/Weak Range)
✅ Touch Validation - Counts actual price touches to confirm range reliability
✅ Breakout Detection - Alerts when price exits the established range
✅ Visual Clarity - Clean boxes, lines, and labels for easy interpretation
How It Works
The indicator analyses recent price action using three core metrics:
Touch Quality (40%) - How many times price has respected support/resistance levels
Containment Quality (40%) - What percentage of recent bars stayed within the range
Recent Respect (20%) - Whether the latest price action confirms the range
These combine into a Range Score (0-1) that determines range strength and reliability.
Settings & Parameters
Range Lookback Period (Default: 15)
Number of bars to analyse for range detection
Shorter periods = more responsive to recent ranges
Longer periods = more stable, fewer false signals
Range Tolerance (Default: 2.0%)
Tolerance for price touches around exact highs/lows
Lower values = stricter range requirements
Higher values = more flexible range detection
Minimum Touches (Default: 3)
Required number of support/resistance touches for valid range
Higher values = more confirmed ranges, fewer signals
Lower values = more sensitive, earlier detection
Visual Options
Show Range Box: Displays the range boundaries
Show Support/Resistance Lines: Extends levels into the future
Understanding the Output
Range Score (0.000 - 1.000)
0.7+ = Strong Range (Green) - High confidence range trading setup
0.5-0.7 = Moderate Range (Yellow) - Decent range with some caution
0.3-0.5 = Weak Range (Orange) - Low confidence, be careful
<0.3 = Not Ranging - Avoid range trading strategies
Range Status Classifications
Strong Range - Perfect for range trading strategies
Moderate Range - Good range with normal risk
Weak Range - Marginal range, use smaller positions
Not Ranging - Price is trending or too choppy for range trading
Key Metrics in Info Table
Range Size (%) - Size of the range relative to price level
5-15% = Ideal range size for most strategies
<5% = Tight range, lower profit potential
>15% = Wide range, higher profit potential but more risk
Support/Resistance Levels - Exact price levels for entries/exits
Use these as your key trading levels
Support = potential buy zone
Resistance = potential sell zone
Total Touches - Number of times price respected the levels
3-5 touches = Newly formed range
6-10 touches = Well-established range
10+ touches = Very strong, reliable range
Price Position (%) - Current location within the range
0-20% = Near support (potential long opportunity)
80-100% = Near resistance (potential short opportunity)
40-60% = Middle of range (wait for better entry)
Visual Elements
Range Box
Green Box = Strong Range (Score ≥ 0.7)
Yellow Box = Moderate Range (Score 0.5-0.7)
Orange Box = Weak Range (Score 0.3-0.5)
Support/Resistance Lines
- Horizontal lines showing exact trading levels
- Extend into the future for forward guidance
- Colour matches the range strength
Background Colouring
- Subtle background tint during range periods
- Helps quickly identify ranging vs trending markets
Breakout Signals
- 📈 RANGE BREAK UP - Price breaks above resistance
- 📉 RANGE BREAK DOWN - Price breaks below support
- Only appears for confirmed ranges (Score ≥ 0.5)
Trading Applications
Range Trading Strategy
1. Look for Range Score ≥ 0.5
2. Buy near support (Price Position 0-20%)
3. Sell near resistance (Price Position 80-100%)
4. Set stops just outside the range
5. Exit on breakout signals
Breakout Strategy
1. Identify strong ranges (Score ≥ 0.7)
2. Wait for volume-confirmed breakout
3. Enter in breakout direction
4. Use previous resistance as support (or vice versa)
Market Context
- Strong ranges often occur after trending moves
- Use higher timeframes to confirm overall market structure
- Combine with volume analysis for better entries/exits
Best Practices
What to Look For
✅ Range Score ≥ 0.5 for trading consideration
✅ Multiple touches (5+) for confirmation
✅ Clear price rejection at levels
✅ Reasonable range size (5-15% for most assets)
✅ Recent price respect of boundaries
What to Avoid
❌ Trading ranges with Score < 0.3
❌ Very tight ranges (<3% size) - low profit potential
❌ Ranges with only 1-2 touches - not confirmed
❌ Ignoring breakout signals
❌ Trading against the higher timeframe trend
Alerts Available
- Range Detected - New range formation
- Range Break Up - Upward breakout
- Range Break Down - Downward breakout
- Range Ended - Range condition ended
Timeframe Recommendations
- Daily Charts - Best for swing trading ranges
- 4H Charts - Good for intermediate-term ranges
- 1H Charts - Suitable for day trading ranges
- Lower Timeframes - May produce more noise
Conclusion
The Recent Range Detector eliminates guesswork in range identification by providing objective, quantified range analysis. It's particularly valuable for traders who prefer range-bound strategies or need to identify when trending strategies should be avoided.
Remember: No indicator is perfect. Always combine with proper risk management, volume analysis, and broader market context for best results.
Disclaimer
This indicator is for educational purposes only and should not be considered as financial advice. Trading involves risk, and past performance does not guarantee future results. Always conduct your own research and consider your risk tolerance before making any trading decisions.

TNTThis script just changes the background of the chart to show Trending(Green) / Range Bound(Red) Regions.
The concept is very simple, al each candle we look at the size of the candle and use a moving average of these candle body size (ABS (close-open)) and compare it agains a double smoothened average, i.e. moving average of this average to find trending or not trending periods.
I find it useful primarily for entry in options, a green background is more favourable for option buying and a red background is more favourable for option selling.
This script tells you nothing about the direction of trade.

Range Bound Channel Index (RBCI) w/ Expanded Source Types [Loxx]Range Bound Channel Index (RBCI) w/ Expanded Source Types is a reversal and trend indicator. This version includes Bollinger bands to show trend exhaustion
What is Range Bound Channel Index (RBCI)?
Range Bound Channel Index (RBCI) is calculated by using a channel (bandwidth) filter (CF). Channel filter simultaneously fulfills two functions: removes low frequent trend formed by low frequent components of the spectrum; removes high frequency noise formed by the high frequent components of the spectrum.
When RBCI approaches its local maximum the prices approach upper border of the trading channel and when RBCI approach its local minimum the prices approach the lower border of the trading corridor.
Included:
-Toggle on/off bar coloring
-Loxx's Expanded Source Types

Stochastic ChannelsDonchain trend following system with overbought/ oversold areas inspired by stochastic. Multiplier to get non repainting HTF capability. features a smoothed price as well as moving average of the smoothed price, also inspired by the stochastic indicators %K and %D. This and slow stochastics compliment each other nicely.
%D line colored by direction.
Filled color areas represent overbought/oversold.
Shows breakouts as well as giving targets and entries in rangebound markets.

Box Range AlertSimple Script for getting alerts on the crossing of Upper & Lower levels either way.
Good for Free users as they can only use 1 alert at a time. So this indicator will be useful to get alerts on both Breakout Or Breakdowns.
Just add input Price manually and set alerts.

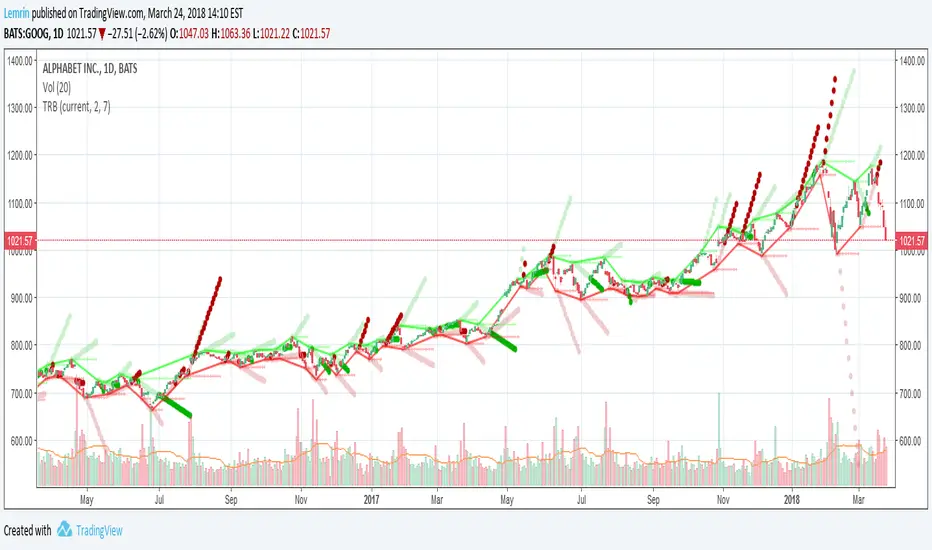
Fractal Breakout V2Version 2 of my fractal pattern aid ( Version 1 ).
I added a bouncing line between the high and low trend lines, connecting consecutive extreme points. I also chased down a pesky bug in the slope calculation...and for now I have disabled the ability to change resolution basis for extreme detection (e.g. 30m on a 1hr chart).
For fun, I added some shading to make it more apparent at a glance what is happening, but if you find it gimmicky, there's an option to turn that off.
I am inexperienced with pattern recognition, so please send feedback if you have any ideas that would make this more useful.
Thanks!
Lemrin
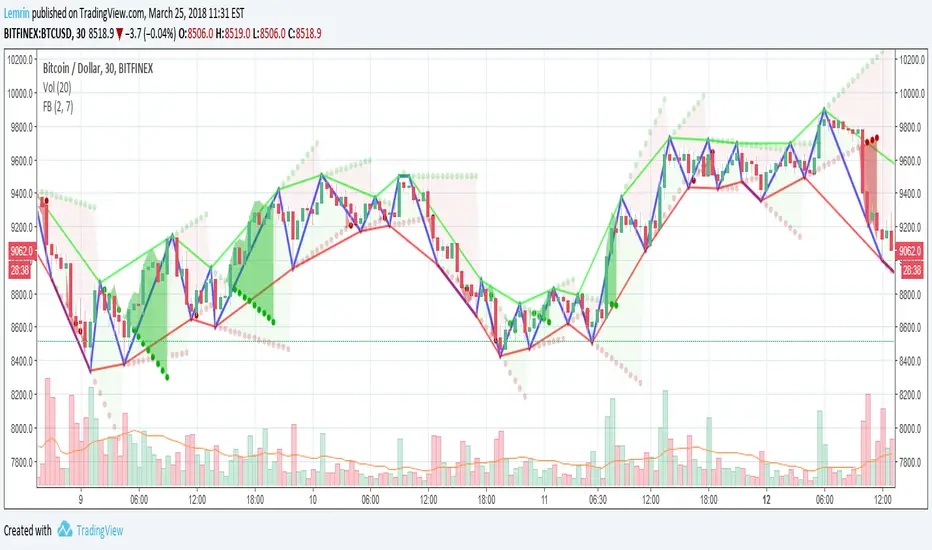
Fractal BreakoutFirst of all, huge credit to synapticEx , whose brilliant use of the security function inspired me to figure out a way to get quasi-shape boundaries automatically drawn on a chart.
This study draws upper and lower trend lines, based on configurable fractal*** reversal detection, calculates slope from the last two upper or lower reversal points, and then extends a dotted line along the same slope...until the next upper (or lower) reversal occurs. If the high (or low) breaks this extension, the dotted line becomes solid to aid visibility. Reversal detection is configurable to use any number of ticks, but probably four to eight will work best.
I made the inclusion of volume in the reversal logic optional (off by default) and left the existing SMA input found in synapticEx's code intact, albeit with a lower default. With the addition of trend lines, I found volume hindered identification of reversals, although I could try various other filters than the SMA included originally.
I have also left intact the very nice ability to change the period and use the requested period identify reversals, courtesy of synapticEx.
This could be used in a strategy, as the values plotted are actual values that are available to include in logic and do not include knowledge of the future. However , information is not available until the floor of half the number of ticks used in reversal detection (I then offset by that number to line things up visually). Having never heard of it until now, I just Googled the Bill Williams Alligator strategy, which looks interesting, so maybe I could see how this could be ported to that.
***As I typed this, I remembered that while making reversal detection configurable, I changed the detection logic simply to look for highest (or lowest) of the desired length of ticks. I don't know whether this is not strictly fractal anymore, but if desired, with a little work, I could make it require consecutive, consistent changes before and after each reversal again.
Here are a few screenshots from hourly ticks, using the "current" (hourly) period, with and without volume, and playing with the number of points used to identify reversals.
Not using volume
Using volume
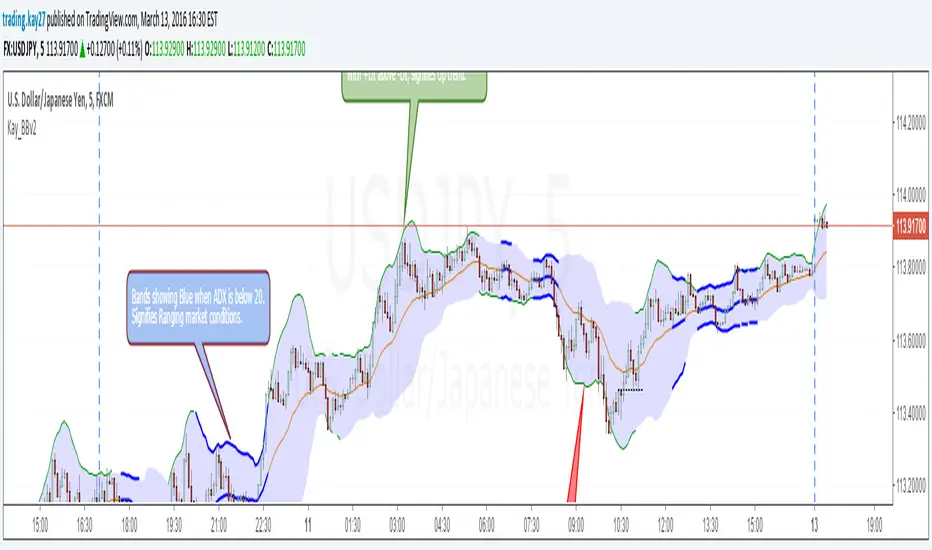
Kay_BBands v2This is the second version of Kay_BBands. But this is infused with ADX.
When +DI (Directional Index) is above -DI, then Upper band will be visible and vice-versa.
This is when the ADX is above the threshold. 20 is the default but can be set to 25.
When the ADX is below the specified threshold, both bands gets visible, showing no trending conditions.
Use it with another band with setting 20/21, 0.6 deviation. Prices keeping above or below the 2nd bands upper or lower bounds shows trending conditions.