Stop Loss Advisor📊 Stop Loss Advisor - Advanced Risk Management Tool
A sophisticated Pine Script v5 indicator designed to suggest optimal stop loss distances based on market volatility, combining ATR and Standard Deviation analysis for precise risk management.
🎯 What Makes This Different from Bollinger Bands?
While Bollinger Bands focus on mean reversion and overbought/oversold conditions using a moving average center line, this indicator is specifically designed for risk management . It creates dynamic bands around the current price to suggest where NOT to place your stop loss, preventing you from being stopped out by normal market noise.
⚡ Key Features
Dynamic ATR Calculation - Fully customizable ATR periods with adaptive volatility filtering
Standard Deviation Integration - Optional StdDev component for enhanced statistical accuracy
Multiple Combination Modes - Average, Maximum, ATR Weighted, or StdDev Weighted
Flexible Price Sources - Choose from Close, HL2, HLC3, or OHLC4
Automatic Pip Calculation - Works across all instruments with automatic pip value detection
Smart Alerts System - Get notified when suggested stop loss exceeds your base risk tolerance
Real-time Information Table - Displays current values and risk status
Visual Labels - Shows exact pip distances directly on chart
Band Smoothing - Prevents erratic movements with customizable averaging
📈 How It Works
ATR Analysis : Calculates Average True Range to measure current market volatility
Statistical Enhancement : Optionally combines with Standard Deviation for more robust calculations
Dynamic Bands : Creates upper and lower bands that expand/contract with volatility
Pip Conversion : Automatically converts distances to pips for easy interpretation
Risk Assessment : Compares suggested distances with your base stop loss tolerance
🔧 Customization Options
ATR Settings:
Customizable ATR period (default: 14)
Adjustable multiplier with 0.1 step precision
Optional volatility filtering for enhanced sensitivity
Standard Deviation (Optional):
Independent period and multiplier settings
Multiple price source options
Four combination modes with ATR
Visual Customization:
Fully customizable colors for all elements
Multiple line styles (solid, dashed, dotted)
Optional band filling with transparency control
Show/hide ATR line overlay
Configurable band smoothing
💡 Perfect For
Forex Traders - Especially effective on major pairs and XAUUSD
Risk Managers - Calculate optimal stop distances before entering trades
Scalpers - Avoid being stopped out by normal market fluctuations
Swing Traders - Adapt stop losses to current volatility conditions
📊 Indicator Values
The information table displays:
Current ATR Value (in pips)
Suggested Long Stop Loss (distance in pips)
Suggested Short Stop Loss (distance in pips)
Risk Status - "SAFE" or "HIGH RISK" based on your base tolerance
Standard Deviation Value (when enabled)
Combination Method (when using both ATR and StdDev)
⚠️ Important Notes
This indicator suggests minimum stop loss distances, not entry/exit signals
Always combine with your trading strategy and risk management rules
Do not use as a standalone trading system
Backtesting recommended before live implementation
Default settings work well for most scenarios, but optimization is encouraged
🎨 Default Configuration
ATR Period: 14
ATR Multiplier: 2.0
Price Source: Close
Base Stop Loss: 20 pips
Band Smoothing: 3 periods
Standard Deviation: Optional (20 period, 2.0 multiplier)
🚀 Getting Started
Add the indicator to your chart
Set your base stop loss tolerance in the settings
Choose your preferred price source and ATR parameters
Enable Standard Deviation for enhanced accuracy (optional)
Monitor the information table for real-time risk assessment
Use the suggested distances as minimum stop loss levels
Pro Tip: In low volatility markets, the bands will contract suggesting tighter stops. In high volatility periods, they expand warning you to use wider stops to avoid being stopped out by normal price action.
📝 Version History & Updates
This indicator is actively maintained and updated based on user feedback. Future enhancements may include multi-timeframe analysis, trend-based asymmetric bands, and additional statistical measures.
Transform your risk management approach with data-driven stop loss suggestions that adapt to real market conditions!
Rdl_finance

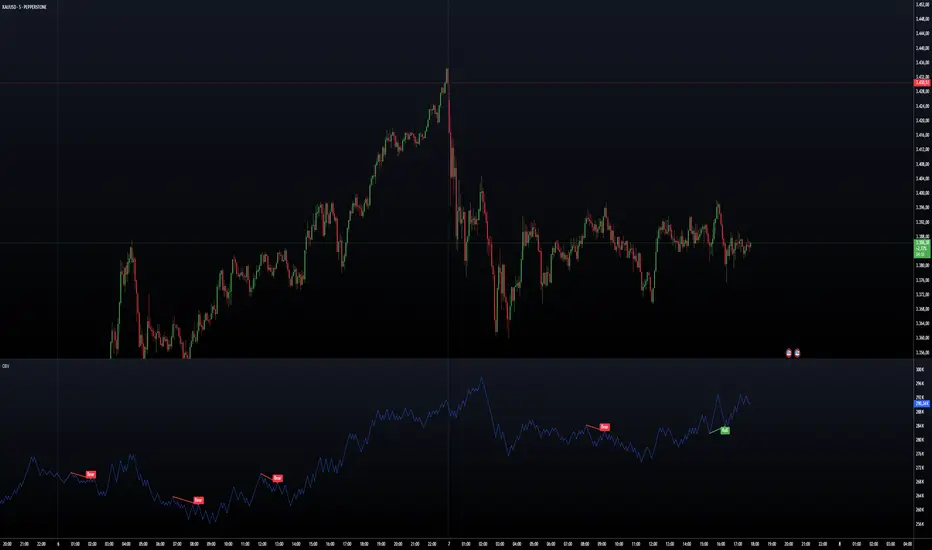
On Balance Volume W DivergenceOBV With Divergence Indicator
A comprehensive On Balance Volume (OBV) indicator enhanced with divergence detection capabilities.
Core Features:
Classic OBV calculation with volume-based price movement tracking
Advanced divergence detection system
Multiple smoothing options for OBV
Bollinger Bands integration
Technical Components:
Volume-based price movement analysis
Pivot point detection for divergence
Customizable lookback periods
Adjustable divergence range parameters
Customization Options:
Multiple Moving Average types (SMA, EMA, SMMA, WMA, VWMA)
Bollinger Bands with adjustable standard deviation
Divergence sensitivity settings
Visual customization for signals and alerts
The indicator combines traditional OBV analysis with modern divergence detection, offering traders a powerful tool for identifying potential trend reversals and market momentum shifts.
Key Parameters:
- Pivot Lookback Right/Left: 5 (default)
- Divergence Range: 5-60 bars
- MA Length: 14 (default)
- BB StdDev: 2.0 (default)
Alert System:
- Bullish divergence alerts
- Bearish divergence alerts
- Customizable alert messages
Note: The indicator requires volume data to function properly and will display an error if volume data is not available.
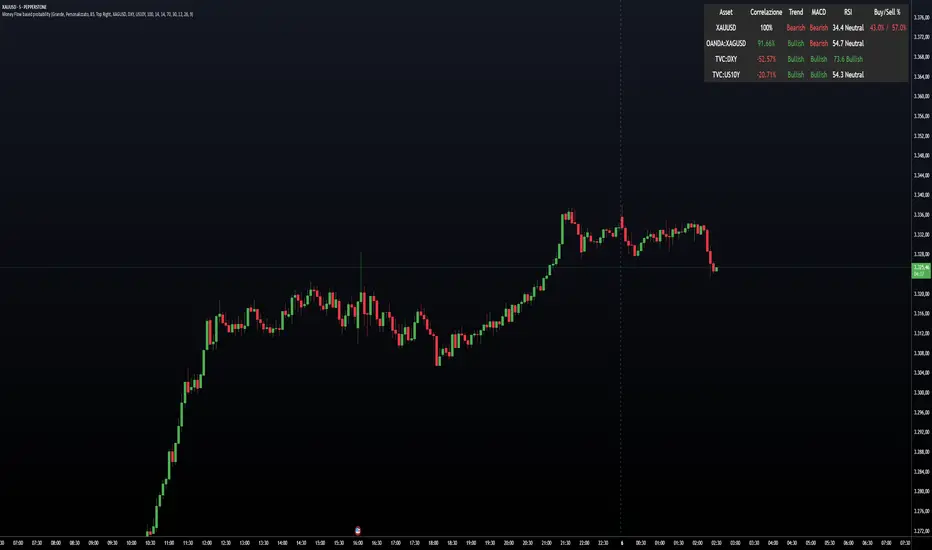
Money Flow based probabilityMoney Flow based probability
This indicator provides a comprehensive correlation and momentum analysis between your main asset and up to three selected correlated assets. It combines correlation, trend, momentum, and overbought/oversold signals into a single, easy-to-read table directly on your chart.
Correlated Asset Selection :
You can select up to three correlated assets (e.g., indices, currencies, bonds) to compare with your main chart symbol. Each asset can be toggled on or off.
Correlation Calculation :
The indicator uses the native Pine Script ta.correlation function to measure the statistical relationship between the closing prices of your asset and each selected pair over a user-defined period.
Technical Analysis Integration :
For each asset (including the main one), the indicator calculates:
Trend direction using EMA (Exponential Moving Average) – optional
Momentum using MACD – optional
Overbought/oversold status using RSI – optional
Probability Scoring :
A weighted scoring system combines correlation, trend, MACD, RSI, and trend exhaustion signals to produce buy and sell probabilities for the main asset.
Visual Table Output :
A customizable table is displayed on the chart, showing:
Asset name
Correlation (as a percentage, -100% to +100%)
Trend (Bullish/Bearish)
MACD status (Bullish/Bearish)
RSI value and status
Buy/Sell probability (with fixed-width formatting for stability)
User Customization :
You can adjust:
Table size, color, and position
Correlation period
EMA, MACD, and RSI parameters
Which assets to display
This indicator is ideal for traders who want to quickly assess the influence of major correlated markets and technical signals on their trading instrument, all in a single glance.
---
Example: Correlation Calculation
corrCurrentAsset1 = ta.correlation(close, asset1Data, correlationPeriod)
Example: Table Output (Buy/Sell %)
buyStr = f_formatPercent(buyProbability) + "%"
sellStr = f_formatPercent(sellProbability) + "%"
cellStr = buyStr + " / " + sellStr
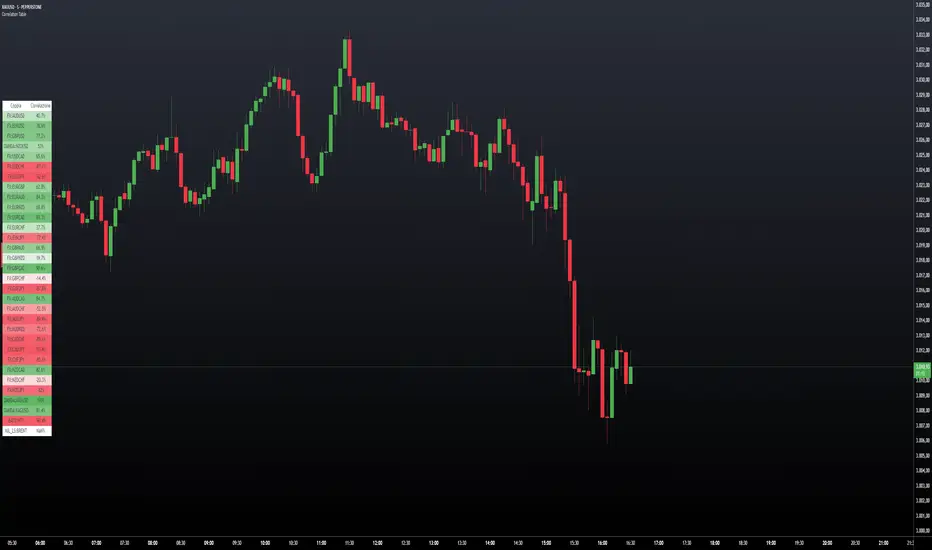
Correlation TableThis indicator displays a vertical table that shows the correlation between the asset currently loaded on the chart and up to 32 selected trading pairs. It offers the following features:
Chart-Based Correlation: Correlations are calculated based on the asset you have loaded in your chart, providing relevant insights for your current market focus.
Configurable Pairs: Choose from a list of 32 symbols (e.g., AUDUSD, EURUSD, GBPUSD, etc.) with individual checkboxes to include or exclude each pair in the correlation analysis.
Custom Correlation Length: Adjust the lookback period for the correlation calculation to suit your analysis needs.
Optional EMA Smoothing: Enable an Exponential Moving Average (EMA) on the price data, with a configurable EMA length, to smooth the series before calculating correlations.
Color-Coded Output: The table cells change color based on the correlation strength and direction—neutral, bullish (green), or bearish (red)—making it easy to interpret at a glance.
Clear Table Layout: The indicator outputs a neatly organized vertical table with headers for "Pair" and "Correlation," ensuring the information is displayed cleanly and is easy to understand.
Ideal for traders who want a quick visual overview of how different instruments correlate with their current asset, this tool supports informed multi-asset analysis
ITALIANO:
Questo indicatore visualizza una tabella verticale che mostra la correlazione tra l'asset attualmente caricato sul grafico e fino a 32 coppie di trading selezionate. Offre le seguenti funzionalità:
Correlazione basata sul grafico: le correlazioni vengono calcolate in base all'asset caricato nel grafico, fornendo informazioni pertinenti per il tuo attuale focus di mercato.
Coppie configurabili: scegli da un elenco di 32 simboli (ad esempio, AUDUSD, EURUSD, GBPUSD, ecc.) con caselle di controllo individuali per includere o escludere ciascuna coppia nell'analisi della correlazione.
Lunghezza di correlazione personalizzata: regola il periodo di lookback per il calcolo della correlazione in base alle tue esigenze di analisi.
Smoothing EMA opzionale: abilita una media mobile esponenziale (EMA) sui dati dei prezzi, con una lunghezza EMA configurabile, per smussare la serie prima di calcolare le correlazioni.
Output codificato a colori: le celle della tabella cambiano colore in base alla forza e alla direzione della correlazione, neutra, rialzista (verde) o ribassista (rosso), rendendola facile da interpretare a colpo d'occhio.
Clear Table Layout: l'indicatore genera una tabella verticale ordinatamente organizzata con intestazioni per "Coppia" e "Correlazione", assicurando che le informazioni siano visualizzate in modo chiaro e siano facili da comprendere.
Ideale per i trader che desiderano una rapida panoramica visiva di come diversi strumenti siano correlati con il loro asset corrente, questo strumento supporta un'analisi multi-asset informata
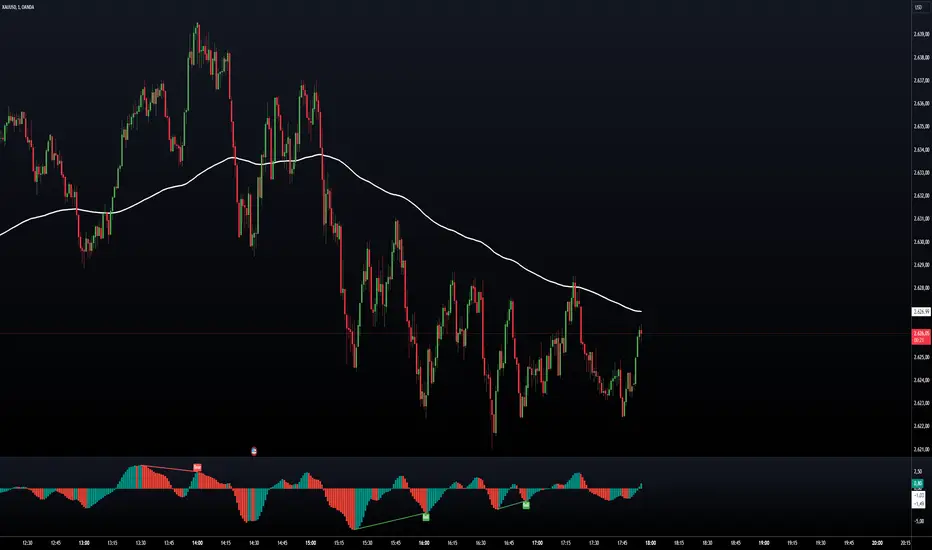
Awesome Oscillator with DivergenceSimple Awesome Oscillator with Divergences
This TradingView script combines the classic Awesome Oscillator (AO) with divergence detection. It plots AO as a histogram, highlighting changes in momentum. Divergences are identified based on pivot highs and lows, signaling potential trend reversals:
- Bullish Divergence: Price makes lower lows, AO makes higher lows.
- Bearish Divergence: Price makes higher highs, AO makes lower highs.
Visual signals (arrows) and alerts ensure clear identification, making it ideal for traders focusing on momentum and trend reversals.