ZORZOR (Zone of Outperformance Ratio) with Supporting Indicators
This custom indicator introduces an approach to measuring asset performance through the Zone of Outperformance Ratio (ZOR), complemented by two supporting indicators for comprehensive market analysis.
1. ZOR (Zone of Outperformance Ratio)
The ZOR is the cornerstone of this indicator, offering a unique perspective on an asset's performance across multiple time zones:
Measures the degree of an asset's outperformance against a benchmark (default: NSE:NIFTY) across different time zones
Utilizes a weighted multi-timeframe approach for a holistic performance view
Combines performance ratios from 63, 126, 189, and 252-day zones and results in a score between 0-99, with higher scores indicating stronger outperformance across zones
Key Features:
Fully configurable weights for each timeframe (63, 126, 189, 252 days)
Customizable benchmark symbol
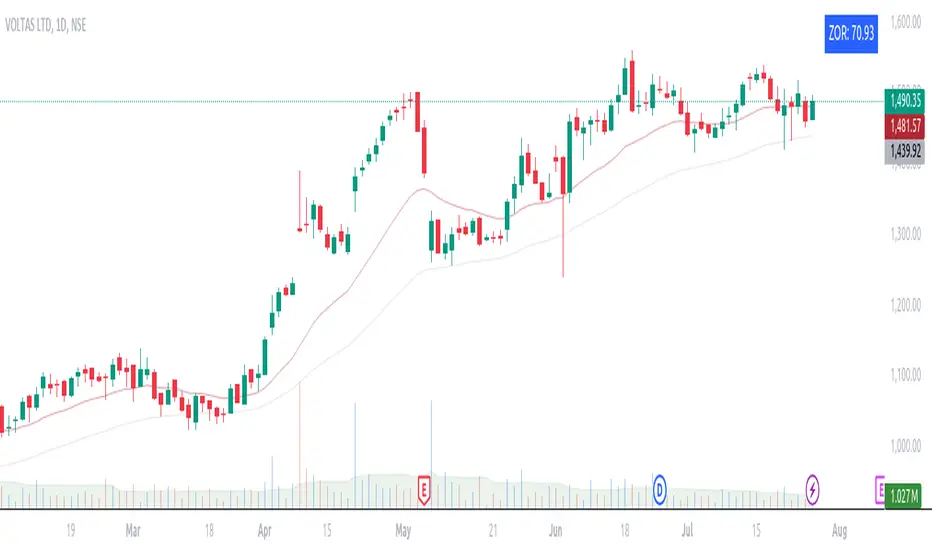
Color-coded display: Blue for scores ≥60 (strong performance), Red for scores <60 (weaker performance)
2. Supporting Indicators
To enhance analysis and provide context to the ZOR score, two additional indicators are included:
a) Distance to 52-week High:
Calculates the percentage distance between current price and 52-week high
Color-coded for quick interpretation:
Yellow-green when price is above 52-week high
Dark green when price is below 52-week high
Helps identify potential overbought conditions or breakout scenarios
b) Distance to EMA:
Shows percentage distance from current price to a user-defined EMA (default: 21-day)
Helps gauge short-term momentum relative to the trend
Useful for identifying potential mean reversion opportunities
Originality and Usefulness
The ZOR indicator offers a fresh perspective on relative performance by:
Combining multiple timeframes into a single, easy-to-interpret score
Applying a non-linear transformation to emphasize recent performance
Providing a flexible framework for comparing assets against any chosen benchmark
The supporting indicators complement the ZOR by offering additional context:
Distance to 52-week High helps identify potential trend strength and breakout scenarios
Distance to EMA provides insights into short-term momentum and potential mean reversion
This combination allows traders to:
Quickly identify outperforming assets across multiple timeframes
Assess whether an asset is extended from its long-term highs or short-term average
Make more informed decisions by considering relative performance, trend strength, and momentum in a single view
How to Use
1. Add the indicator to your chart
2. Customize settings in the indicator properties:
- Set benchmark symbol
- Toggle visibility of supporting indicators
- Customize EMA length for Distance to EMA
- Adjust ZOR calculation weights(Optional)
3. Interpret the color-coded labels:
- ZOR: Blue (strong performance) or Red (weaker performance)
- Distance to High: Yellow-green (above 52-week high) or Dark green (below)
- Distance to EMA: Purple label showing percentage
4. Use in conjunction with other technical and fundamental analysis for comprehensive trading decisions
This indicator provides a unique, multi-faceted approach to performance analysis, combining relative strength measurement with trend and momentum indicators for a holistic market view.