Renko

[ssabu] Renko Chart✅ Renko Chart Indicator
실시간으로 캔들 차트를 렌코차트로 바꿔서 배경에 렌코차트를 자동으로 그려주는 인디케이터 입니다.
It is an indicator that automatically draws a Renko chart in the background by changing the candle chart to a Renko chart in real time.
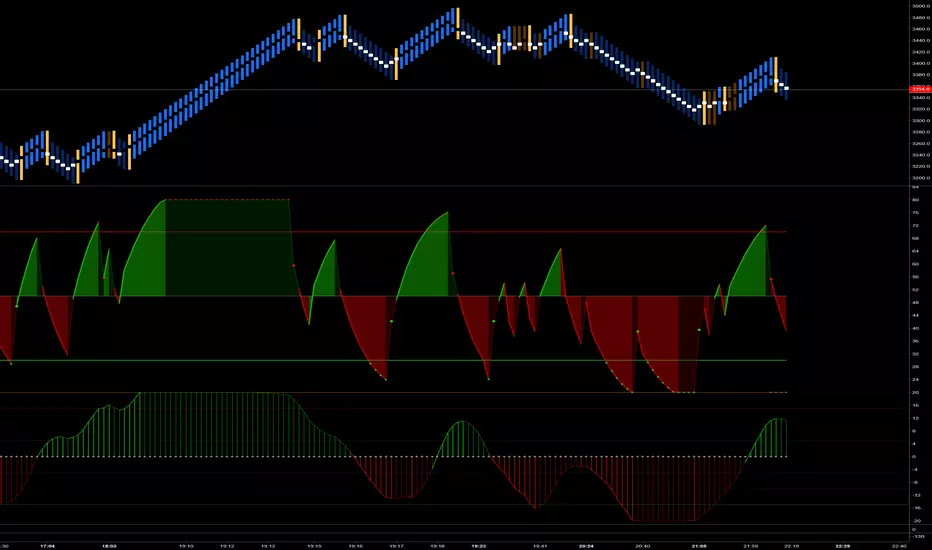
위의 사진은 캔들차트를 렌코로 바꾸고 해당 인디케이터를 적용한 스크린샷
Above picture is a screenshot of changing the candle chart to Renko and applying the indicator

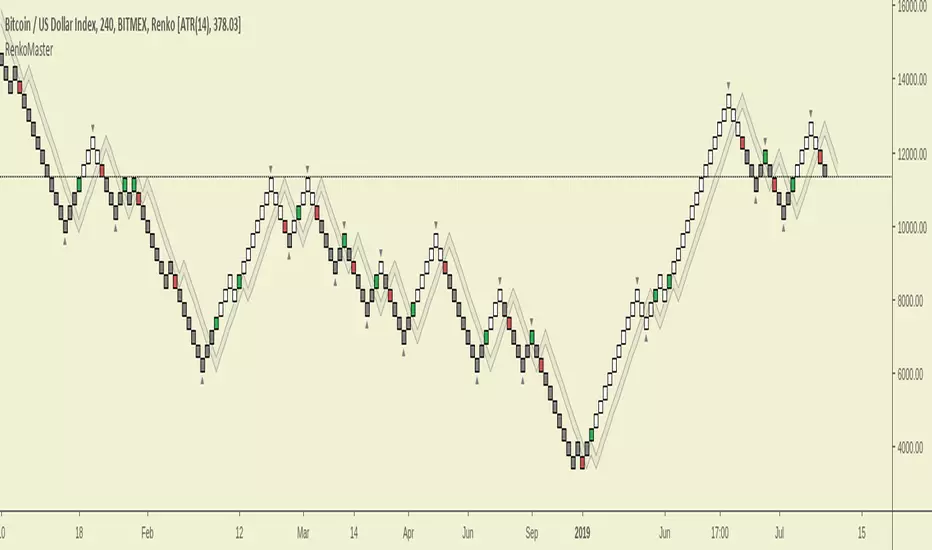
RenkoMasterRenkoMaster is a variant of our popular TrendMaster Script with adjusted parameters. It can be used to provide confluence when determining Renko entries and exits.
Setting Up The Indicator
After purchase, open the TradingView indicator library. Under the Invite-Only Scripts section, you will see RenkoMaster. Add it to your chart. Next, you must customise your theme settings to allow RenkoMaster to take over control of your candle colours. You can find a complete set-up tutorial on our website.
Candle Colours
By default, RenkoMaster will colour your candles in black and white. White candles indicate an uptrend in an asset and the candles will not change colour until the trend has reversed and a counter-trend signal has been printed. Black candles indicate a downtrend, they will remain black until a counter-trend long signal candle has been printed.
Signal candles
A signal candle is printed when the price of an asset closes above or below the moving average cloud and the medium term trend moving average. By requiring two criteria for a single candle to print we will see a drastic reduction in the number of false signals.
The RenkoMaster entry technique further reduces the likelihood of false entries. To enter a trade we do not buy the signal block immediately. Instead, we treat the signal block as an indication that a trend change is possible. We want to see confirmation of this trend before making an entry. To enter we place a pending order a few ticks above or below the high or low of the signal block. By doing this we only enter a trade when the asset has shown a continuation in the direction of the suggested trend change.
Our Story
Founded in 2018 by IchimokuScholar and C00kie, TrendMaster is a team that produces technical analysis indicators with an emphasis on simplicity and noise reduction. We support a large community with educational content, automated market scanners and mentoring in our private chat rooms. We produce technical analysis indicators geared primarily towards the emerging Cryptocurrency asset class. We provide educational material to assist trader development and host a large online trend following community. All of our products are designed to help traders distinguish relevant information from background noise. Our indicators encourage disciplined trade management to maximise the opportunity captured while minimising losses.
IchimokuScholar
IchimokuScholar – In 2017 I retired from a career in higher education to focus on Trading. I like to trade long term trends, focusing primarily on continuation setups. I am dedicated to sharing my knowledge of trading and take great pleasure in simplifying technical analysis for newer traders.
C00kie
I started trading crypto in 2017 and immediately started coding a bunch of tools to improve my quality of life. Some definitely worked out better than others. Like to trade the higher timeframes and drawing horizontal lines on charts. I am also pretty much obligated to like cookies.
Renko Weis Wave VolumeA volume bulls vs bears power indicator that is based entirely on Wyckoff Weis Wave Volume trends. This indicator is part of my DIVINE series RENKO indicators that run on an engine capable of extracting Renko brick information from a time series. As with the Renko RSI and Renko Trend Momentum indicators, swapping between Renko and time series type charts(bar, candlestick , heikin ashi) is seamless.
The algorithm uses the cumulative volume sum during the lifetime of a Renko brick formation. It tries hard to dissect and distribute volume when multiple bricks are formed during a single time candle (bar, candlestick , heikin ashi). Both positive and negative volume are plotted simultaneously, so that any instance where multiple bricks are created in a single time candle, positive and negative volume will be shown.
4 color themes as with all of the other DIVINE series indicators and strategies.
Shows ares of accumulation, distribution, capitulation. volatility .
Shows volatile brick locations with counts that indicate the number of nested bricks that were contained in a single time based candle.
Works well with Renko Price Bars Overlay script.
Reference to explanation of volatile brick information tips.
All feature requests are welcome. PM for access.

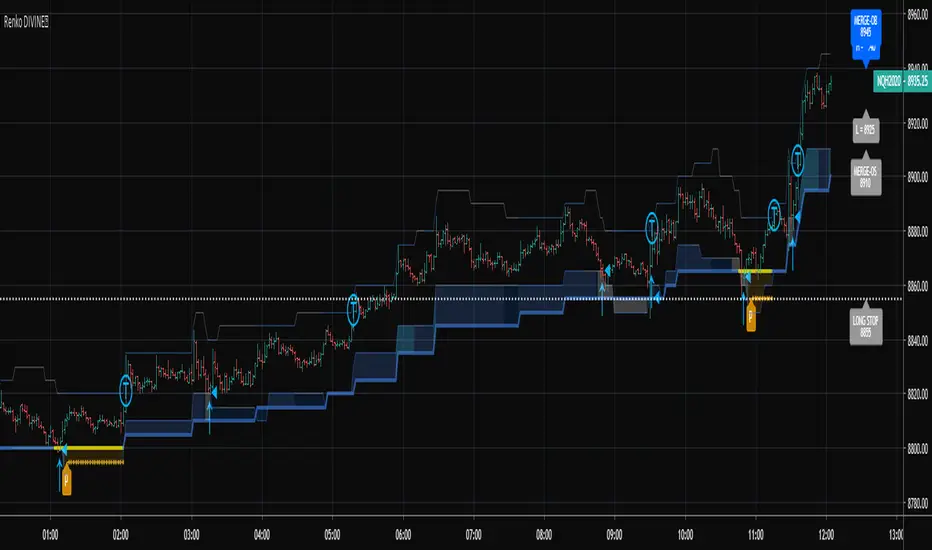
RSI-RENKO Divine StrategyLive, non-repainting strategy using RENKO and RSI mixed together to multiple types of long and short positions.
- Features -
Live entry direction with trade warnings and alerts
Live trade building buy and sell limits (for buy/sell limits)
Entry location icons as well as pyramid entries (to add to existing position)
Swing trades that keep you in the trade for the maximum possible profit
1 scalp target based on the RSI settings and entry location
Dynamic trailing stop for swings and scalps
Alert conditions for every update and condition change of the strategy (Provided by indicator study)
4 pre-built color themes, including candlestick coloring
This script is used solely for alerts to the RSI-RENKO Divine Strategy , because Trading View still after 3 years of requesting does not provide the ability to use alert conditions inside a strategy script, only an indicator script. This strategy should be used to backtest your settings. Beyond alerts and strategy inputs, the strategy and indicator are identical.
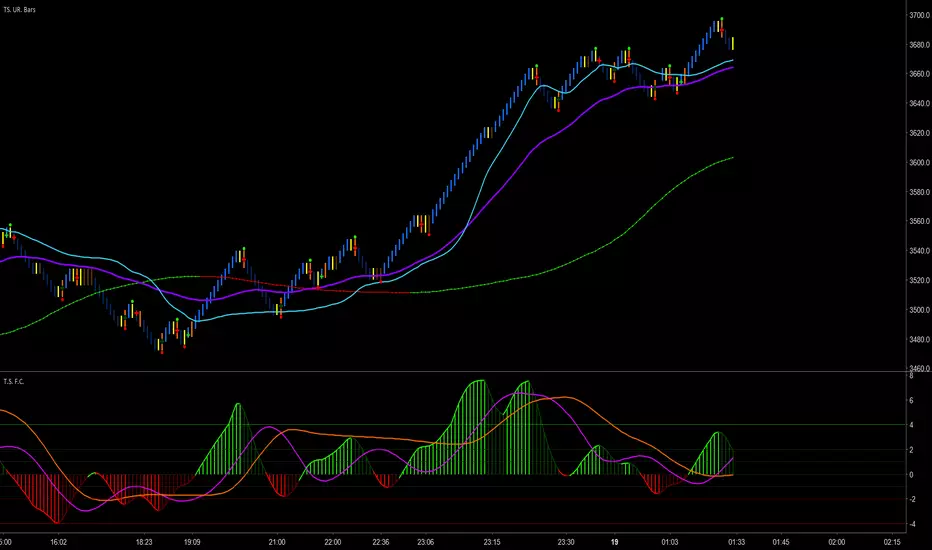
Renko RSIThe goal of this indicator is to plot the RSI values "as if" the chart is a true price action based Renko chart. It can be used on a time series chart or Renko series chart. The RSI is derived from the raw price action of a time-based chart, where the historic and live price is clustered into Renko bricks. The Renko brick production algorithm is entirely backed by Renko Price Bars Overlay and thoroughly tested.
The algorithm takes into account rapid brick production within a single time candle and adjusts accordingly. The output may vary slightly between different chart time frames for the same indicator settings, but this is due to the lack of price fluctuation visibility that can occur in higher chart time frames. If the brick tick size is low, an appropriate chart interval should be selected that maximizes the amount of price volatility visible to the indicator. A bad setting would be something like a 1 tick EURUSD Renko setting on an H4 chart, there simply is no way to derive the exact and ordered price fluctuations in a single H4 candle, 1 pip at a time. A more appropriate chart time frame would be 1-3 minutes for this selected Renko brick size.
Plots user specified RSI based on Renko bricks. This would be the same (or very close to) the RSI viewed on a normal Renko chart based on price action alone.
Works well with Renko Price Bars Overlay script.
See also: Renko Trend Momentum

Renko Trend MomentumA momentum indicator that shows bulls vs bears strength of renko brick production. The algorithm takes into account rapid brick production within a single time candle and adjust accordingly. The output may vary slightly between different chart time frames for the same indicator settings, but this is due to the lack of price fluctuation visibility that can occur in higher chart time frames. If the brick tick size is low, an appropriate chart interval should be selected that maximizes the amount of price volatility visible to the indicator.
Plots the normalized rate of new Renko Up Brick production vs new Renko Down Brick production.
Custom crossover threshold to help prevent whipsaws and keep you in the trend.
Shows pending areas when a crossover is imminent.
Custom time-based buffer combined with a crossover to keep you in the trend.
Shows crossover background color changes when the direction of the Renko Trend changes.
Works well with Renko Price Bars Overlay script.


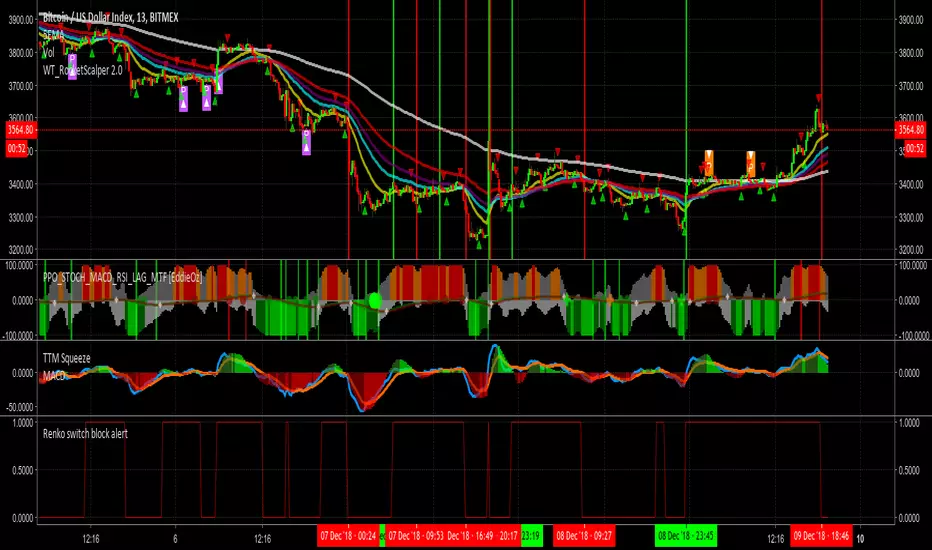
Stochastic RSI Signal LinesThis script is for private use only. I created it as step 1 for my Renko Trading Strategy.
Tested on BitMex on XBTUSD.

RENKO MTFMultiframe RENKO panes with timeframe-weighted signal line and warning dots. All timeframes in settings MUST be <= your timeframe or it will repains on bigger timeframes.

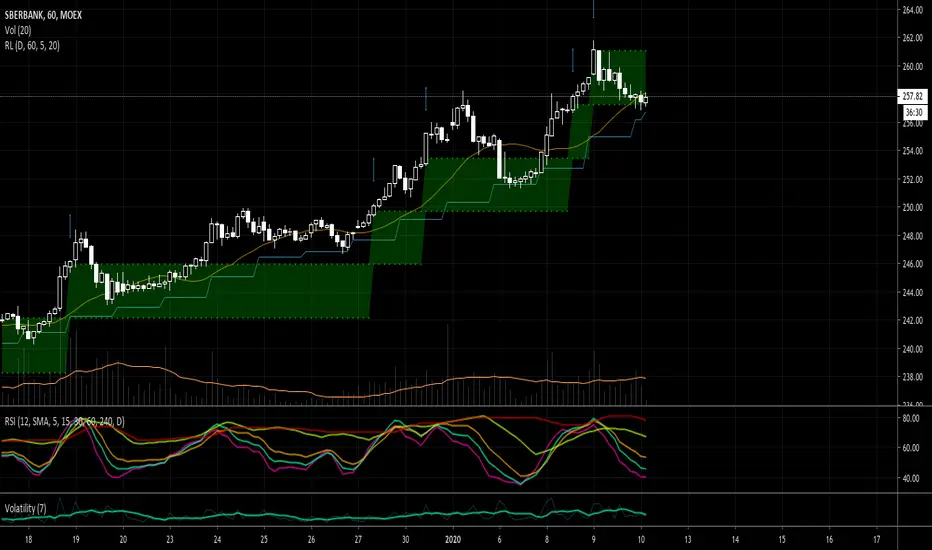
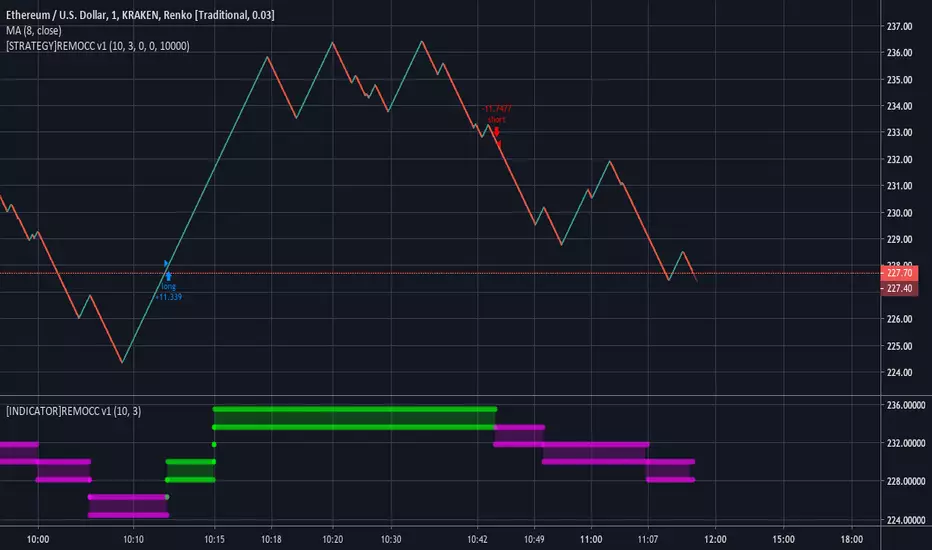
Renko - RSI MomentumIn essence this Renko trading system is the following:
1. Momentum based entries
2. Trend trading system (small losses, big wins)
3. As well as a trend continuation system
------------------------------
!IMPORTANT!
------------------------------
- You MUST have a Pro+ account. Why? Cause Renko NEEDS to run on 1min or 5min chart, nothing larger.
If you don't, the chart will repaint .
------------------------------
CHART SETUP
------------------------------
1. Set chart to Renko
2. Set period of chart to 1 min (or 5 min)
3. Set Renko box size method to "Traditional"
4. Set Renko box size to:
- JPY Pairs: 0.2 to 0.4
- Other Major/Minors: 0.002 - 0.004
- Exotic pairs: NO IDEA... (I haven't tested them yet)
5. Load the indicator
------------------------------
RULES
------------------------------
Trend Entry
An arrow will appear the following conditions are met:
LONG: RSI(7) goes above 55 AND price is above the 50 SMA
SHORT: RSI(7) goes below 45 AND price is below the 50 SMA
Enter immediately after the bar is printed.
Counter Trend Entry
An orange dot appears when the following conditions are met:
LONG: RSI(7) goes above 55 AND price is below the 50 SMA and above the 10 EMA
SHORT: RSI(7) goes below 45 AND price is above the 50 SMA and below the 10 EMA
I would not suggest entering immediately but rather finding a trendline or support/resistance that is being broken.
Exit
- Exit when a white bar is printed
- OR use your own discretion. Like 2 bars in opposite direction or on EMA cross or hit of support/resistance.
------------------------------
CHART
------------------------------
- Green bars are when the RSI(7) is above 55.
- Red bars are when the RSI(7) is below 45.
- White bars are when the RSI(7) is between 45and 55.
------------------------------

Morpheus Renko Chart Overlay by ZekisRenko is very useful in many strategies, but Tradingview does not support original Renko charts, where time is 0 and the single variable is the price action
This script can overlay the normal Candles Chart with Renko bricks and behaves like an original Renko brick formula
This is a simple way of looking at a Renko Chart inside a normal Candles Chart
You need to adjust the value manualy, like in Traditional Renko
If a price goes up by that value, new brick is formed with green color, vice versa for the down side
I filled bricks with red and green for a better view
Added Long and Short signs
Added alerts
(Original script wrote by Richard Santos and modified by Ni6HTH4wK)
Enjoy!
@Zekis

Traderset Uni Renko - Awesome OscillatorThis is simply Bill Williams AO oscillator, fabricated with predefined numbers to better fit the Uni Renko charts and my methodology. The reason for publishing this version is that the original numbers (you can see them on the top instance of the oscillator) does not behave that much satisfactory when it comes to renko charting in my methodology !
The AO is not a part of my methodology nor Alligator, but i know some people who would like to have these two tools in renko charts. Here you have it.

Unit Renko Box SizeThis is a simple script that shows two averages for box size on Uni Renko system for users to use.
The user should use the green line (Box Size) that is more persistent in the last hour. if there are equal minutes between two numbers, use the upper number.
Now users can easily check the timed candle sticks at the start of the day for three time frames we use in my methodology, set the box size for the charts at the start of the day and continue trading the whole day.
The charts now will sit on "traditional" setting rather than previously used "atr", no thanks to trading view's amazingly wrong way of calculating renko !!!!

Stochastic RSI Momentum TranformThis is my version of Stochastic RSI, but not the stochastic RSI alone, hell no, it's a lagging indicator, I don't like lagging indicators.
This is a leading indicator that has momentum calculations in it and not only that, it has a momentum shifting calculation based on modified ehler's transformation !
Simple for user, a hell to program !
Price and how to get access to ? contact me in PM !

Trader Set - MTF Reversal Bar SignalsThis is Multi Tile Frame signalling of reversal bar strategy. Using this, you can easily Identify if you had a reversal bar signal in 1,2,3,4,5,10,15, and 30 minute based renko charts.
The more time frames get in sync with each other, the higher possibility for a more powerful signal.
The least you would need is for 1,2 and 3 minutes to have 2 out of 3 of them showing same signal.
Please don't ask for getting access, the licensing will be available for purchase soon in the website and I will announce it in the comment section.

Trader Set - Modified MTF BOTTOMThis is a modified formula for MFT. It's prefabricated with numbers that would work best with my methodology and system.
Please don't ask for getting access. Only my students can get access to these indicators.
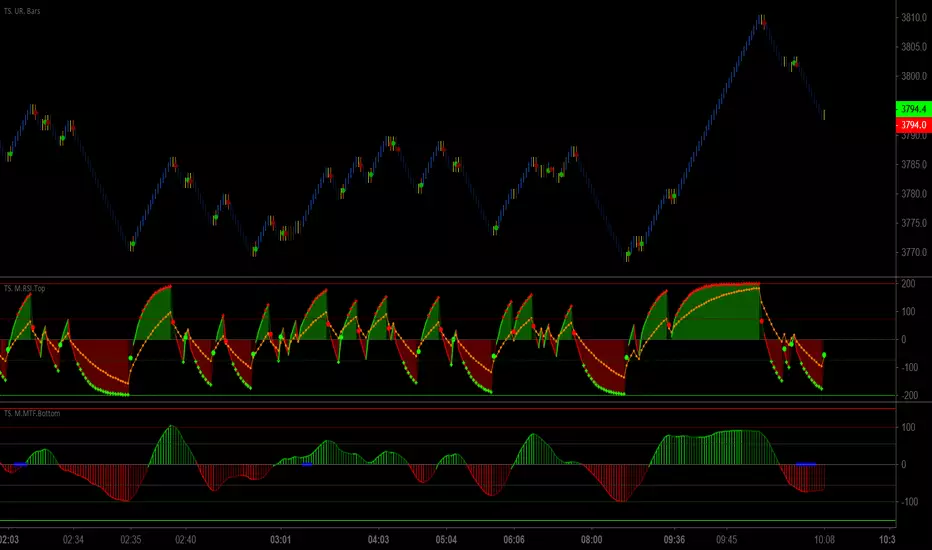
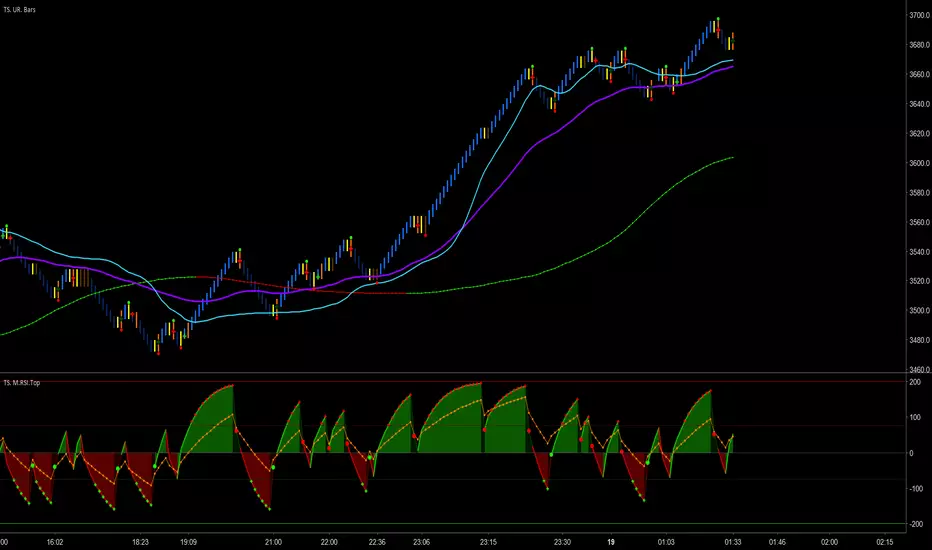
Trader Set - Modified RSI TOPThis is a modified RSI formula that draws two different RSI time frames on top of eachother with additional signal points on it.
Please don't ask for getting access. Only my students can have access to these tools because they are part of my methodology and prefabricated with fixed numbers that would work ONLY on my system.
Trader Set - Modified RSI MTFThis is a modified version of RSI MTF, a similar indicator can be found in public library if anyone is interested, mine, is fabricated to work with my methology with all the addition i will add to this (just like others when i added the ability to change the moving types in critical places of formula) so that students can experiment with them (it will come in next version). also, I normalize both sections for better visualization.
Please don't ask me for getting access. "CM Modified RSI MFI" search it for the base and almost similar indicator without my additions. This script will be available only for my students at the time being. like other scripts, if the learning material will be ready i will be announce in comment section, and like others, again, if i decide to sell this separated from courses i will announce in the comment section too.
Trader Set - Fisher CycleUnfortunately, the fihser transform's formula has specifications that are not compatible with newer versions of pine script (calling mutable variables on security function).
So, I had to separate this section of "Cycle" script to it's own little world and remove the versioning from the script.
That, means that i can't even write the name of the oscillator on the right hand side (show_last is not there in older versions).
Welcome to the world of pine script and haphazard updates of trading view without thinking about consequences of their new move !