Time Machine█ OVERVIEW
This script is designed to display future and current time resistance levels based on multiple techniques such as candle behaviors and count and some significant financial times according to Gann and more.
Each chart consists of an X-Axis ( time ) and a Y-Axis ( price ). Price can travel up and down giving you both support and resistance levels, on the other hand, time only travels forward which is why they are called time resistance levels.
Time resistance happens at multiple significant places. Have you noticed that when a triangle breaks north or south that the tip of the triangle acts as time resistance level where something happens ? Many patterns and techniques are designed
to detect and these levels through patters, candle behavior and more. This script aims to assist in detecting these levels ahead of time or at candle opens . This is a very important point. A signal of time resistance can be displayed at candle open
or ahead of time. both of these cases mean that the time resistance is confirmed. These resistance levels are rated on a scale from 0 to 3 and this scale could change and more filtering could be applied in the future to make this script
even more powerful. I would say this is a functional beta version ( v0.5 ) that could be improved upon and that's what I intend to do. scroll down to see if there are any other upgrades to this script. Each time frame has its own time resistance levels. Future levels could appear at any point;
for example, if there are no future time resistance levels within the next 6 days -lets say,- this does not mean that one doesn't appear tomorrow. A regular check would give you an edge in this script. Of course this is something that can be improved in the near future. This script does not reprint ( confirmed data does not change ) but more future data can be added no previous data.
Enjoy!
█ Future Plans and upgrades to this script may include :
1. Adding more astro influencers into the script.
2. Fine tuning the script a bit more to filter unwanted noise.
3. Adding toggle switches for users to select from. ( toggle between multiple techniques )
and more! feel free to let me know what you'd like to see!
█ How to use :
1. Put the script on your chart
give the script a few seconds and you should be set.
This script is coded as an addon to the Gann ToolBox package/scripts.
Resistant

Support/Resistant Zone (Simple)The concepts of trading level support and resistance are undoubtedly two of the most highly discussed attributes of technical analysis.
Support is a price level where a downtrend can be expected to pause due to a concentration of demand or buying interest. As the price of assets or securities drops, demand for the shares increases, thus forming the support line. Meanwhile, resistance zones arise due to selling interest when prices have increased.
There are many ways to identify support and resistance zones. This indicator is a simple method to identify them. Support/Resistant zones will draw basing on the size of the wick for candles, which are Pivots High/Low before.

Price action: Fibonacci + Support/Resistant + TrendlinePrice action: Fibonacci + Support/Resistant + Trendline
In this indicator, I find entry long/Short by combining: Fibonacci + Support/Resistant + Trendline (One of Advanced Price action Analysis).
How it works:
1. Find Impulse wave:
To findind Impulse wave, It uses Pivot High/Low to find Impulse wave. In case find entry Long, If having Pivot High higher Pivot High before, it will draw an Impulse wave.
2. Find entry at Fibonacci levels:
Draw Fibonacci fibonacci retracement from Pivot Low to Pivot High. A Fibonacci retracement forecast is created by taking two extreme points on a chart and dividing the vertical distance by important Fibonacci ratios. 0% is considered to be the start of the retracement, while 100% is a complete reversal to the original price before the move. Horizontal lines are drawn in the chart for these price levels to provide support and resistance levels. Common levels are 23.6%, 38.2%, 50%, and 61.8%
3. Find entry at Support/Resistant Zone:
Support/Resistant Zone drawed from Pivot High before, which price just breaken and return to retest.
4. Find entry at Trendline:
Trendline drawed from Pivot High/Low before, which price just breaken and return to retest.
This is study version. Having strategy version to backtesting.

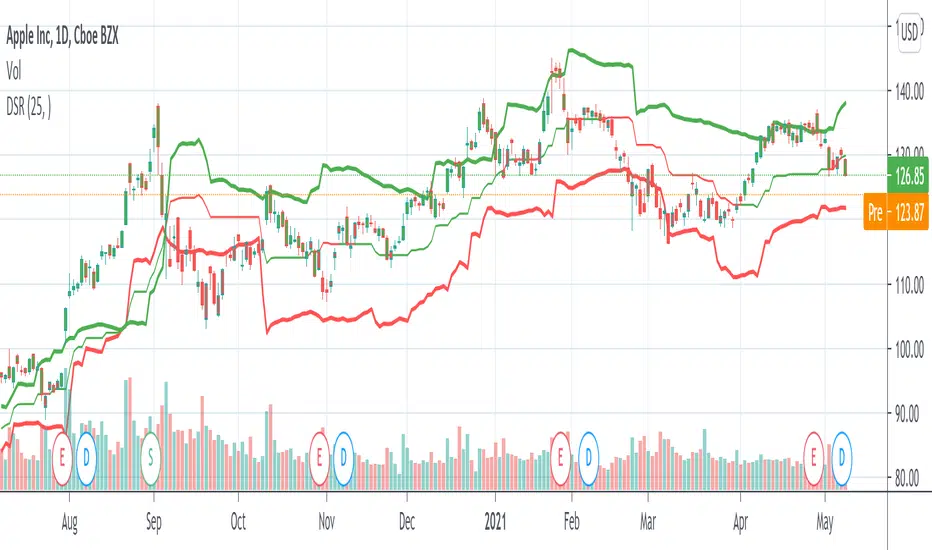
Dynamic Support And Resistance [CC]The Dynamic Support And Resistance Indicator was created by Mike Siroky (Stocks and Commodities pgs 14-18) and this is a handy indicator that will show you useful support and resistance levels no matter how the stock is doing right now. I have color coded the middle line to show buy and sell signals so buy when the line turns green and sell when it turns red.
Let me know if there are any other indicators you want me to publish!
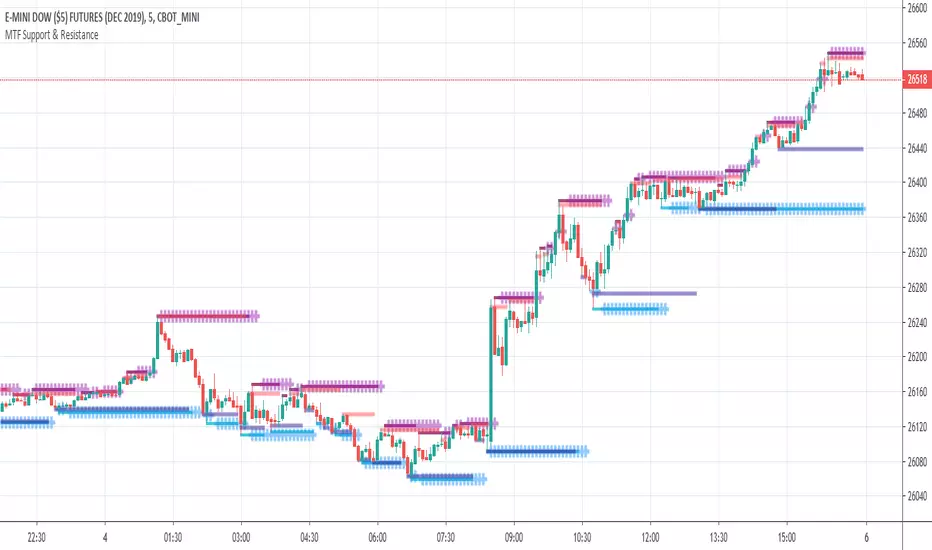
THD MTF Support & ResistanceThe TradersHelpDesk MTF support and resistance identifies the support or resistance on multiple timeframes.
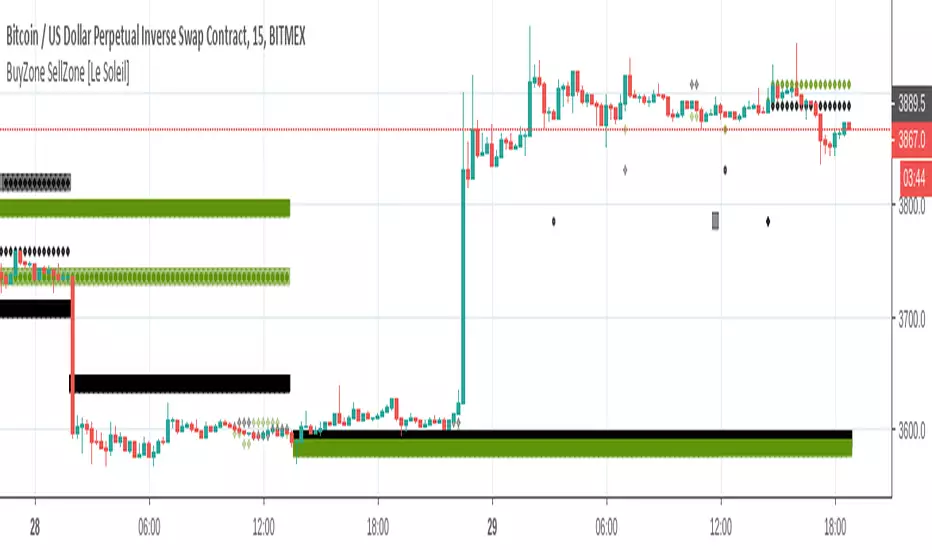
BuyZone SellZone [Le Soleil]Show buy zone, sell zone. You can use it for trade and margin. It is really useful and more effective than Support Resitance line. Like and follow me if you like it.