Retrograde Planets - CERetrograde Planets - Community Edition
Welcome to the Retrograde Planets - Community Edition, a specialized tool designed to empower traders with W.D. Gann’s time-theory principles by highlighting planetary retrograde cycles. This feature-complete indicator allows traders to visualize critical retrograde periods for market analysis across equities, forex, commodities, and cryptocurrencies. As a seamless add-on to the Gann ToolBox, it enhances time-based trading strategies with precision and clarity.
Overview
The Retrograde Planets - Community Edition identifies and highlights retrograde cycles for Mercury, Venus, Mars, Jupiter, Saturn, Uranus, and Neptune, key periods often associated with market volatility and trend shifts in Gann’s methodology. By calculating ecliptic longitudes with high accuracy, the script plots historical and future retrograde periods (up to 365 days ahead) on your chart, complete with visual highlights and labels. This tool is ideal for traders leveraging astrological cycles to anticipate market turning points.
Key Features
Retrograde Cycle Highlighting : Displays retrograde periods for Mercury, Venus, Mars, Jupiter, Saturn, Uranus, and Neptune, marking start and end points with vertical lines and labels.
Historical and Future Projections : Visualizes past retrograde cycles and projects future ones up to a year in advance with minute-level precision.
Customizable Planet Selection : Choose from seven planets to focus on specific retrograde cycles relevant to your analysis.
24/7 Market Optimization : Enable extended future data for continuous markets like crypto, improving performance and projection accuracy.
Styling Flexibility : Customize the highlight color for retrograde periods to enhance chart clarity and align with your visual preferences.
Labeled Visuals : Includes labels (e.g., “℞ Starts,” “℞ Ends”) with tooltips for easy identification of retrograde cycle boundaries.
How It Works
Open Settings : Access the script’s settings to configure your preferences.
Select a Planet : Choose from Mercury, Venus, Mars, Jupiter, Saturn, Uranus, or Neptune to analyze its retrograde cycles.
Enable Retrograde Cycles : Check the box to activate retrograde highlighting for the selected planet.
Customize Highlight Color : Adjust the color of the highlighted retrograde periods for better chart visibility.
Enable 24/7 Mode (Optional) : For crypto or continuous markets, activate the 24/7 setting to include extended future data.
Analyze and Trade : Use the highlighted retrograde periods and labeled lines to identify potential market volatility or trend changes, integrating Gann’s time-theory into your strategy.
Get Started
As a gift to the TradingView community and Gann traders, the Retrograde Planets - Community Edition is provided free of charge. With no features locked, this tool offers full access to retrograde cycle analysis for precise market timing. Trade wisely and harness the power of planetary cycles!
Retrograde

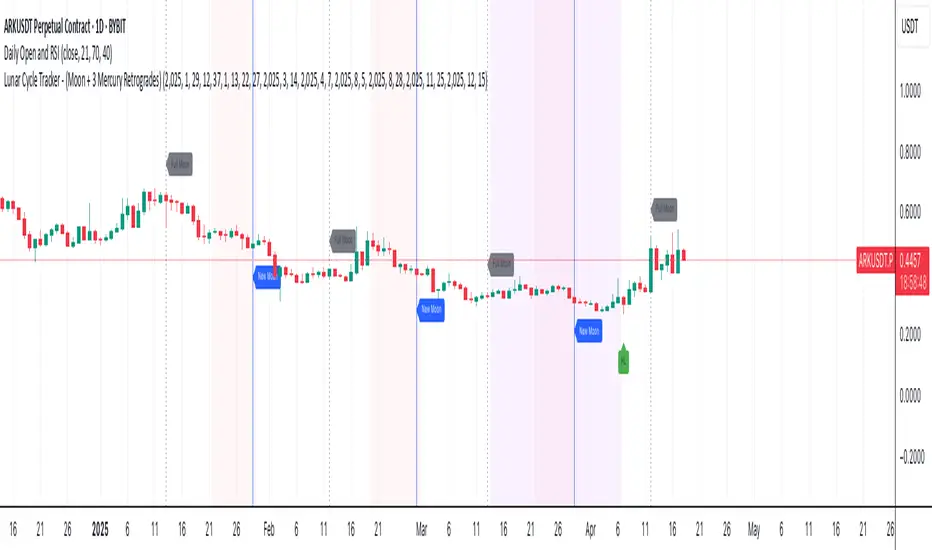
Lunar Cycle Tracker - (Moon + 3 Mercury Retrogrades)This script overlays the lunar and Mercury retrograde cycles directly onto your chart, helping traders visualize natural timing intervals that may influence market behavior.
Key Features:
🌑 New Moon & Full Moon Markers:
Vertical lines and labels indicate new and full moon events each month. You can fully customize their colors.
🌗 Last Quarter Moon Fill:
A soft pink background highlights the last quarter moon phase (from 7.4 days after the full moon to the next new moon).
🪐 Three Mercury Retrograde Zones:
Highlight up to three retrograde periods per year with customizable date inputs and background color. Great for spotting potential reversal or volatility windows.
Customization:
Moon event dates and colors
Manual input for Mercury retrograde periods (year, month, day)
Full compatibility with all timeframes (1H, 4H, daily, etc.)
Great for astro-cycle traders, Gann-based analysts, or anyone who respects time symmetry in the markets.
Fully customizable & works across all timeframes.
This tool was created by AngelArt as part of a larger astro-market model using lunar timing and planetary retrogrades for cycle-based market analysis.
Astro: Celestial Body Channel LinesThis is fork of the previous Astro: Planetary Channel Lines indicator that now includes over a dozen different celestial bodies, made possible after the most recent update of the AstroLib library.
Celestial Body Channel Lines is an approach to financial astrology that involves using the positions of the celestial bodies to predict trends and patterns in the stock market. The idea behind celestial body lines is that the positions of the bodies in the sky at the time of a market event can significantly influence that event.
The celestial body lines approach involves mapping the bodies' positions onto a stock market graph, with each body's position representing a specific line. These lines are thought to indicate areas of support and resistance, as well as potential turning points in the market.
This indicator includes geocentric/heliocentric celestial body lines on the chart for up to two bodies, price scaling & vertical offset, mirror/inversion switch, retrograde highlighting, and aspect recognition with customizable precision.

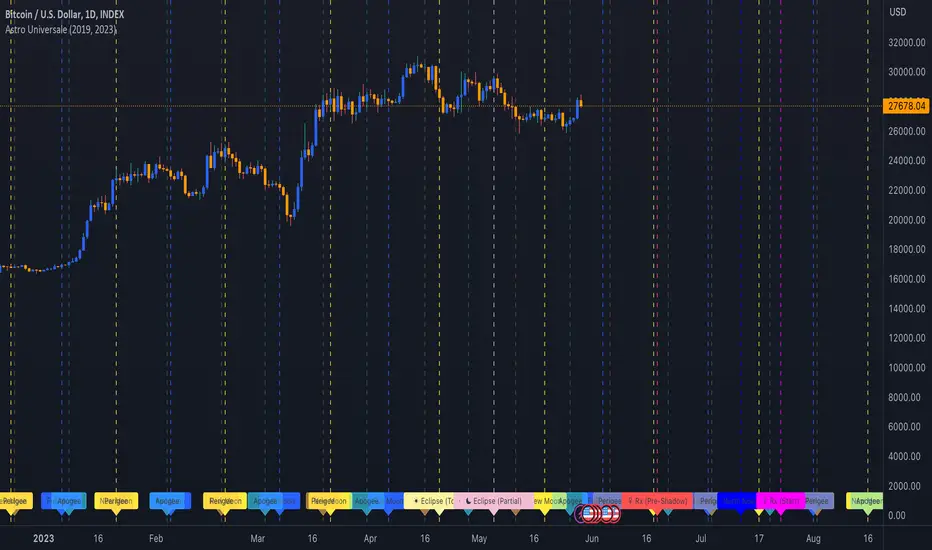
Astro UniversaleSolar Eclipses (Annular, Partial, Total), Lunar Eclipses (Penumbral, Partial, Total), Venus (including shadow periods), Moon Phases, Apogees, Perigees, and the North Node from 2013 to 2024... The dates might vary by one day depending on your location because of differences in time zones.
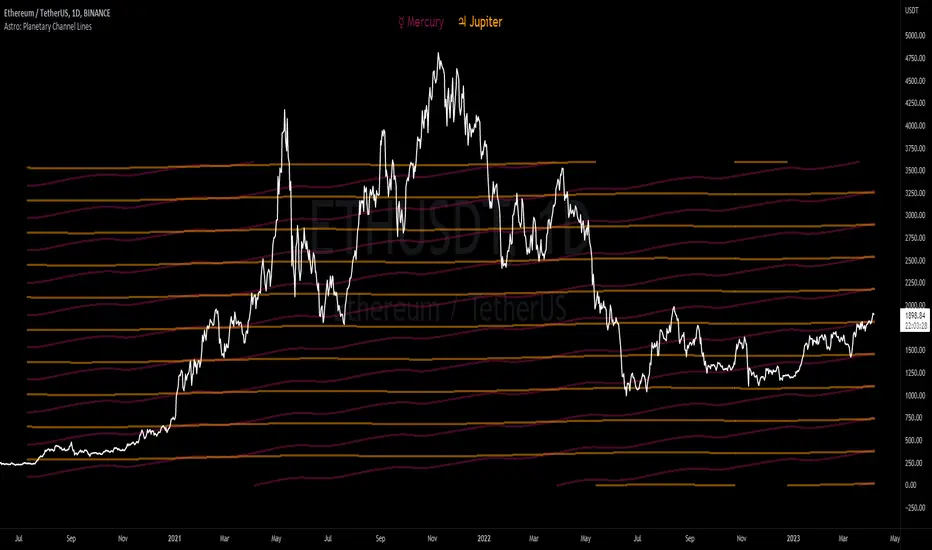
Astro: Planetary Channel LinesPlanetary Channel Lines is an approach to financial astrology that involves using the positions of the planets to predict trends and patterns in the stock market. The idea behind planetary lines is that the positions of the planets in the sky at the time of a market event can significantly influence that event.
The planetary lines approach involves mapping the planets' positions onto a stock market graph, with each planet's position representing a specific line. These lines are thought to indicate areas of support and resistance, as well as potential turning points in the market.
This indicator includes geocentric/heliocentric planetary lines on the chart for up to two planets, price scaling & vertical offset, retrograde highlighting, and aspect recognition with customizable precision.
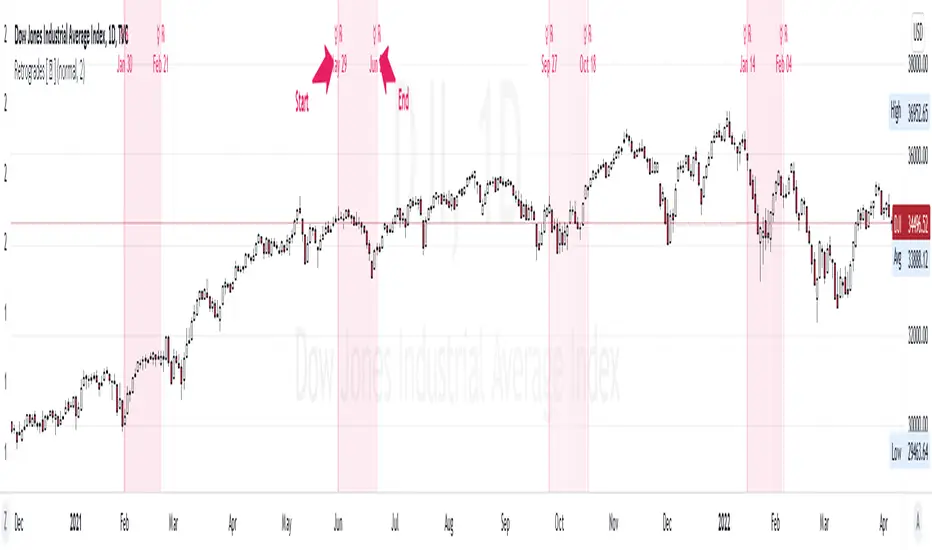
ORB Inner Planet Ingress/Retrograde 2020-22(G-Tropical)In astrology, "planetary ingress" refers to the moment a planet enters a new astrological sign or house.
These planetary ingress brings in directional change in scripts.
This scripts also plots Retrograde Planets which also changes trends of stocks on most occasions.
This scripts will work for the period 2020 to 2022.

Retrogrades hi Traders,
The objectives of this script:
1. you can see the Retrogrades schedule at certain periods ((you can double check it in horoscopes.astro-seek.com)
2. you can see the correlation between the Retrogrades and market reaction
What Is Retrograde Motion?
The astronomical explanation for retrograde motion starts with understanding that the planets in our solar system orbit the Sun at different distances and speeds.
While we orbit the Sun ourselves, we can observe the other planets moving across our sky, following their own paths.
Sometimes, it can appear (from our perspective) that a planet has abruptly switched directions and has started to move in reverse across the sky.
This is, of course, an illusion caused by the position of Earth in relation to that of the planet, since a planet in orbit always travels in one set direction and can’t suddenly reverse course.
This is why we call the phenomenon apparent retrograde motion, as it only looks like the planet is moving backward (“retrograde motion”)!
This Retrogrades script, contains all of Planetary Retrogrades Motion;
1. Mercury Retrogrades ( ≈ 21 days )
2. Jupiter Retrogrades ( ≈ 121 days )
3. Venus Retrogrades ( ≈ 41 days )
4. Uranus Retrogrades ( ≈ 151 days )
5. Mars Retrogrades ( ≈ 72 days )
6. Saturn Retrogrades ( ≈ 138 days )
7. Pluto Retrogrades ( ≈ 159 days )
8. Neptune Retrogrades ( ≈ 158 days )
Here are some examples or Retrogrades:
Jupiter Retrograde
Venus Retrograde
Uranus Retrofrade
Mars Retrograde
Saturn Retrograde
Pluto Retrograde
Neptune Retrograde
Retrograde Planets█ OVERVIEW
Retrograde Planets is a TradingView script that highlights the retrograde cycles for all the planets including : Mercury, Venus, Mars, Jupiter, Saturn, etc etc..
A lot of Time-Theory/Gann traders use these cycles to gauge volatility and trend of the market. This script can highlight all the previous retrograde cycles of any planet of your choice.
The settings are easy and simple, you will just need to select the planet and activate it from the setting. And of course, you can change the color of the highlighted area.
Retrograde Planets can also project the future retrograde cycles and highlights them for you a year in advance ( 365 days ).
█ Future Plans and upgrades to this script may include :
1. Advance labeling.
2. Statistics box.
And more! Feel free to contact me with any feature that you would like to see in this script
█ How to use :
1. Open the settings.
2. Choose the planet.
3. Enable the Cycles using the checkbox.
Give the script a few seconds and you should be set.
This script is coded as an addon to the Gann ToolBox package/scripts.
