PresentTrend RMI Synergy - Strategy [presentTrading] █ Introduction and How it is Different
The "PresentTrend RMI Synergy Strategy" is the combined power of the Relative Momentum Index (RMI) and a custom presentTrend indicator. This strategy introduces a multifaceted approach, integrating momentum analysis with trend direction to offer traders a more nuanced and responsive trading mechanism.
BTCUSD 6h L/S Performance
Local
█ Strategy, How It Works: Detailed Explanation
The "PresentTrend RMI Synergy Strategy" intricately combines the Relative Momentum Index (RMI) and a custom SuperTrend indicator to create a powerful tool for traders.
🔶 Relative Momentum Index (RMI)
The RMI is a variation of the Relative Strength Index (RSI), but instead of using price closes against itself, it measures the momentum of up and down movements in price relative to previous prices over a given period. The RMI for a period length `N` is calculated as follows:
RMI = 100 - 100/ (1 + U/D)
where:
- `U` is the average upward price change over `N` periods,
- `D` is the average downward price change over `N` periods.
The RMI oscillates between 0 and 100, with higher values indicating stronger upward momentum and lower values suggesting stronger downward momentum.
RMI = 21
RMI = 42
For more information - RMI Trend Sync - Strategy :
🔶 presentTrend Indicator
The presentTrend indicator combines the Average True Range (ATR) with a moving average to determine trend direction and dynamic support or resistance levels. The presentTrend for a period length `M` and a multiplier `F` is defined as:
- Upper Band: MA + (ATR x F)
- Lower Band: MA - (ATR x F)
where:
- `MA` is the moving average of the close price over `M` periods,
- `ATR` is the Average True Range over the same period,
- `F` is the multiplier to adjust the sensitivity.
The trend direction switches when the price crosses the presentTrend bands, signaling potential entry or exit points.
presentTrend length = 3
presentTrend length = 10
For more information - PresentTrend - Strategy :
🔶 Strategy Logic
Entry Conditions:
- Long Entry: Triggered when the RMI exceeds a threshold, say 60, indicating a strong bullish momentum, and when the price is above the presentTrend, confirming an uptrend.
- Short Entry: Occurs when the RMI drops below a threshold, say 40, showing strong bearish momentum, and the price is below the present trend, indicating a downtrend.
Exit Conditions with Dynamic Trailing Stop:
- Long Exit: Initiated when the price crosses below the lower presentTrend band or when the RMI falls back towards a neutral level, suggesting a weakening of the bullish momentum.
- Short Exit: Executed when the price crosses above the upper presentTrend band or when the RMI rises towards a neutral level, indicating a reduction in bearish momentum.
Equations for Dynamic Trailing Stop:
- For Long Positions: The exit price is set at the lower SuperTrend band once the entry condition is met.
- For Short Positions: The exit price is determined by the upper SuperTrend band post-entry.
These dynamic trailing stops adjust as the market moves, providing a method to lock in profits while allowing room for the position to grow.
This strategy's strength lies in its dual analysis approach, leveraging RMI for momentum insights and presentTrend for trend direction and dynamic stops. This combination offers traders a robust framework to navigate various market conditions, aiming to capture trends early and exit positions strategically to maximize gains and minimize losses.
█ Trade Direction
The strategy provides flexibility in trade direction selection, offering "Long," "Short," or "Both" options to cater to different market conditions and trader preferences. This adaptability ensures that traders can align the strategy with their market outlook, risk tolerance, and trading goals.
█ Usage
To utilize the "PresentTrend RMI Synergy Strategy," traders should input their preferred settings in the Pine Script™ and apply the strategy to their charts. Monitoring RMI for momentum shifts and adjusting positions based on SuperTrend signals can optimize entry and exit points, enhancing potential returns while managing risk.
█ Default Settings
1. RMI Length: 21
The 21-period RMI length strikes a balance between capturing momentum and filtering out market noise, offering a medium-term outlook on market trends.
2. Super Trend Length: 7
A SuperTrend length of 7 periods is chosen for its responsiveness to price movements, providing a dynamic framework for trend identification without excessive sensitivity.
3. Super Trend Multiplier: 4.0
The multiplier of 4.0 for the SuperTrend indicator widens the trend bands, focusing on significant market moves and reducing the impact of minor fluctuations.
---
The "PresentTrend RMI Synergy Strategy" represents a significant step forward in trading strategy development, blending momentum and trend analysis in a unique way. By providing a detailed framework for understanding market dynamics, this strategy empowers traders to make more informed decisions.
Rmi

RMI Trend Sync - Strategy [presentTrading]█ Introduction and How It Is Different
The "RMI Trend Sync - Strategy " combines the strength of the Relative Momentum Index (RMI) with the dynamic nature of the Supertrend indicator. This strategy diverges from traditional methodologies by incorporating a dual analytical framework, leveraging both momentum and trend indicators to offer a more holistic market perspective. The integration of the RMI provides an enhanced understanding of market momentum, while the Super Trend indicator offers clear insights into the end of market trends, making this strategy particularly effective in diverse market conditions.
BTC 4h long/short performance
█ Strategy: How It Works - Detailed Explanation
- Understanding the Relative Momentum Index (RMI)
The Relative Momentum Index (RMI) is an adaptation of the traditional Relative Strength Index (RSI), designed to measure the momentum of price movements over a specified period. While RSI focuses on the speed and change of price movements, RMI incorporates the direction and magnitude of those movements, offering a more nuanced view of market momentum.
- Principle of RMI
Calculation Method: RMI is calculated by first determining the average gain and average loss over a given period (Length). It differs from RSI in that it uses the price change (close-to-close) rather than absolute gains or losses. The average gain is divided by the average loss, and this ratio is then normalized to fit within a 0-100 scale.
- Momentum Analysis in the Strategy
Thresholds for Decision Making: The strategy uses predetermined thresholds (pmom for positive momentum and nmom for negative momentum) to trigger trading decisions. When RMI crosses above the positive threshold and other conditions align (e.g., a bullish trend), it signals a potential long entry. Similarly, crossing below the negative threshold in a bearish trend may trigger a short entry.
- Super Trend and Trend Analysis
The Super Trend indicator is calculated based on a higher time frame, providing a broader view of the market trend. This indicator uses the Average True Range (ATR) to adapt to market volatility, making it an effective tool for identifying trend reversals.
The strategy employs a Volume Weighted Moving Average (VWMA) alongside the Super Trend, enhancing its capability to identify significant trend shifts.
ETH 4hr long/short performance
█ Trade Direction
The strategy offers flexibility in selecting the trading direction: long, short, or both. This versatility allows traders to adapt to their market outlook and risk tolerance, whether looking to capitalize on bullish trends, bearish trends, or a combination of both.
█ Usage
To effectively use the "RMI Trend Sync" strategy, traders should first set their preferred trading direction and adjust the RMI and Super Trend parameters according to their risk appetite and trading goals.
The strategy is designed to adapt to various market conditions, making it suitable for different asset classes and time frames.
█ Default Settings
RMI Settings: Length: 21, Positive Momentum Threshold: 70, Negative Momentum Threshold: 30
Super Trend Settings: Length: 10, Higher Time Frame: 480 minutes, Super Trend Factor: 3.5, MA Source: WMA
Visual Settings: Display Range MA: True, Bullish Color: #00bcd4, Bearish Color: #ff5252
Additional Settings: Band Length: 30, RWMA Length: 20

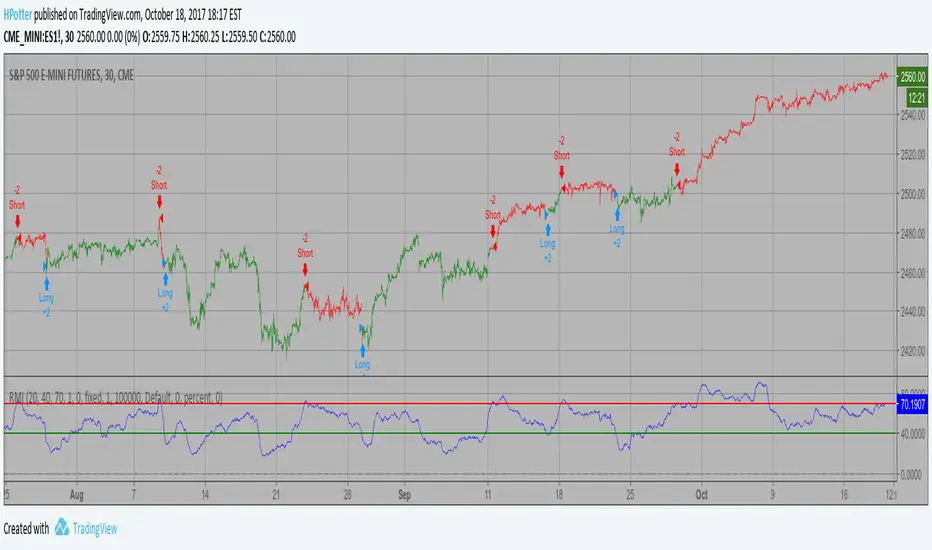
Combo Backtest 123 Reversal & Relative Momentum Index This is combo strategies for get a cumulative signal.
First strategy
This System was created from the Book "How I Tripled My Money In The
Futures Market" by Ulf Jensen, Page 183. This is reverse type of strategies.
The strategy buys at market, if close price is higher than the previous close
during 2 days and the meaning of 9-days Stochastic Slow Oscillator is lower than 50.
The strategy sells at market, if close price is lower than the previous close price
during 2 days and the meaning of 9-days Stochastic Fast Oscillator is higher than 50.
Second strategy
The Relative Momentum Index (RMI) was developed by Roger Altman. Impressed
with the Relative Strength Index's sensitivity to the number of look-back
periods, yet frustrated with it's inconsistent oscillation between defined
overbought and oversold levels, Mr. Altman added a momentum component to the RSI.
As mentioned, the RMI is a variation of the RSI indicator. Instead of counting
up and down days from close to close as the RSI does, the RMI counts up and down
days from the close relative to the close x-days ago where x is not necessarily
1 as required by the RSI). So as the name of the indicator reflects, "momentum" is
substituted for "strength".
WARNING:
- For purpose educate only
- This script to change bars colors.

Super Momentum StrategyThis is a strategy utilizing multiple of Evergets RMI (thanks to him for permission to publish) and a Chance Momentum.
It buys when 4 of the RMIs are below their thresholds and sells when they are above. There is a 5th one I added last night that works in Reverse - buy when its above and sell when below, which should work better for pyramiding strats by using it at the right rate to set the overall trend.
Very basic sample below, I could have set it up better as my example but just want to publish.

🐮 🆚 🐻 [Backtest]It's a remake of the previous script but for use in reverse positions at the same time.
In this script the reality could be even better than the Backtest, because, only close the position with profit, so profitability should be 100%, and Longs and Shorts don't mix because they are independent.
In real trade, you need an exchange that allows you to go in reverse positions at the same time or where you can have two independent sub-accounts: one for long and one for short and with margin trading. Although, if TP is small and does not mix with other inverse positions, it's not necessary. (With this script, you can go long and short at the same time and with independent configurations)
Settings for ETH at 5 minutes. (If you find good settings please comment)
Enjoy!

NOT-ONLY-SHORTThis script is the same as NOT-ONLY-LONG but without the security() function.
It use the following indicators: RMI + ADX + RSI + ICHIMOKU cloud only.
The fuchsia dot is the average price of the positions. The Take Profit is calculated from there.
It does not have Stop Loss, instead it makes a re-entry to try to improve the liquidation price.
Enjoy!

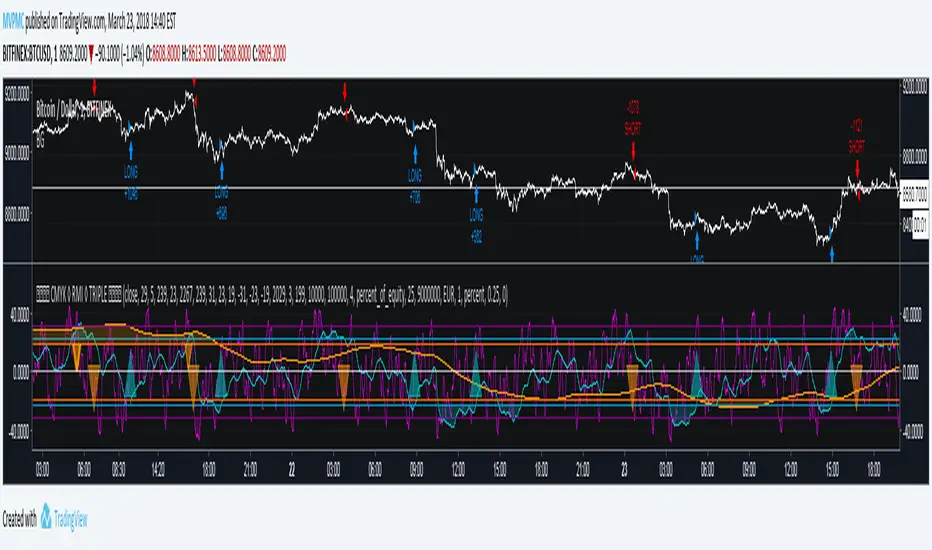
CMYK RMI TRIPLE◊ Introduction
This script makes use of three RMI's, to indicate Overbought/Oversold.
Adjustments can easily be made, through its settings or script.
◊ Origin
The Relative Momentum Index was developed by Roger Altman and was introduced in his article in the February, 1993 issue of Technical Analysis of Stocks & Commodities magazine.
While RSI counts up and down days from close to close, the Relative Momentum Index counts up and down days from the close relative to a close x number of days ago.
This results in an RSI that is smoother.
This is a part of Project XIAM.
◊ Theoretical Approach
Philosophy γ :: consequential
◊ Usage
You can use this as an indicator for manual trading, or apply AUTOTVIEW to automate your trading.
My advice is to combine this with another indicator before you do this.
The script is written in an organized and flexible manner to do this.
◊ Features
3 RMI's with seperately adjustable HIGH / LOW levels.
Trend adjustment on the SLOW RMI.
Adjustable Interval between entries / Once per dip-top entry.
Take Profit & Stop loss
◊ Community
Wanna share your findings ? or need help resolving a problem ?
CMYK :: discord.gg
AUTOVIEW :: discordapp.com
TRADINGVIEW UNOFFICIAL :: discord.gg
CMYK XIAM OPEN◊ Introduction
This is project XIAM, a work in progress.
Recently i came across the repainting problem.
Since then i haven't seen any bot-code that makes > 5% profit in two weeks with 0.25% fees/trade.
People who make good bots either bluff or don't share the code.
they let you rent it.
I aim to understand, learn it, write it myself. And share my findings with whoever shares with me.
◊ Origin
Based on RMI (RSI with momentum) and SMA, and values derived from those.
◊ Usage
Currently an investigative script.
◊ Theoretical Approaches
Philosophy α :: Cleansignal
:: Cleaning up the signal, from irregularities that cause unpredictable results.
Merging available tickers of a pair into one.
Merging available tickers of different coins into one in the correct proportion. (eg. Crypto market cap)
Removing Jitter, and smoothing signal without delay.
Philosophy β :: Rythmic
:: Syncing into the rythm's, to never miss the que, and trade on every theoretical low/high
Searching Amplitude, Period, Phase Shift, Frequency's of the carrier waves.
Marking Acrivity/inactivity of the carrier waves.
Partial Fractal repetition asses-able with above data?
Philosophy γ :: consequential
:: Seeking for Indicatory events and causal relations
Probability / reward.
Confirmation and culmination.
...
◊ Community
Wanna share your findings ? or need help resolving a problem ?
CMYK :: discord.gg
AUTOTVIEW :: discordapp.com

Relative Momentum Index Backtest The Relative Momentum Index (RMI) was developed by Roger Altman. Impressed
with the Relative Strength Index's sensitivity to the number of look-back
periods, yet frustrated with it's inconsistent oscillation between defined
overbought and oversold levels, Mr. Altman added a momentum component to the RSI.
As mentioned, the RMI is a variation of the RSI indicator. Instead of counting
up and down days from close to close as the RSI does, the RMI counts up and down
days from the close relative to the close x-days ago where x is not necessarily
1 as required by the RSI). So as the name of the indicator reflects, "momentum" is
substituted for "strength".
You can change long to short in the Input Settings
WARNING:
- For purpose educate only
- This script to change bars colors.