Rounded Grid Levels🟩 Rounded Grid Levels is a visual tool that helps traders quickly identify key psychological price levels on any chart. By dynamically adapting to the user's visible screen area, it provides consistent, easy-to-read round number grids that align with price action. The indicator offers a traditional visualization of horizontal round level grids, along with enhanced options such as tilted grids that align with market sentiment, and fan-shaped grids for alternative price interaction views. It serves purely as a visual aid, providing an adaptable way to observe rounded price levels without making predictions or generating trading signals.
⚡ OVERVIEW ⚡
The Rounded Grid Levels indicator is a visual tool designed to help traders identify and track price levels that may hold psychological significance, such as round numbers or significant milestones. These levels often serve as potential areas for price reactions, including support, resistance, or points of market interest. The indicator's gridlines are determined by user-defined settings and adjust dynamically based on the visible chart area, meaning they are influenced by the user's current zoom level and perspective. This behavior is similar to TradingView's built-in grid lines found in the chart settings canvas, which also adjust in real-time based on the visible screen, ensuring the most relevant price levels are displayed. By default, the indicator provides consistent gridlines to represent traditional round number levels, offering a straightforward view of key psychological areas. Additionally, users have access to experimental and novel configurations, such as fan-shaped layouts, which expand from a central point and adapt directionally based on user settings. This configuration can provide an alternate perspective for traders, especially useful in analyzing broader market moves and visualizing expansion relative to the current price.
Users can display the gridlines in a variety of configurations, including horizontal, neutral, auto, or fan-shaped layouts, depending on their preferred method of analysis. This flexibility allows traders to focus on different types of price action without overcrowding the visual representation of price movements.
This indicator is intended purely as a visual aid for understanding how price interacts with rounded levels over time. It does not generate predictive trading signals or recommendations but rather provides traders with a customizable framework to enhance their market analysis.
⭕ ROUND NUMBERS IN MARKET PSYCHOLOGY ⭕
Round numbers hold a significant place in financial markets, largely due to the psychological tendencies of traders and investors. These levels often represent areas of interest where human behavior, market biases, and trading strategies converge. Whether it's prices ending in 000, 500, or other recognizable values, these levels naturally attract more attention and influence decision-making.
Round numbers can act as key support or resistance levels and often become focal points in market activity. They are frequently highlighted by financial media, embedded in products like options, and serve as foundations for various trading theories. Their impact extends across different market participants and strategies, making them important focal points in both short-term and long-term market analysis.
Round numbers play an important role in guiding trader behavior and market activity. To better understand why these levels are so impactful, there are several key factors that highlight their significance in trading and price dynamics:
Psychological Impact : Humans naturally gravitate toward round numbers, such as prices ending in 000, 500, or 00. These levels tend to draw attention as traders perceive them as psychologically significant. This behavior is rooted in the cognitive bias known as "left-digit bias," where people assign greater importance to rounded, more recognizable numbers. In trading, this means that prices at these levels are more memorable and thus more likely to attract attention, creating an area where traders focus their buying or selling decisions.
Order Clustering : Traders often place buy and sell orders around these rounded levels, either manually or automatically through stop and limit orders. This clustering leads to the formation of visible support or resistance zones, as the concentrated orders tend to influence price behavior around these key levels. Market participants tend to converge their orders around these price points because of their perceived psychological importance, creating a liquidity pocket. As a result, these areas often act as barriers that the price either struggles to cross or uses as springboards for further movement.
External Influences : Financial media frequently highlights round-number milestones, amplifying market sentiment and drawing traders' attention to these levels. Additionally, algorithmic trading systems often react to round-number thresholds, which can further reinforce price movements, creating self-reinforcing reactions at these levels. As media and analysts emphasize these milestones, more traders pay attention to them, leading to increased volume and often heightened volatility at those points. This self-reinforcing cycle makes round numbers an area where price movement can either accelerate due to a breakout or stall because of clustering interest.
Option Strike Prices : Options contracts typically have strike prices set at round numbers, and as expiration approaches, these levels can influence the price of the underlying asset due to concentrated trading activity. The behavior around these levels, often called "pinning," happens because traders adjust their positions to avoid unfavorable scenarios at these key strikes. This activity tends to concentrate price movement toward these levels as traders hedge their positions, leading to increased liquidity and the potential for abrupt price reactions near option expiration dates.
Whole Number Theory : This theory suggests that whole numbers act as natural psychological barriers, where traders tend to make decisions, place orders, or expect price reactions, making these levels crucial for analysis. Whole numbers are simple to remember and are often used as informal targets for profit-taking or stop placement. This behavior leads to a natural ebb and flow around these levels, where the market finds equilibrium temporarily before deciding on a future direction. Whole numbers tend to work like magnets, drawing price to them and often creating reactions that are visible across different timeframes.
Quarters Theory : Commonly used in Forex markets, this theory focuses on quarter-point increments (e.g., 1.0000, 1.2500, 1.5000) as key levels where price often pauses or reverses. These quarter levels are treated as important psychological barriers, with price frequently interacting at these intervals. Traders use these points to gauge market strength or weakness because quarter levels divide larger round-number ranges into more manageable and meaningful segments. For example, in highly traded forex pairs like EUR/USD, traders might treat 1.2500 as a significant barrier because it represents a halfway point between 1.0000 and 1.5000, offering a balanced reference point for decision-making.
Big Round Numbers : Major round numbers, such as 100, 500, or 1000, often attract significant attention and serve as psychological thresholds. Traders anticipate strong reactions when prices approach or cross these levels. This is often because large round numbers symbolize major milestones, and price behavior around them tends to signal important market sentiment shifts. When price crosses a major level, such as a stock moving above $100 or Bitcoin crossing $50,000, it often creates a surge in trading activity as it is viewed as a validation or invalidation of market trends, drawing in momentum traders and triggering both retail and institutional responses.
By visualizing these round levels on the chart, the Rounded Grid Levels indicator helps traders identify areas where price may pause, reverse, or gain momentum. While round numbers provide useful insights, they should be used in conjunction with other technical analysis tools for a comprehensive trading strategy.
🛠️ CONFIGURATION AND SETTINGS 🛠️
The Rounded Grid Levels indicator offers a variety of configurable settings to tailor the visualization according to individual trader preferences. Below are the key settings available for customization:
Custom Settings
Rounding Step : The Rounding Step parameter sets the minimum interval between gridlines. This value determines how closely spaced the rounded levels are on the chart. For example, if the Rounding Step is set to 100, gridlines will be displayed at every 100 points (e.g., $100, $200, $300) relative to the current price level. The Rounding Step is scaled to the chart's visible area, meaning users should adjust it appropriately for different assets to ensure effective visualization. Lower values provide a more granular view, while larger values give a broader, higher-level perspective.
Major Grids : Defines the interval at which major gridlines will appear compared to minor ones. For example, if the Rounding Step is 100 and Major Grids is set to 10, major gridlines will be displayed every $1,000, while minor gridlines will be at every $100. This distinction allows traders to better visualize key psychological levels by emphasizing significant price intervals.
Direction : Users can select the gridline direction, choosing between options such as 'Up', 'Down', 'Auto', or 'Neutral'. This setting controls how the gridlines extend relative to the current price level, which can help in analyzing directional trends.
Neutral Direction : This option provides balanced gridlines both above and below the current price, allowing traders to visualize support and resistance levels symmetrically. This is useful for analyzing sideways or ranging markets without directional bias.
Up Direction : The gridlines are tilted upwards, starting from visible lows and extending toward the rounded level at the current price. By choosing Up , traders emphasize an upward sentiment, visualizing price action that aligns with rising trends. This option helps illustrate potential areas where pullbacks may occur, as well as how price might expand upwards in the current market context.
Down Direction : The gridlines are tilted downwards, starting from visible highs and extending toward the rounded level at the current price. Selecting Down allows traders to emphasize a downward sentiment, visualizing how price may expand downwards, which is particularly useful when analyzing downtrends or potential correction levels. The gridlines provide an illustrative view of how price interacts with lower levels during market declines.
Auto Direction : The gridlines automatically adjust their direction based on recent market trends. This adaptive option allows traders to visualize gridlines that dynamically change according to price action, making it suitable for evolving market conditions where the direction is uncertain. It’s useful for traders looking for an indicator that moves in sync with market shifts and doesn’t require manual adjustment.
Grid Type : Allows users to choose between 'Linear' or 'Fan' grid types. The Linear type creates evenly spaced gridlines that can be either horizontal or tilted, depending on the chosen direction setting, providing a straightforward view of price levels. The Fan type radiates lines from a central point, offering a more dynamic perspective for analyzing price expansions relative to the current price. These grid types introduce experimental visualizations influenced by chart properties, including visible highs, lows, and the current price. Regardless of the configuration, the gridlines will always end at the current bar, which represents a rounded price level, ensuring consistency in how key price areas are displayed.
Extend : This setting allows gridlines to be projected into the future, helping traders see potential levels beyond the current bar. When enabled, the behavior of the extended lines varies based on the selected grid type and direction. For Neutral and Horizontal Linear settings, the extended gridlines maintain their round-number alignment indefinitely. However, for Up , Down , or Auto directions, the angle of the extended gridlines can change dynamically based on the chart’s visible high and low or the latest price action. As a result, extended lines may not continue to align with round-number levels beyond the current bar, reflecting instead the current trend and sentiment of the market. Regardless of direction, extended gridlines remain consistently spaced and either parallel or evenly distributed, ensuring a structured visual representation.
Color Settings : Users can customize the colors for resistance, support, and minor gridlines at the current price. This helps in visually distinguishing between different grid types and their significance on the chart.
Color Options
These configuration options make the Rounded Grid Levels indicator a versatile tool for traders looking to customize their charts based on their personal trading strategies and analytical preferences.
🖼️ CHART EXAMPLES 🖼️
The following chart examples illustrate different configurations available in the Rounded Grid Levels indicator. These examples show how variations in grid type, direction, and rounding step settings impact the visualization of price levels. Traders may find that smaller rounding steps are more effective on lower time frames, where precision is key, whereas larger rounding steps help to reduce clutter and highlight key levels on higher time frames. Each image includes a caption to explain the specific configuration used, helping users better understand how to apply these settings in different market conditions.
Smaller Rounding Step (100) : With a smaller rounding step, the gridlines are spaced closely together. This setting is particularly useful for lower time frames where price action is more granular and finer details are needed. It allows traders to track price interactions at narrower levels, but on higher time frames, it may lead to clutter and exceed Pine Script's 500-line limit.
Larger Rounding Step (1000) : With a larger rounding step, the gridlines are spaced farther apart. This visualization is better suited for higher time frames or broader market overviews, allowing users to focus on major psychological levels without overloading the chart. On lower time frames, this may result in fewer actionable levels, but it helps in maintaining clarity and staying within Pine Script's line limit.
Linear Grid Type, Neutral Direction (Traditional Rounded Price Levels) : The Linear gridlines are displayed in a neutral fashion, representing traditional round-number levels with consistent spacing above and below the current price. This layout helps visualize key psychological price levels over time in a straightforward manner.
Linear Grid Type, Down Direction : The Linear gridlines are tilted downwards, remaining parallel and ending at the rounded level at the current price. This setup emphasizes downward market sentiment, allowing traders to visualize price expansion towards lower levels, which is useful when analyzing downtrends or potential correction levels.
Linear Grid Type, Down Direction : The Linear gridlines are tilted downwards, extending from the current price to lower levels. Useful for observing downtrending price movements and visualizing pullback areas during uptrends.
Linear Grid Type, Auto Direction : The Linear gridlines adjust dynamically, tilting either upwards or downwards to align with recent price trends, remaining parallel and ending at the rounded level at the current price. This configuration reflects the current market sentiment and offers traders a flexible way to observe price dynamics as they develop in real time.
Fan Grid Type, Neutral Direction : The fan-shaped gridlines radiate symmetrically from a central point, ending at the rounded level at the current price. This configuration provides an unbiased view of price action, giving traders a balanced visualization of rounded levels without directional influence.
Fan Grid Type, Up Direction : The fan-shaped gridlines originate from lower visible price points and radiate upwards, ending at the rounded level at the current price. This layout helps visualize potential price expansion to higher levels, offering insights into upward momentum while maintaining a dynamic and evolving perspective on market conditions.
Fan Grid Type, Down Direction : The fan-shaped gridlines originate from higher visible price points and radiate downwards, ending at the rounded level at the current price. This setup is particularly useful for observing potential price expansion towards lower levels, illustrating areas where the price might extend during a downtrend.
Fan Grid Type, Auto Direction : The fan-shaped gridlines dynamically adjust, originating from visible chart points based on the current market trend, and radiate outward, ending at the rounded level at the current price. This adaptive visualization offers a continuously evolving representation that aligns with changing market sentiment, helping traders assess price expansion dynamically.
📊 SUMMARY 📊
The Rounded Grid Levels indicator helps traders highlight important round-number price levels on their charts, providing a dynamic way to visualize these psychological areas. With customizable gridline options—including traditional, tilted, and fan-shaped styles—users can adapt the indicator to suit their analysis needs. The gridlines adjust with chart zoom or scale, offering a flexible tool for observing price action, without providing specific trading signals or predictions.
⚙️ COMPATIBILITY AND LIMITATIONS ⚙️
Asset Compatibility :
The Rounded Grid Levels indicator is compatible with all asset classes, including cryptocurrencies, forex, stocks, and commodities. Users should adjust both the Rounding Step and the Major Grid settings to ensure the correct scale is used for the specific asset. This adjustment ensures that the most relevant round price levels are displayed effectively regardless of the instrument being analyzed. For instance, when analyzing BTCUSD, a higher Rounding Step may be needed compared to forex pairs like EURUSD, and the Major Grid value should also be adjusted to appropriately emphasize significant levels.
Line Limitations in Pine Script :
The Rounded Grid Levels indicator is subject to Pine Script's 500-line limit. This means that it cannot draw more than 500 gridlines on the chart at any given time. The number of gridlines depends directly on the chosen Rounding Step . If the steps are too small, the gridlines will be spaced too closely, causing the indicator to quickly reach the line limit. For example, if Ethereum is trading around $2,500, a Rounding Step of 100 might be appropriate, but a step of 1.00 would create too many gridlines, exceeding Pine Script's limit. Users should consider appropriate settings to avoid running into this constraint.
Runtime Error Considerations
When using the Rounded Grid Levels indicator, users might encounter a runtime error in specific scenarios. This typically happens if the Rounding Step is set too small, causing the indicator to exceed Pine Script's line limit or take too long to process. This can often occur when switching between charts that have significantly different price ranges. Since the Rounding Step requires flexibility to work with a wide variety of assets—ranging from decimals to thousands—it is not practically limited within the script itself. If a runtime error occurs, the recommended solution is to increase the Rounding Step to a larger value that better matches the current asset's price range.
Runtime Error: If the Rounding Step is too small for the current asset or chart, the indicator may generate a runtime error. Users should increase the Rounding Step to ensure proper visualization.
⚠️ DISCLAIMER ⚠️
The Rounded Grid Levels indicator is not designed as a predictive tool. While it extends gridlines into the future, this extension is purely for visual continuity and does not imply any forecast of future price movements. The primary function of this indicator is to help users visualize significant round number price levels.
The gridlines adjust dynamically based on the visible chart range, ensuring that the most relevant round price levels are displayed. This behavior allows the indicator to adapt to your current view of the market, but it should not be used to predict price movements. The indicator is intended as a visual aid and should be used alongside other tools in a comprehensive market analysis approach.
While gridlines may align with significant price levels in hindsight, they should not be interpreted as indicators of future price movements. Traders are encouraged to adjust settings based on their strategy and market conditions.
🧠 BEYOND THE CODE 🧠
The Rounded Grid Levels indicator, like other xxattaxx indicators , is designed with education and community collaboration in mind. Its open-source nature encourages exploration, experimentation, and the development of new grid calculation indicators, drawings, and strategies. We hope this indicator serves as a framework and a starting point for future innovations in grid trading.
Your comments, suggestions, and discussions are invaluable in shaping the future of this project. We actively encourage your feedback and contributions, which will directly help us refine and improve the Rounded Grid Levels indicator. We look forward to seeing the creative ways in which you use and enhance this tool.
Roundnumbers

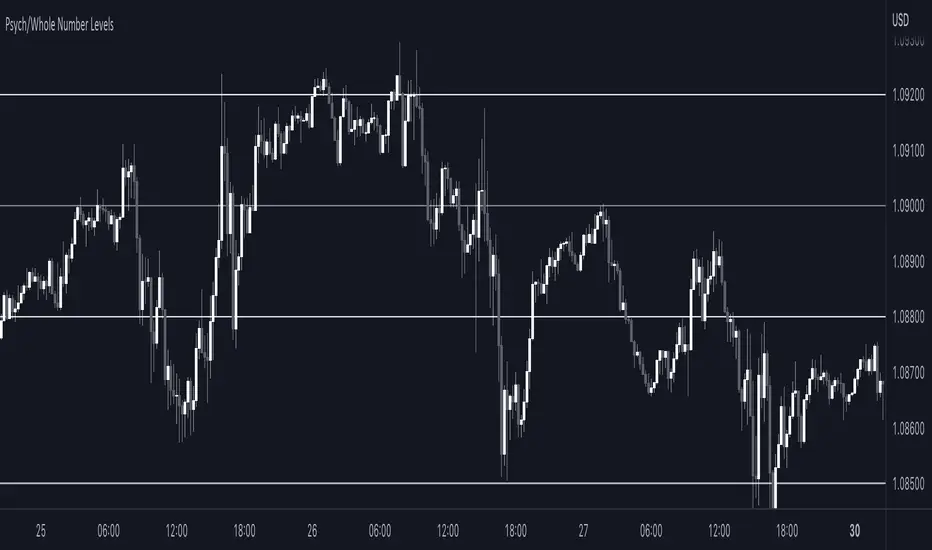
Sonarlab - Psych/Whole Number Levels Have you ever noticed that prices seem to stick to certain “round numbers” like $1250, $1300, or $1350? It’s not just your imagination — these round numbers can actually act as psychological levels in the market, influencing trader behavior and shaping price action.
But why do traders care so much about these round numbers? It all comes down to our psychological wiring. Humans are naturally drawn to symmetry and simplicity, and round numbers offer a nice, neat way to measure price levels. Plus, these levels often coincide with important milestones or historical levels of support and resistance, giving them even more psychological weight.
To help you take advantage of these psychological levels in your trading, we’ve created a free TradingView indicator that automatically plots round numbers on your chart. Whether you’re a seasoned trader or just starting out, this indicator can give you a valuable edge in the market.
Here’s how the Indicator works:
1. Install the indicator on your TradingView chart. You can find it in the public library by searching for “Round Numbers Indicator”.
2. Select your preferred round numbers and customize the appearance of the indicator to fit your chart. The default settings are already set good.
3. Watch as the round numbers dynamically adjust to the current price action, providing you with a clear view of the market’s psychological levels.
Round Numbers Breakouts Smart Formula Signals and AlertsThis indicator uses Round Numbers breakouts and then uses smart formula with the near Round Numbers to determine best TP (take profit)/SL (stop loss) areas. Furthermore, it calculates win percentage, shows in-profit/in-loss peaks and the price amount result over a customizable date range, which when combined well with the smart formula provides decent profitable outcome. I have decided to write my own backtesting engine as the integrated TradingView strategy one has limitations and has shown inconsistencies when compared to manual backtesting…
There are many settings you can manually change to trade any instrument, any style, any approach and there are presets included for Bitcoin(BTCUSD), FOREX(EURUSD), SPY(S&P500), so you can start trading immediately! Alerts correspond to indicator settings and are turned on with a few clicks. There are 3 tables (each can be shown/hidden) showing everything you need to see/know to calibrate the indicator as you wish.
Labels, lines, tables explanations (everything can be hidden/shown):
- LONG Labels: medium-green: position open, dark-green: SL, bright-green: TP, blue: TP2
- SHORT Labels: medium-red: position open, dark-red: SL, bright-red: TP, purple: TP2
- Gray circles: position entry area | Yellow crosses: SL area
- Green line: Long TP1, Blue line: Long TP2 | Red Line: Short TP1, Purple line: Short TP2
- Grey lines: Round Numbers (customized via “Round Number up/down measure unit” input)
- Yellow labels at end of each week: end of week OVERALL total results
- Red colored background: power segment
- 3 tables: 1) INFO | STATS, 2) SPY Options Calculator, 3) Indicator Settings
If you decide to fully customize the indicator yourself, on the very top - under “PRESETS” select “MANUAL”! NOTE: If you select any of the pre-set presets, only GLOBAL settings can be changed, the rest of the settings will be “frozen” until you switch it to “MANUAL”!
- Global Settings are self-explanatory and mainly observational, show/hide, etc.
- Manual TP2 (Multi-Take-Profit) Settings:
>>>>> Include TP2 System? Turn on/off multi-profit system, with this unchecked, every trade will either end with SL or with TP1.
>>>>> TP2 System: NEAREST/FORMULA, NEAREST – after TP1 is taken > next TP2 will be a round number price target nearest to where TP1 was taken (sometimes it can be very near, sometimes further away…), FORMULA – 2nd round number price target will be optimally selected based on the distance behind and ahead of TP1 area. For TP2 – FORMULA would be the most logical choice as with multi-take-profit setting turned on – you’d want to ride it out as far as possible.
>>>>> TP1/TP2 division type: 1) Each price target (TP1, TP2) will be ½ of the position 2) TP1 will be 2/3 of the position and TP2 will be the remaining 1/3.
>>>>> TP2 hit type: “close” > candle has to close on top/crossing the price target line, “touch” > once candle touches the price target – you will be immediately alerted to take the partial profit (if you will use such setting – you will need to take the partial profits as soon as you receive the alert.
>>>>> TP1 > Back to Entry hit type: similar to TP2, “close” > candle close, “touch” > candle touch. Please note: this is a very tricky setting as if you use “close” option – your profitable trade may become a loss if a huge candle will close against your position eliminating your TP1 profit, however often the price will touch and cross the entry area to only bounce and continue with your position direction for even bigger profits… so experiment with the date range results to see what works best for your instrument/setting/strategy.
>>>>> TP2 count towards trades count: this can be a bit confusing, but it is simply how should TP2 be treated towards trades count. The indicator will show you Win Percentage and Win % is obtained from winning trades count divided by total trades count. While TP2 is not “a new trade”, it expands the profit of the trade. This is an experimental setting to count TP2 as the whole winning trade, ½ of a trade, or not count it at all.
- Manual Signals/TP1 Settings:
>>>>> TP1/TP2 offset: this one is really cool, with this feature you can hunt these conditions when the price comes very near the profit target area, but never touches it. With this setting turned on and with a good offset amount – you will be able to catch these for TP1 and TP2!
>>>>> TP1/TP2 offset amount: just what the title says, please be careful with this as this number varies significantly depending on the instrument you will be trading. Examples: 1) For SPY 0.1 would be $0.10 offset - if TP1 is $400 and price hits $399.90 > TP1 considered taken/signal shown/alert) | 2) For EURUSD, it is very different and if wrong will show TP1 immediately at position open, typical good offset for EURUSD is: 0.0005 | 3) For BTCUSD, 10 - $10 offset, if TP is $15,000 > $14,990, etc.
>>>>> Round Number up/down measure unit (in dollars $): this one is very important if you will be using “MANUAL” selection to build your own setup as it is very different for every instrument. For SPY, round numbers are single dollars or even half-dollar 50 cent numbers: 1 or 0.5 (350, 351, 352, etc. or 350.50, 351, 351.50, 352, etc.), while for Bitcoin (BTCUSD) a single unit ($1) is too small to be a round number as Bitoin moves much faster and wider every second and it would have to be at least 50 ($50) to make sense. Similar for FOREX (EUR/USD) a single 1 unit ($1) will be too big as EURUSD will never move a whole $1 in 15 minutes or even a day.. and would have to be something like 1.05500. You can easily determine if this number makes sense for your instrument by observing the grey Round Number lines which will correspond based on this setting. You can also visually observer if the price of the instrument appreciates these round numbers.
>>>>> Close Position Before Market Closes: just what the title says. Indicator will close the position 15 minutes before market closes (US session), update backtesting stats, alert you.
>>>>> Close Position Before Power Hour: 3PM – 4PM ET is the last hour of US trading session, where sudden move in any direction can happen with huge volatility, while sometimes nothing will happen at all… Many try to avoid it, so if you wish to avoid it as well - turn this on and it will alert you to close your positions 15 minutes before Power Hour starts, backtesting/stats will be adjusted accordingly.
>>>>> Skip OVERSIZED candles in signals: turn on this setting to skip signals, which happen to fall on big candles. This is basically a protection from huge volatility moves, which usually happen during financial news/events and if you are not a fan of these – you can set this option for indicator to not open anything based on the candle size.
>>>>> Color OVERSIZED candles: this will help you calibrate the size of the OVERSIZED candles if you decide to use this setting and overall visually see them.
>>>>> OVERSIZED candle size: OVERSIZED candle size must be input as it varies significantly. Please note: for each instrument – the size number is completely different, as for SPY: 2 would mean any candle bigger than $2 distance will be considered OVERSIZED, for Bitcoin it would have to be several hundred dollars, like 400-500. For FOREX, this would have to be a decimal, for EURUSD something like 0.0005. It’s best to experiment visually with this setting depending on the instrument you will be trading while setting up the size. To see a typical huge unusual candle – look up financial calendar for something like FOMC meeting, then measure the candle input it into this setting.
>>>>> OVERSIZED candle size calculation type: this is just more flexibility for your preference. If you wish to calculate the size of the candle based on the open/close – select “BODY”, if you wish to use high/low – select “STICKS (from tip to tip)”. Hard to say which one is better, so it is up to you to decide.
>>>>> Include EMA in signal formula: LONG signals will only be shown only if above EMA, SHORT if below EMA. EMA length is of course customizable in below.
>>>>> Skip opposite candle types in signals: signals where the candle color confirms the direction of the trade, but the candle type is opposite (like a green colored bearish hammer for example) will be avoided (such candles can be very uncertain/deceptive).
>>>>> Skip doji: signals where the signal candle is doji (uncertain) will be avoided.
>>>>> TP1 hit type/system: same thing as TP2 hit type/system.
>>>>> SL hit type/system: same as TP1 and TP2 types/systems.
>>>>> Intraday Session Signals Active Time in ET: time range during the day when indicator will show signals (open trades, alert you, etc.). This is specifically for intraday trading. You can turn it off completely by selecting a BLANK option.
>>>>> Intraday TP/SL Active Time in ET: same as above, but for taking profits/stop losses.
*** To add the alerts
-Right-click anywhere on the TradingView chart
-Click on Add alert
-Condition: Select this indicator by it’s name
-Alert name: Whatever you want
-Hit “Create”
-Note: If you change ANY Settings within the indicator – you must DELETE the current alert and create a new one per steps above, otherwise it will continue triggering alerts per old Settings!
If you wish to try this out for a week or so – please write me directly and I will give you access.

Quarter Theory LevelsQuarter Theory Levels is a script that will create level lines based on major round numbers and spilt those levels into half and quarter ranges. This tool is intended to help traders see major levels that price will likely react to in the future.
The Script is inspired by Quarters Theory.

Round Number LevelsQuick Script to mark out round number levels. These levels often become reversal points or where the next price range will develop. This script is intended to be a tool to aid along with additional trading strategies.

[DisDev] 12 Candle|Round#|Future SessionsThis indicator has many components; below, each component is explained and how it can be used as a trading tool.
1) Future Lines
a. Vertical lines are projected into the future to mark the beginning of each of the three major markets, Tokyo, London, and New York.
b. When major markets open, this can cause an increase in price action. So this component provides the trader with a reminder of when the next major market opens.
c. Also, the days of the week are displayed to allow the user to backtest price reaction for certain days of the week easily (e.g., Major Markets reopening after the weekend).
2) 12 Hour Candle Sessions High and Low
a. As price intersects with the beginning of the session, the vertical line disappears, and two corresponding horizontal lines begin. These horizontal lines dynamically adjust to mark each session's high and low, and a semi-transparent box fills the space between the high and low lines.
b. The duration of each session is a three-hour window, which each consists of 12 Fifteen-Minute Candles. This marks the hour prior to equity markets open, the opening hour, and the post-open hour.
c. The sessions highs and lows can be selected within the settings show for a 24 hour period. This assists the trader with session range breakouts; three examples of how this could be traded are below.
Example 1
d. The Tokyo and London session high kept the price action within a range. Once it broke the range, the Tokyo and London session highs were used as support, resulting in a range breakout.
Example 2
e. The below picture shows price action failing to break London Session Low and New York Session High; this is followed by Tokyo Low acting as resistance and price moving down 9%.
Example 3
f. Below price action with an increased volume of 323% (based on the average of the last 10 bar) fails to break the Tokyo High on the 1st attempt. The second attempt fails on 241% volume. The third attempt at 475% breaks the range, completing the range breakout seeing a move of 3.4% in price.
4) High of Day (HOD) and Low of Day (LOD)
a. As the trading day unfolds, we mark the HOD (d-High) and LOD (d-Low) with blue dotted horizontal lines. Then at the start of the next trading day, the former High and Low become the Previous Day High (pd-High) and Low (pd-Low) and are changed to dashes.
b. These high and low levels add extra confluence with the session high and lows for Swing Failure Patterns (SFP) and confirmation of trends.
5) Round Numbers
a. As humans, it's hard to use just any number to make sense of things. We prefer to use round numbers. This is important for trading as many traders will automatically use round numbers as their stop losses.
b. This indicator component reminds users of this fact and displays round numbers such as 00, 25, 50, and 75. The indicator automatically calculates and displays lines for the round numbers for as many as twelve levels above and below the current price.
c. Below are examples of how round numbers are broken to trigger stop losses; you may want to break the habit of using round numbers as your stop losses.
Below is the indicator in full swing, displaying all the elements described above.

Kilted Round NumbersKILTED ROUND NUMBERS v1.0
Description: This is a simple indicator that calls out the psychological round numbers that the market gravitates towards. Lines in BLUE are SUPPORT as they will be below the current price and lines in RED are above the current price and represent resistance.
This should assist traders with key levels that once drawn assist the eye with seeing those key levels and how price reacts to the respective levels.
SETTINGS AND EXPLANATION
General Settings
- Kilted Round Numbers Main Levels – This will highlight the main levels above and below the current price
- Kilted Round Numbers Sub Levels – This will highlight the number of levels you want to see within the main levels
- Only Show Dane Sub Levels – This feature is a work in progress and will highlight certain levels only as part of a separate strategy and will be available in due course in v2.0
If you need access to any of our indicators please use the link below to obtain access to this indicator or send us a private message on trading view.

Proper Round Functions [QuantNomad]Round function in PineScript is very simple and allows you to round numbers only to the closest integer number. This is a bit irritating because I very often have to round numbers to some decimal places and not integer.
So I created 2 functions I use all the time and now sharing them with you.
roundn - rounds the values in its first argument to the specified number of decimal places.
roundtick - rounds the values to current symbol mintick
I hope they will be useful for you.
