RSI Deviate 1.3Use 1
Buy=blue pin
Sell=red pin
Use 2
Buy= blue line above the red line
Sell=red line above the blue line
Use 3
Buy=blue line crosses any black line from bottom to top
Sell=blue line crosses any black line from top to bottom
Rsistoch

RSI Cryptomars short-line helper 1.2This is an aid for assisting Cryptomars indicator trading. When the Cryptomars indicator signals, you can use it as a judgment as to whether or not to trade, or you can trade ahead of its signal.
Its recommended chart level is 5m
Its use is very simple:
BUY= signal > D or signal > D2
SELL= signal < D or signal < D2
When the signal passes through D or D2 from bottom to top and the signal shows a form of walking up, we buy
When the signal passes through D or D2 from top to bottom and the signal appears to be walking down, we sell
If you want more information, there is a signal signal 2 in my indicator, you can adjust its color to red, when signal > signal 2, it is a buy form, when signal < signal 2, it is for sale Form,

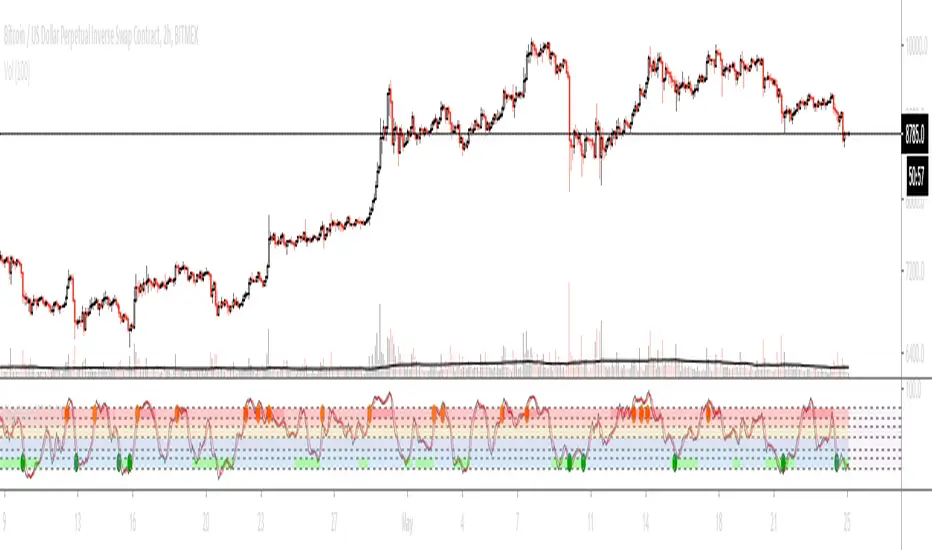
Slow Stochastic + ADX exhaustationSlow stochastic with ADX exhaustation and sell/entry points as orange/green circles.
This is a script I remade from Marco Valente's "RSI Combo" and Oshri17 "Slow stochastic".
Credits and thanks to them for sharing, I just expanded the diversity ^^
Hope you enjoy phit! ;D
RSI + StochasticRSI overbought and oversold histogram
Just indicator combo of oldschool slow stochastic and rsi, just looking a little bit better for someone.
Strategy is simple:
1) RSI is overbought or oversold (above 70, below 30)?
2) Stochastic line crosses its ema?
3) Stochastic and stochastic ema are in overbought = sell, oversold = buy.
Works good in volitile stocks/pairs and suits for fast scalping timeframes 1m 5m 15m
Strategy is old as the books, this is just a better visual for it.
