RSI Divergence Screener [Pineify]RSI Divergence Screener
Key Features
Multi-symbol and multi-timeframe support for advanced market screening.
Real-time detection and visualization of bullish and bearish RSI divergences.
Seamless integration with core technical indicators and custom divergences.
Highly customizable parameters for precise adaptation to personal trading strategies.
Comprehensive screener table for swift asset comparison and analysis.
How It Works
The RSI Divergence Screener leverages the power of Relative Strength Index (RSI) to systematically track momentum shifts across cryptocurrencies and their respective timeframes. By monitoring both fast and slow RSI calculations, the screener isolates divergence signals—key reversal points that often precede major price moves.
The indicator calculates two RSI values for each selected asset: one with a short lookback (Fast RSI) and another with a longer period (Slow RSI).
It runs a comparative algorithm to find divergences—whenever Fast RSI deviates significantly from Slow RSI, it flags the signal as bullish or bearish.
All detected divergences are dynamically presented in a table view, allowing traders to scan symbols and timeframes for optimal trading setups.
Trading Ideas and Insights
Spot early momentum reversals and preempt major price swings via divergence signals.
Combine multiple symbols and timeframes for cross-market trending opportunities.
Identify high-probability scalping and swing trading setups informed by RSI divergence logic.
Quickly compare crypto asset strength and trend exhaustion across short and long-term horizons.
How Multiple Indicators Work Together
This screener’s edge lies in its synergistic use of multi-setting RSI calculations and customizable input groups.
The dual-RSI approach (Fast vs. Slow) isolates subtle trend shifts missed by traditional single-period RSI.
Safe and reliable divergences arise only when the mathematical difference between Fast RSI and Slow RSI meets predefined thresholds, minimizing false positives.
Divergences are contextualized using tailored color codes and backgrounds, rendering insights immediately actionable.
You can expand analysis with additional moving average filters or overlays for further confirmation.
Unique Aspects
First-of-its-kind screener dedicated solely to RSI divergence, designed especially for crypto volatility.
Efficient screening of up to eight assets and multiple timeframes in one compact dashboard.
Intuitive iconography, color logic, and table layouts optimized for rapid decision-making.
Advanced input group design for fine-tuning indicator settings per symbol, timeframe, and source.
How to Use
Select up to eight cryptocurrency symbols to screen for divergence signals.
Assign individual timeframes and source prices for each asset to customize analysis.
Set Fast RSI and Slow RSI lengths according to your preferred strategy (e.g., scalping, swing, or trend following).
Review the screener table: colored cells highlight actionable bullish (green) and bearish (red) divergences.
Confirm trade setups with additional indicators or price action for robust risk management.
Customization
Symbols: Choose any crypto pair or ticker for dynamic divergence tracking.
Timeframes: Scan across 1m, 5m, 10m, 30m, and more for full market coverage.
RSI lengths: Configure Fast and Slow RSI periods based on volatility and trading style.
Visuals: Tailor table colors, fonts, and alert backgrounds per your preference.
Conclusion
The RSI Divergence Screener is a versatile, original TradingView indicator that empowers traders to scan, compare, and act on divergence signals with speed and precision. Its multi-symbol design, robust logic, and extensive customization options set a new standard for market screening tools. Integrate it into your crypto trading process to capture actionable opportunities ahead of the crowd and optimize your technical analysis workflow.
Screeners

Screener based on Profitunity strategy for multiple timeframes
Screener based on Profitunity strategy by Bill Williams for multiple timeframes (max 5, including chart timeframe) and customizable symbol list. The screener analyzes the Alligator and Awesome Oscillator indicators, Divergent bars and high volume bars.
The maximum allowed number of requests (symbols and timeframes) is limited to 40 requests, for example, for 10 symbols by 4 requests of different timeframes. Therefore, the indicator automatically limits the number of displayed symbols depending on the number of timeframes for each symbol, if there are more symbols than are displayed in the screener table, then the ordinal numbers are displayed to the left of the symbols, in this case you can display the next group of symbols by increasing the value by 1 in the "Show tickers from" field, if the "Group" field is enabled, or specify the symbol number by 1 more than the last symbol in the screener table. 👀 When timeframe filtering is applied, the screener table displays only the columns of those timeframes for which the filtering value is selected, which allows displaying more symbols.
For each timeframe, in the "TIMEFRAMES > Prev" field, you can enable the display of data for the previous bar relative to the last (current) one, if the market is open for the requested symbol. In the "TIMEFRAMES > Y" field, you can enable filtering depending on the location of the last five bars relative to the Alligator indicator lines, which are designated by special symbols in the screener table:
⬆️ — if the Alligator is open upwards (Lips > Teeth > Jaw) and none of the bars is closed below the Lips line;
↗️ — if one of the bars, except for the penultimate one, is closed below Lips, or two bars, except for the last one, are closed below Lips, or the Alligator is open upwards only below four bars, but none of the bars is closed below Lips;
⬇️ — if the Alligator is open downwards (Lips < Teeth < Jaw), but none of the bars is closed above Lips;
↘️ — if one of the bars, except the penultimate one, is closed above the Lips, or two bars, except the last one, are closed above the Lips, or the Alligator is open down only above four bars, but none of the bars are closed above the Lips;
➡️ — in other cases, including when the Alligator lines intersect and one of the bars is closed behind the Lips line or two bars intersect one of the Alligator lines.
In the "TIMEFRAMES > Show bar change value for TF" field, you can add a column to the right of the selected timeframe column with the percentage change between the closing price of the last bar (current) and the closing price of the previous bar ((close – previous close) / previous close * 100). Depending on the percentage value, the background color of the screener table cell will change: dark red if <= -3%; red if <= -2%, light red if <= -0.5%; dark green if >= 3%; green if >= 2%; light green if >= 0.5%.
For each timeframe, the screener table displays the symbol of the latest (current) bar, depending on the closing price relative to the bar's midpoint ((high + low) / 2) and its location relative to the Alligator indicator lines: ⎾ — the bar's closing price is above its midpoint; ⎿ — the bar's closing price is below its midpoint; ├ — the bar's closing price is equal to its midpoint; 🟢 — Bullish Divergent bar, i.e. the bar's closing price is above its midpoint, the bar's high is below all Alligator lines, the bar's low is below the previous bar's low; 🔴 — Bearish Divergent bar, i.e. the bar's closing price is below its midpoint, the bar's low is above all Alligator lines, the bar's high is above the previous bar's high. When filtering is enabled in the "TIMEFRAMES > Filtering by Divergent bar" field, the data in the screener table cells will be displayed only for those timeframes that have a Divergent bar. A high bar volume signal is also displayed — 📶/📶² if the bar volume is greater than 40%/70% of the average volume value calculated using a simple moving average (SMA) in the 140 bar interval from the last bar.
In the indicator settings in the "SYMBOL LIST" field, each ticker (for example: OANDA:SPX500USD) must be on a separate line. If the market is closed, then the data for requested symbols will be limited to the time of the last (current) bar on the chart, for example, if the current symbol was traded yesterday, and the requested symbol is traded today, when requesting data for an hourly timeframe, the last bar will be for yesterday, if the timeframe of the current chart is not higher than 1 day. Therefore, by default, a warning will be displayed on the chart instead of the screener table that if the market is open, you must wait for the screener to load (after the first price change on the current chart), or if the highest timeframe in the screener is 1 day, you will be prompted to change the timeframe on the current chart to 1 week, if the screener requests data for the timeframe of 1 week, you will be prompted to change the timeframe on the current chart to 1 month, or switch to another symbol on the current chart for which the market is open (for example: BINANCE:BTCUSDT), or disable the warning in the field "SYMBOL LIST > Do not display screener if market is close".
The number of the last columns with the color of the AO indicator that will be displayed in the screener table for each timeframe is specified in the indicator settings in the "AWESOME OSCILLATOR > Number of columns" field.
For each timeframe, the direction of the trend between the price of the highest and lowest bars in the specified range of bars from the last bar is displayed — ↑ if the trend is up (the highest bar is to the right of the lowest), or ↓ if the trend is down (the lowest bar is to the right of the highest). If there is a divergence on the AO indicator in the specified interval, the symbol ∇ is also displayed. The average volume value is also calculated in the specified interval using a simple moving average (SMA). The number of bars is set in the indicator settings in the "INTERVAL FOR HIGHEST AND LOWEST BARS > Bars count" field.
In the indicator settings in the "STYLE" field you can change the position of the screener table relative to the chart window, the background color, the color and size of the text.
***
Скринер на основе стратегии Profitunity Билла Вильямса для нескольких таймфреймов (максимум 5, включая таймфрейм графика) и настраиваемого списка символов. Скринер анализирует индикаторы Alligator и Awesome Oscillator, Дивергентные бары и бары с высоким объемом.
Максимально допустимое количество запросов (символы и таймфреймы) ограничено 40 запросами, например, для 10 символов по 4 запроса разных таймфреймов. Поэтому в индикаторе автоматически ограничивается количество отображаемых символов в зависимости от количества таймфреймов для каждого символа, если символов больше чем отображено в таблице скринера, то слева от символов отображаются порядковые номера, в таком случае можно отобразить следующую группу символов, увеличив значение на 1 в настройках индикатора поле "Show tickers from", если включено поле "Group", или указать номер символа на 1 больше, чем последний символ в таблице скринера. 👀 Когда применяется фильтрация по таймфрейму, в таблице скринера отображаются только столбцы тех таймфреймов, для которых выбрано значение фильтрации, что позволяет отображать большее количество символов.
Для каждого таймфрейма в настройках индикатора в поле "TIMEFRAMES > Prev" можно включить отображение данных для предыдущего бара относительно последнего (текущего), если для запрашиваемого символа рынок открыт. В поле "TIMEFRAMES > Y" можно включить фильтрацию, в зависимости от расположения последних пяти баров относительно линий индикатора Alligator, которые обозначаются специальными символами в таблице скринера:
⬆️ — если Alligator открыт вверх (Lips > Teeth > Jaw) и ни один из баров не закрыт ниже линии Lips;
↗️ — если один из баров, кроме предпоследнего, закрыт ниже Lips, или два бара, кроме последнего, закрыты ниже Lips, или Alligator открыт вверх только ниже четырех баров, но ни один из баров не закрыт ниже Lips;
⬇️ — если Alligator открыт вниз (Lips < Teeth < Jaw), но ни один из баров не закрыт выше Lips;
↘️ — если один из баров, кроме предпоследнего, закрыт выше Lips, или два бара, кроме последнего, закрыты выше Lips, или Alligator открыт вниз только выше четырех баров, но ни один из баров не закрыт выше Lips;
➡️ — в остальных случаях, в то числе когда линии Alligator пересекаются и один из баров закрыт за линией Lips или два бара пересекают одну из линий Alligator.
В поле "TIMEFRAMES > Show bar change value for TF" можно добавить справа от выбранного столбца таймфрейма столбец с процентным изменением между ценой закрытия последнего бара (текущего) и ценой закрытия предыдущего бара ((close – previous close) / previous close * 100). В зависимости от величины процента будет меняться цвет фона ячейки таблицы скринера: темно-красный, если <= -3%; красный, если <= -2%, светло-красный, если <= -0.5%; темно-зеленый, если >= 3%; зеленый, если >= 2%; светло-зеленый, если >= 0.5%.
Для каждого таймфрейма в таблице скринера отображается символ последнего (текущего) бара, в зависимости от цены закрытия относительно середины бара ((high + low) / 2) и расположения относительно линий индикатора Alligator: ⎾ — цена закрытия бара выше его середины; ⎿ — цена закрытия бара ниже его середины; ├ — цена закрытия бара равна его середине; 🟢 — Бычий Дивергентный бар, т.е. цена закрытия бара выше его середины, максимум бара ниже всех линий Alligator, минимум бара ниже минимума предыдущего бара; 🔴 — Медвежий Дивергентный бар, т.е. цена закрытия бара ниже его середины, минимум бара выше всех линий Alligator, максимум бара выше максимума предыдущего бара. При включении фильтрации в поле "TIMEFRAMES > Filtering by Divergent bar" данные в ячейках таблицы скринера будут отображаться только для тех таймфреймов, где есть Дивергентный бар. Также отображается сигнал высокого объема бара — 📶/📶², если объем бара больше чем на 40%/70% среднего значения объема, рассчитанного с помощью простой скользящей средней (SMA) в интервале 140 баров от последнего бара.
В настройках индикатора в поле "SYMBOL LIST" каждый тикер (например: OANDA:SPX500USD) должен быть на отдельной строке. Если рынок закрыт, то данные для запрашиваемых символов будут ограничены временем последнего (текущего) бара на графике, например, если текущий символ торговался последний день вчера, а запрашиваемый символ торгуется сегодня, при запросе данных для часового таймфрейма, последний бар будет за вчерашний день, если таймфрейм текущего графика не выше 1 дня. Поэтому по умолчанию на графике будет отображаться предупреждение вместо таблицы скринера о том, что если рынок открыт, то необходимо дождаться загрузки скринера (после первого изменения цены на текущем графике), или если в скринере самый высокий таймфрейм 1 день, то будет предложено изменить на текущем графике таймфрейм на 1 неделю, если в скринере запрашиваются данные для таймфрейма 1 неделя, то будет предложено изменить на текущем графике таймфрейм на 1 месяц, или же переключиться на другой символ на текущем графике, для которого рынок открыт (например: BINANCE:BTCUSDT), или отключить предупреждение в поле "SYMBOL LIST > Do not display screener if market is close".
Количество последних столбцов с цветом индикатора AO, которые будут отображены в таблице скринера для каждого таймфрейма, указывается в настройках индикатора в поле "AWESOME OSCILLATOR > Number of columns".
Для каждого таймфрейма отображается направление тренда между ценой самого высокого и самого низкого баров в указанном интервале баров от последнего бара — ↑, если тренд направлен вверх (самый высокий бар справа от самого низкого), или ↓, если тренд направлен вниз (самый низкий бар справа от самого высокого). Если есть дивергенция на индикаторе AO в указанном интервале, то также отображается символ — ∇. В указанном интервале также рассчитывается среднее значение объема с помощью простой скользящей средней (SMA). Количество баров устанавливается в настройках индикатора в поле "INTERVAL FOR HIGHEST AND LOWEST BARS > Bars count".
В настройках индикатора в поле "STYLE" можно изменить положение таблицы скринера относительно окна графика, цвет фона, цвет и размер текста.

Screener - Moving Average / ATR Breakout Signal [ARTech]Screener - Moving Average / ATR Breakout Signal
This indicator features a powerful multi-symbol screener that scans up to 40 user-defined symbols in real time for Moving Average (MA) and ATR breakout signals. Users can customize the list of symbols, select the asset class (e.g., Crypto, Stocks, Forex). The screener detects trend-following signals based on price crossing a chosen MA type and length, enhanced by optional ATR-based volatility filters and breakout thresholds to improve signal accuracy. Signals can be displayed on the chart via labels, tooltips, or a compact signal table, allowing traders to monitor multiple markets simultaneously without switching charts. The list of symbols generating signals can also be tracked with customizable alerts, enabling traders to receive real-time notifications for long and short breakout signals directly via TradingView alerts.
This indicator is developed based on the concept of Moving Average / ATR Breakout Signal script on TradingView, with enhancements to support multi-symbol scanning.
Key Features
• Multi-Symbol Screener: Scans up to 40 user-defined symbols simultaneously, with automatic separator detection and symbol validation.
• Repaint Prevention: Carefully designed to avoid repaint issues. The script structure and signal logic have been built to ensure reliable behavior, even across multiple symbols and varying chart conditions.
• Flexible Signal Display: Offers chart labels, tooltips, or a compact table to show signals, enabling multi-market monitoring without switching charts.
• Customizable Alerts: Supports alerts for both long and short signals, sending a list of symbols generating signals as real-time notifications.
• Multi-Type Moving Average Support: Choose from several MA types including EMA, SMA, Hull MA, VWMA, RMA, and TEMA, with customizable source and length settings.
• Flexible Signal Logic: Generates signals when price breaks above or below the selected MA, with options for confirmation candles and wick or close based breakout detection.
• ATR-Based Filtering: Utilizes ATR to create dynamic breakout bands around the MA, reducing noise and improving breakout validation.
• Breakout Threshold Filtering: Adds an optional minimum percentage price move before a new opposite signal is allowed, preventing rapid reversals.
Why use this indicator?
• Scans up to 40 symbols at the same time.
• Users can define the symbol list, asset class, and automatically detects the symbol separator; warns if any symbols are invalid
• Detected signals are shown directly on the chart as labels, tooltips, or in a compact table.
• The list of signal-generating symbols can be tracked with alerts — no need to watch the chart constantly.
How to Use
███████ Alerts ███████
🔸 Long / Short
To enable Custom Alerts, select the desired alert type (Long or Short) from the indicator's settings under the "Alerts" section, you can customize messages and enable notifications for Long and Short signals. Then, you need to activate the fx alert() function call option in TradingView’s alert creation dialog.
Alert messages include your custom message followed by a list of symbols currently giving signals, each shown on a new line. For example, if your input message is set to “🟢 Long Signal” and BTCUSD and ETHUSD are signaling, the alert will look like this:
🟢 Long Signal
BTCUSD
ETHUSD
This format helps you clearly see the type of signal and each symbol individually, making real-time monitoring easier.
🔸 Alert Delay (seconds)
This setting adds a delay before alerts are triggered. It helps ensure that signals are based on confirmed bar closures for slight timing differences between symbol data feeds (especially in multi-symbol mode). For example, setting a 30-second delay allows all symbols to finish processing before the alert fires, avoiding early or incomplete signal lists.
For best results, try different delay values to see what works best with your selected timeframe.
███████ Display / Signal ███████
🔸 Display Mode
Choose how the indicator presents signals on your chart. Focus on a single symbol (Chart mode), Scan and display multiple symbols at once (Screener mode), or hide visuals and use only tables or alerts (No mode).
• Chart Mode: Displays signals only for the current chart symbol. Useful for testing and optimizing signal conditions before scanning multiple assets.
• Screener Mode: Activates the screener functionality, showing results for all valid symbols in your list. Signals appear as labels on the chart and are also listed in the signal table for easy tracking.
• No (Table Only): Hides all on-chart visuals (labels, markers). Signals are still processed and can be viewed in tables or used with alerts. This mode is ideal when you're using multiple screeners at once and want to avoid overlapping visuals. Each screener can display its results in separate table positions (e.g., bottom right, top left, etc.), so turning off chart visuals helps keep your workspace clean while still tracking multiple symbol groups efficiently. This way, you can also track more than 40 symbols by using multiple screener instances with different symbol groups and table positions.
🔸 Long
You can independently turn ON or OFF the display of Long signals using the toggle.
🔸 Short
You can independently turn ON or OFF the display of Short signals using the toggle.
███████ Symbols ███████
🔸 Symbols
You can enter up to 40 symbols. Symbols must be written in full format. For example: BINANCE:BTCUSDT, NASDAQ:AAPL, or OANDA:EURUSD. TradingView requires this full format to correctly recognize each symbol. Due to TradingView’s limitations, only the first 40 symbols in your list will be processed
- Separator Rules: Letters (A–Z), numbers (0–9), underscore (_), dot (.), and exclamation mark (!) are allowed within symbol names (e.g., BINANCE:BTCUSDT.P). Therefore, avoid using them as separators. Instead, use comma (,) , semicolon (;) , space , or newline to separate multiple symbols.
- Auto Detection: The indicator automatically detects the separator used in your list. If the format is incorrect or a symbol is invalid, a warning will appear to help you fix it.
🔸 Symbol Filter
When scanning multiple symbols, it's important that they belong to the same market type (Crypto, Stocks, Forex, etc.). Different markets have different trading hours, and mixing them may cause issues.
For example, if your chart is using a stock symbol (like NASDAQ:AAPL) and your symbol list includes crypto symbols (like BINANCE:BTCUSDT), the screener may not work correctly. Since stock markets are not open 24/7, the chart time may fall outside of crypto trading hours — causing crypto signals to fail or not update properly.
To avoid this issue, the indicator includes a Symbol Filter. This lets you filter your symbol list to include only the correct asset type (e.g., only Crypto or only Stocks). By using this filter, you make sure the screener runs under the correct market conditions and avoids signal mismatches.
If you set the filter to None , no filtering will be applied. In this case, you are responsible for making sure all listed symbols match your chart’s market type.
For best results, always use symbols from the same market type as your chart symbol. This ensures that candle open/close times align across all symbols, avoiding timing mismatches. Symbols and the chart must follow the same market hours for accurate and consistent signal generation.
🔸 Show Symbols on Table
This feature helps you quickly review the symbols you've entered. When enabled, a table appears in the bottom-right corner of the chart displaying all symbols from your list along with their market types and statuses
- Green background: Symbol is valid and matches the selected Symbol Filter. It can generate signals.
- Gray background: Symbol is valid but does not match the selected filter. It will not generate signals.
- Red background: Symbol is invalid (e.g., due to incorrect names, delisting, or unsupported by broker).
You don’t need to remove invalid or mismatched symbols, but no signals will be generated for them. This visual check makes it easier to catch symbol issues before relying on the screener output.
███████ Signal Display Style ███████
🔸 Display Method
Choose how signals will be shown visually
• Label: The signal appears as a label on the candle. The label includes all triggering symbols as text.
• Tooltip: An icon (such as 🟢 or 🔴) is shown instead of full text. Hold your mouse pointer on the icon on chart for a few seconds to see a tooltip listing the triggered symbols. This method keeps your chart cleaner and less cluttered.
• None: No visual markers appear on candles. Signals are only visible in the signal table — ideal if you're using multiple indicators and want to avoid chart clutter.
🔸 Symbol Display Format
This setting affects the labels, tooltips, signal table, and alert messages, ensuring consistency across all displays. Select whether you want symbols to appear as:
• EXCHANGE:SYMBOL: BINANCE:BTCUSDT
• SYMBOL: BTCUSDT
🔸 Long Signal Icon
Used only in Tooltip mode, these icons (e.g., 🟢 for Long) appear on bars where signals are detected. Customize it freely to match your style or strategy.
🔸 Short Signal Icon
Used only in Tooltip mode, these icons (e.g., 🔴 for Short) appear on bars where signals are detected. Customize it freely to match your style or strategy.
🔸 Size
Adjust the visual size of labels or tooltips. Smaller sizes help reduce clutter when many signals trigger in close proximity.
███████ Signal Table ███████
This section controls the appearance and behavior of the signal table that displays last detected Long and Short signals for your symbols.
🔸 Show
Enable or disable the signal table display on the chart.
🔸 Highlight Signal Duration (Bars)
When a signal occurs, the corresponding cell in the table is highlighted using the selected Long or Short color for this many bars. This helps visually track recent signals over time. The bar where the signal icon appears is counted as 1.
🔸 Table Size
Choose the size of the table to fit your chart layout and readability preferences.
🔸 Table Position
Select where the table appears on your chart (e.g., top right, middle right, bottom left).
🔸 Title
Customize the table header text. The default is “Recent Signals”.
🔸 Background Color
Set the table’s background color and transparency to match your chart’s theme.
🔸 Long Signal Color
Choose the highlight color used to mark Long signals within the table.
🔸 Short Signal Color
Choose the highlight color used to mark Short signals within the table.
🔸 Text Color
Customize the text color inside the table for better contrast and readability.
🔸 Show Bars Since Signal
Optionally display how many bars have passed since each signal appeared. The bar where the signal occurs counts as 1.
███████ Signal ███████
This is the core component of the signal system. You can customize:
🔸 Moving Average Type
Choose from SMA, EMA, WMA, Hull MA, VWMA, RMA, or TEMA
🔸 Length
Adjust the length to suit your strategy.
🔸 Source
Select which price data (e.g., Close, Open, HL2) is used to calculate the MA.
🔸 Confirm Candles
Defines the number of consecutive candles that must break the selected level to confirm a signal.
– If ATR filter is enabled, this level is the ATR bands.
– If ATR is disabled, the Moving Average line is used.
This helps filter out noise and avoid premature signals.
🔸 Break Type
Specifies how the candle must break the level:
– Close: The candle must close beyond the level.
– Wick: A wick touching or exceeding the level is enough.
Both options generate signals only after the candle has closed.
🔸 Filter
This section provides optional filters to improve signal accuracy.
ATR
When the ATR filter is enabled, signals are generated only if the price breaks above the upper ATR line or below the lower ATR line—calculated by adding or subtracting the ATR multiplied threshold from the moving average—and the breakout must occur for the number of consecutive confirmation candles specified by the user input . This helps reduce false signals during low volatility periods.
• Multiplier: Adjusts the width of ATR bands by multiplying the ATR value.
• Length: Sets the period for ATR calculation.
• Smoothing: Selects the smoothing method applied to the ATR (RMA, SMA, EMA, WMA).
Breakout
When enabled, breakout confirmation requires the price to cross above the upper breakout line or below the lower breakout line by a specified percentage from the last signal price.
• Threshold (%): Defines the minimum percentage price movement required to validate a breakout.
• Show Breakout Levels: Toggle to display or hide breakout threshold area on the chart.

Degen Screener – ALTs vs. BTCDegen Screener – ALTs vs. BTC
🛠️ What This Script Does:
This multi-asset screener monitors up to 10 cryptocurrencies and compares their RSI strength relative to Bitcoin (BTC) — acting like BTC is the "north star." It's perfect for catching early shifts in momentum across the crypto market.
🎨 Color Logic:
RSI Column:
RSI < 30 → Green (oversold)
RSI > 70 → Red (overbought)
In between → Gray
Relative RSI Column:
0 → Green (stronger than BTC)
< 0 → Red (weaker than BTC)
Trend Column:
🤑 → Bullish shift (green background)
🖕 → Bearish shift (red background)
🔔 Alert Conditions:
Alerts fire when all three of these are true:
RSI is below 30 (oversold)
The asset is stronger than BTC
Momentum is turning bullish (🤑)
Perfect for spotting early reversals in oversold altcoins.
✅ How to Use:
Add the script to any chart (doesn’t matter which asset)
Customize the list of up to 10 symbols
Set your timeframe
Enable the alert condition: Relative RSI Signal
💡 Notes:
Script runs on whatever chart you’re on, but it pulls data from the 10 assets you select on your indicator.
⚠️ Disclaimer:
This tool is for educational and informational purposes only. It is not financial advice. Always do your own research.

Multi TF Oscillators Screener [TradingFinder] RSI / ATR / Stoch🔵 Introduction
The oscillator screener is designed to simplify multi-timeframe analysis by allowing traders and analysts to monitor one or multiple symbols across their preferred timeframes—all at the same time. Users can track a single symbol through various timeframes simultaneously or follow multiple symbols in selected intervals. This flexibility makes the tool highly effective for analyzing diverse markets concurrently.
At the core of this screener lie two essential oscillators: RSI (Relative Strength Index) and the Stochastic Oscillator. The RSI measures the speed and magnitude of recent price movements and helps identify overbought or oversold conditions.
It's one of the most reliable indicators for spotting potential reversals. The Stochastic Oscillator, on the other hand, compares the current price to recent highs and lows to detect momentum strength and potential trend shifts. It’s especially effective in identifying divergences and short-term reversal signals.
In addition to these two primary indicators, the screener also displays helpful supplementary data such as the dominant candlestick type (Bullish, Bearish, or Doji), market volatility indicators like ATR and TR, and the four key OHLC prices (Open, High, Low, Close) for each symbol and timeframe. This combination of data gives users a comprehensive technical view and allows for quick, side-by-side comparison of symbols and timeframes.
🔵 How to Use
This tool is built for users who want to view the behavior of a single symbol across several timeframes simultaneously. Instead of jumping between charts, users can quickly grasp the state of a symbol like gold or Bitcoin across the 15-minute, 1-hour, and daily timeframes at a glance. This is particularly useful for traders who rely on multi-timeframe confirmation to strengthen their analysis and decision-making.
The tool also supports simultaneous monitoring of multiple symbols. Users can select and track various assets based on the timeframes that matter most to them. For example, if you’re looking for entry opportunities, the screener allows you to compare setups across several markets side by side—making it easier to choose the most favorable trade. Whether you’re a scalper focused on low timeframes or a swing trader using higher ones, the tool adapts to your workflow.
The screener utilizes the widely-used RSI indicator, which ranges from 0 to 100 and highlights market exhaustion levels. Readings above 70 typically indicate potential pullbacks, while values below 30 may suggest bullish reversals. Viewing RSI across timeframes can reveal meaningful divergences or alignments that improve signal quality.
Another key indicator in the screener is the Stochastic Oscillator, which analyzes the closing price relative to its recent high-low range. When the %K and %D lines converge and cross within the overbought or oversold zones, it often signals a momentum reversal. This oscillator is especially responsive in lower timeframes, making it ideal for spotting quick entries or exits.
Beyond these oscillators, the table includes other valuable data such as candlestick type (bullish, bearish, or doji), volatility measures like ATR and TR, and complete OHLC pricing. This layered approach helps users understand both market momentum and structure at a glance.
Ultimately, this screener allows analysts and traders to gain a full market overview with just one look—empowering faster, more informed, and lower-risk decision-making. It not only saves time but also enhances the precision and clarity of technical analysis.
🔵 Settings
🟣 Display Settings
Table Size : Lets you adjust the table’s visual size with options such as: auto, tiny, small, normal, large, huge.
Table Position : Sets the screen location of the table. Choose from 9 possible positions, combining vertical (top, middle, bottom) and horizontal (left, center, right) alignments.
🟣 Symbol Settings
Each of the 10 symbol slots comes with a full set of customizable parameters :
Enable Symbol : A checkbox to activate or hide each symbol from the table.
Symbol : Define or select the asset (e.g., XAUUSD, BTCUSD, EURUSD, etc.).
Timeframe : Set your desired timeframe for each symbol (e.g., 15, 60, 240, 1D).
RSI Length : Defines the period used in RSI calculation (default is 14).
Stochastic Length : Sets the period for the Stochastic Oscillator.
ATR Length : Sets the length used to calculate the Average True Range, a key volatility metric.
🔵 Conclusion
By combining powerful oscillators like RSI and Stochastic with full customization over symbols and timeframes, this tool provides a fast, flexible solution for technical analysts. Users can instantly monitor one or several assets across multiple timeframes without opening separate charts.
Individual configuration for each symbol, along with the inclusion of key metrics like candlestick type, ATR/TR, and OHLC prices, makes the tool suitable for a wide range of trading styles—from scalping to swing and position trading.
In summary, this screener enables traders to gain a clear, high-level view of various markets in seconds and make quicker, smarter, and lower-risk decisions. It saves time, streamlines analysis, and boosts overall efficiency and confidence in trading strategies.

Flux Charts - SFX Screener💎 GENERAL OVERVIEW
The SFX Screener by Flux Charts is a multi-timeframe market scanner that extracts and visually organizes key conditions detected by the SFX Algo indicator across multiple assets in real-time. It does not perform independent analysis or generate new signals—instead, it pulls data directly from the SFX Algo’s calculations to ensure full alignment across different timeframes and tickers.
The SFX Algo is a multi-factor trading indicator that integrates trend analysis, signal generation, market overlays, and take-profit/stop-loss levels into a single system. It evaluates multiple trend components, including EMA direction, momentum shifts, and volatility cycles, to determine market conditions. Signal generation is based on an Adjusted Weighted Majority Algorithm, filtering out weaker signals by prioritizing the most reliable market indicators. Market overlays, such as Volatility Bands and the Retracement Wave, provide dynamic support, resistance, exit points, and entry points. Its adaptable structure allows traders to customize settings based on strategy preferences, making it effective for scalping, swing trading, and long-term trend analysis.
The SFX Screener’s purpose is to give traders a dashboard view of these SFX Algo signals across multiple tickers and timeframes in real-time.
📌 HOW DOES IT WORK ?
The SFX Algo indicator employs an Adjusted Weighted Majority algorithm to generate "buy" and "sell" signals. It evaluates multiple market indicators ("experts"), including momentum, ATR trends, and EMA trends, and assigns weights based on their recent performance. The "Time Weighting" setting allows users to balance between using more historical data or prioritizing recent trends. Unlike traditional weighted majority methods, SFX also dynamically penalizes larger losses. Signals are confirmed based on the consensus of the most successful indicators within the selected time period, filtering out weaker signals during underperforming phases.
The SFX Screener extracts these calculated outputs and visually organizes them into a real-time dashboard. Each signal, status, and volatility condition displayed in the screener is a direct output from the SFX Algo indicator.
🚩 UNIQUENESS
Unlike traditional screeners that rely on preset filters or static conditions, the SFX Screener dynamically updates its dashboard based on live outputs from the SFX Algo’s adaptive algorithm.
Traditional Screeners → Use predefined filters like “price above EMA” or “RSI overbought.” They do not adjust to market dynamics.
SFX Screener → Displays outputs directly from an adaptive algorithm that continuously evaluates trends, volatility, and momentum changes.
The SFX Screener can show SFX Algo's status on 8 different tickers on different timeframes. Key factors that make it unique include:
✅ Real-time sync with SFX Algo → Displays live conditions, not static filters.
✅ Comprehensive Dashboard – This screener provides a complete and customizable dashboard designed to enhance traders' decision-making by consolidating crucial SFX Algo insights into one user-friendly interface.
✅ Multi-Ticker & Multi-Timeframe Analysis – With support for up to 8 tickers and timeframes, traders can effortlessly analyze the bigger market picture, identifying trends and opportunities across different assets and timeframes.
By combining multiple analytical elements in a single view, this screener empowers traders with the insights needed to navigate the market more effectively.
🎯 SFX SCREENER FEATURES:
SFX Algo Signals : This tool can detect SFX Algo signals across different tickers & timeframes.
Volatility Bands : Detection of Volatility Bands Status & Retests.
Retracement Wave : Detection of Retracement Wave Status & Retests.
Highly Configurable : Offers multiple parameters for fine-tuning detection settings.
Up to 8 Tickers : Allows traders to analyze multiple tickers & timeframes simultaneously for enhanced accuracy.
📊 SFX SCREENER DATA BREAKDOWN
Signal ->
Buy -> The latest signal is a buy signal.
Sell -> The latest signal is a sell signal.
The rating of the signal is shown after the signal type.
Δ⭐ ->
Shows the rating change (delta) after the signal is triggered. Positive values mean that the rating is increased after the signal is given, negative values mean that it's decreased.
Status ->
Displays the amount of time passed after the signal is given.
TP Targets ->
Shows the Take-Profit targets of the signal, if a target was achieved, there is a ✅ symbol near it and the next target it displayed.
V. Bands ->
The Volatility Bands dynamically adjust to market conditions, expanding during high volatility and contracting during low volatility. When the volatility bands are tight, or the upper and lower bands are close to each other, the market is not volatile. During periods of low volatility, it’s common for price to consolidate or move sideways. An early indication of a large price move can occur when the bands widen or open up after being tight. When the volatility bands are wide, it reflects a period of increased volatility, typically during strong price trends or after a breakout. The volatility bands can also act as support and resistance areas. The upper band acts as resistance while the lower band acts as support. These mark out good areas for potential reversals. Breakouts can also occur when price moves beyond the bands, signaling a potential trend in the breakout direction.
Outside -> The price is currently outside of the Volatility Bands.
Inside | Upper -> The price is currently inside the Upper Volatility Band.
Inside | Lower -> The price is currently inside the Lower Volatility Band.
R. Wave ->
The Retracement Wave is used to identify entry points during pullbacks in trending markets. It can also be used to find exit points for open trades. The wave is bullish when price is above it and bearish when the price is below it. The retracement wave can be used as an area to enter during a pullback in a trending market. The wave can also be helpful for managing risk and closing out positions.
Outside | Bullish -> The Retracement Wave is currently Bullish, and the price is outside of it.
Outside | Bearish -> The Retracement Wave is currently Bearish, and the price is outside of it.
Inside | Bullish -> The Retracement Wave is currently Bullish, and the price is inside of it.
Inside | Bearish -> The Retracement Wave is currently Bearish, and the price is inside of it.
Profit & Loss (P&L) ->
Shows the amount of profit or loss the position is currently in. All values are shown in terms of percentage, and positive values mean the position is in profit while negative values mean that the position is in loss.
⚠ Timeframe Restriction : The selected timeframes for analysis cannot be lower than the chart’s current timeframe to ensure proper data alignment.
⏰ ALERTS
This screener supports alerts, so you never miss a key market move. You can choose to receive alerts when a buy or sell signal is given, helping you spot potential trading opportunities. Additionally, you can enable alerts for take-profit or stop-loss levels, which notify you when the price achieves those levels. The alerts will work for each enabled ticker in the settings. You can also toggle webhook format for alerts, and choose to include ticker metadata in it.
⚙️ SETTINGS
1. Algorithm Settings
Sensitivity: The sensitivity setting is a key parameter that influences the frequency of signals the SFX Algo generates. By adjusting this parameter, you can control the frequency of signals produced by the algorithm. Using a lower sensitivity setting generates more frequent signals that are highly responsive to minor price fluctuations. Using a higher sensitivity setting reduces the frequency of signals, focusing on more significant price movements and filtering out minor fluctuations.
Signal Strength: The Signal Strength setting filters signals based on their quality, allowing traders to focus on the most reliable opportunities. This feature helps traders balance the quantity and reliability of the algorithm’s signals to suit their trading strategy. Using a lower signal strength will display more signals, including those with lower signal ratings, for broader market coverage. Using a higher signal strength will display fewer signals by prioritizing those with higher signal ratings, reducing market noise.
Time Weighting: The Time Weighting setting in the SFX Algo determines how historical market data is analyzed to generate signals.
a) Recent Trends
Focuses on the most recent movements for short-term analysis. This setting is good for scalpers and intraday traders who need to react quickly to market changes.
b) Mixed Trends
Balances recent and historical price movements for a comprehensive market view. This setting is well-suited for swing traders and those who want to capture medium-term opportunities by combining the benefits of short-term responsiveness with the reliability of long-term trends.
c) Long-term Trends
Relies on extended historical market data to identify broader market trends, making it an excellent choice for traders focused on long-term strategies.
Minimum Star Rating : The Minimum Star Rating setting allows you to filter signals based on their strength, showing only those that meet or exceed your chosen threshold. For instance, setting the minimum star rating to 3 ensures you only receive signals with a rating of 3 stars or higher.
2. Take Profit / Stop Loss Methods
Key Levels
The Key Levels method uses pivot points to set take profit and stop-loss levels. The TP and SL levels are shown when a new signal is generated.
Volatility Bands
This TP/SL method uses the Volatility Bands overlay to set dynamic TP and SL levels. These levels are not predetermined so they will not be shown in advance when a signal is generated.
Signal Rating
Sets take profit and stop-loss levels based on changes in a signal's rating strength. These levels are not predetermined so they will not be shown in advance when a signal is generated.
Auto Stop-Loss
The auto method can only be applied to the SL. The auto method allows the algorithm to detect SL automatically when a momentum shift is detected. You can adjust the risk tolerance of the Auto SL by adjusting the ‘Auto Risk Tolerance’ setting. You can choose between Low, Medium, and High. A high-risk tolerance will result in stop losses being triggered less often.
3. Tickers
You can set, then enable or disable up to 8 tickers in this section to get informed about their latest SFX Algo signal.
‼️ Important Notes
TradingView has limitations when running advanced screeners, resulting in the following restrictions:
Computation Errors:
The computation of using MTF features and viewing several tickers is very intensive on TradingView. This can sometimes cause calculation timeouts. When this occurs simply force the recalculation by modifying one indicator’s settings or by removing the indicator and adding it to your chart again.
Inconsistencies:
You may notice inconsistencies when viewing the screener on a chart with a specific symbol because screener tickers originate from different markets. Since the cryptocurrency market operates 24/7, while stock markets have defined opening and closing hours, the screener may return varying information depending on whether you're currently viewing a cryptocurrency, stock, or currency pair.

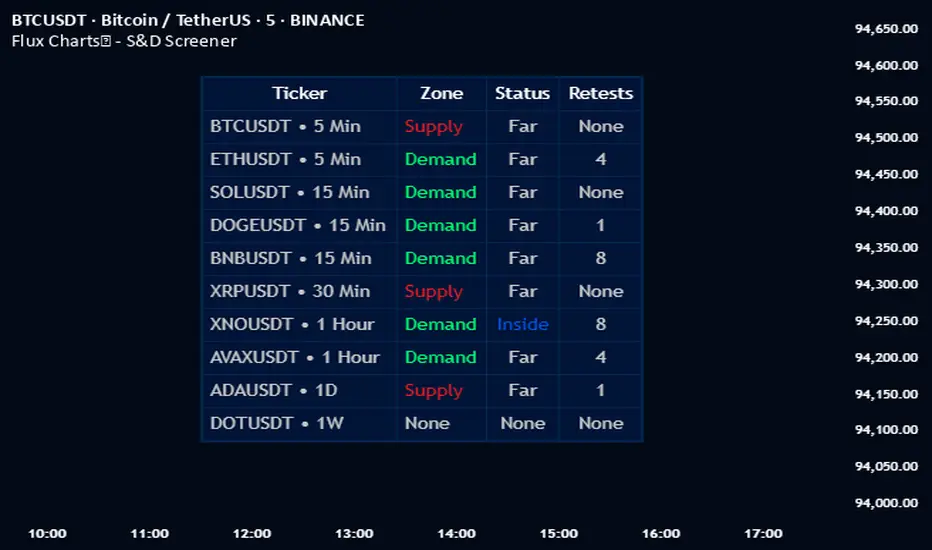
Flux Charts - S&D Screener💎 GENERAL OVERVIEW
Introducing Supply & Demand Zones (S&D) Screener! This screener can spot trading opportunities for Supply & Demand traders across 8 different tickers and timeframes simultaneously! This screener offers a wide range of configurable settings, explained within this write-up.
S&D Screener Features:
Supply & Demand Zones : This tool can detect Supply & Demand zones using one of the two detection methods.
Highly Configurable : Offers multiple parameters for fine-tuning detection settings.
Up to 8 Tickers : Allows traders to analyze multiple tickers & timeframes simultaneously for enhanced accuracy.
🚩 UNIQUENESS
The S&D Screener is the first ever tool on TradingView that allows traders to screen 8 different tickers on different timeframes for Supply & Demand Zones. Key factors that make it unique include:
✅ Comprehensive Dashboard – This screener provides a complete and customizable dashboard designed to enhance traders' decision-making by consolidating crucial Supply & Demand insights into one user-friendly interface.
✅ Multi-Ticker & Multi-Timeframe Analysis – With support for up to 8 tickers and timeframes, traders can effortlessly analyze the bigger market picture, identifying trends and opportunities across different assets and timeframes.
By combining multiple analytical elements in a single view, this screener empowers traders with the insights needed to navigate the market more effectively.
📌 HOW DOES IT WORK ?
The S&D Screener helps traders identify Supply & Demand Zones on multiple tickers & timeframes. It offers customizable settings to adapt to different trading styles. The screener includes two zone detection methods. The Momentum Method identifies zones based on strong bullish or bearish price movements, making it ideal for traders who seek quick market reactions. The Regression Method uses statistical regression to detect zones by analyzing price deviations from the trend, which is more suitable for long-term traders. You can customize your zone preferences and enable up to 8 tickers and their respective timeframes. You'll be able to see the status of the latest detected zones on that ticker/timeframe. You can also see the distance from current price of the ticker to the zone and how many times price has retested that zone.
Supply Zone
In trading, a supply zone is a specific area on a price chart where selling interest surpasses buying interest, leading to a potential decline in asset prices. This zone typically forms after a price rally, indicating that sellers find the asset overvalued and are prepared to sell, creating downward pressure. Identifying supply zones can help traders anticipate potential price reversals or pullbacks.
Trading Possibilities with Supply Zones
Entering Short Positions -> When the price approaches a recognized supply zone, traders may consider initiating short positions, anticipating that increased selling pressure will drive prices down.
Setting Profit Targets -> For traders holding long positions, supply zones can serve as strategic points to set profit targets, as these areas may signal potential resistance and a subsequent price drop.
Demand Zone
In trading, a demand zone is a specific area on a price chart where buying interest is strong enough to halt a downtrend and potentially reverse it upward. This zone indicates a price level where demand exceeds supply, leading to a rise in price. Identifying these zones can provide traders with strategic entry points for potential long positions.
Trading Possibilities with Demand Zones
Entering Long Positions -> When the price approaches a recognized demand zone, traders may consider initiating long positions, anticipating that increased buying pressure will drive prices up.
Setting Profit Targets -> For traders holding short positions, demand zones can serve as strategic points to set profit targets, as these areas may signal potential resistance and a subsequent price increase.
Momentum Detection Method
The Momentum Detection Method identifies supply and demand zones by analyzing the strength and direction of price movements over a specified period. It looks for a sequence of strong bullish or bearish candles to determine potential zones. The method is sensitive to the ‘Sensitivity’ setting, which adjusts the threshold for what constitutes a "strong" candle.
Using the momentum method is ideal for traders looking to capitalize on immediate price reactions and momentum shifts.
Regression Detection Method
The Regression Method uses statistical regression to identify supply and demand zones by analyzing price consolidation patterns. It fits a regression line to price data and identifies zones where price deviates significantly from the trend. This method is more mathematical and less reliant on individual candle patterns. It focuses on the overall price structure and identifies zones based on statistical deviations from the trend.
This method is particularly useful for traders who focus on longer-term price trends and prefer a more statistical approach to pinpoint zones.
Using the momentum method is ideal for traders looking to capitalize on immediate price reactions and momentum shifts.
Status ->
Far -> This status indicates that the current price is significantly distant from any identified supply or demand zones. In this scenario, traders might exercise patience, waiting for the price to approach these zones before considering entry or exit points.
Approaching ⬆️ -> The price is rising towards a supply zone, suggesting potential selling opportunities as the price nears an area where selling pressure previously dominated.
Approaching ⬇️ -> The price is falling towards a demand zone, indicating potential buying opportunities as the price approaches an area known for strong buying interest.
Inside -> The current price is within the boundaries of a supply or demand zone. This status often signals a critical decision point:
Inside a Supply Zone: The area where selling pressure may increase, potentially leading to a price decline. Traders might look for confirmation before initiating short positions.
Inside a Demand Zone: The area where buying interest could surge, possibly resulting in a price increase. Traders might seek validation before entering long positions.
Being "inside" a zone suggests heightened market activity and potential volatility, warranting close monitoring for trading signals.
Retests -> A retest occurs when the price revisits a supply or demand zone but fails to break through it. Specifically, during a retest, the wick of a candlestick enters the zone, but the candle closes below the supply zone or above the demand zone. This price action suggests that the zone remains a strong area of resistance or support, as the market couldn't sustain movement beyond it. Traders often view such retests as confirmations to enter positions in the direction opposite to the zone's boundary. For instance, if the price retests a supply zone and fails to close above it, it may signal a selling opportunity. Conversely, a failed retest of a demand zone could indicate a buying opportunity. Monitoring the number of retests can provide insights into the strength of these zones; multiple retests without a breakout may reinforce the zone's significance. Here you can see how many times the price retested the supply or demand zone.
⚠ Timeframe Restriction : The selected timeframes for analysis cannot be lower than the chart’s current timeframe to ensure proper data alignment.
⏰ ALERTS
This screener supports alerts, so you never miss a key market move. You can choose to receive alerts when a new demand or supply zone is created, helping you spot potential trading opportunities. Additionally, you can enable alerts for retests, which notify you when the price returns to test a previously identified zone. The alerts will work for each enabled ticker in the settings.
⚙️ SETTINGS
1. General Configuration
Detection Method : There are two detection methods you can choose from for identifying Supply & Demand Zones. Both methods aim to identify key areas where price is likely to react, but they do so using different approaches. Traders can choose the method that aligns with their trading style and time horizon.
Sensitivity : The Sensitivity setting allows traders to adjust how aggressively the script identifies supply and demand zones when using the Momentum Detection Method. This setting directly impacts the threshold for detecting zones when using the momentum detection method.
High Sensitivity -> Detects smaller price movements, resulting in more zones being identified. This is ideal for traders who want to capture even minor supply and demand imbalances and prefer a higher frequency of potential trading opportunities.
Medium Sensitivity -> Balances between detecting significant price movements and avoiding excessive noise. This setting is suitable for most traders who want a moderate number of zones without being overwhelmed.
Low Sensitivity -> Focuses on larger, more significant price movements, resulting in fewer zones being identified. This is ideal for traders who prioritize quality over quantity and prefer to focus on the most impactful supply and demand areas.
Lowest Sensitivity -> Detects only the strongest and most pronounced price movements, identifying the most significant zones. This setting is best for traders who want to focus on high-probability, high-impact zones and avoid minor fluctuations.
Zone Invalidation : The Zone Invalidation setting determines how supply and demand zones are invalidated.
Wick -> A zone is invalidated if a candle’s wick goes below a demand zone or above a supply zone.
Close -> A zone is invalidated if a candle closes below a demand zone or above a supply zone.
Zone Visibility Range : The Zone Visibility Range setting controls how far from the current price supply and demand zones are displayed on the chart. It helps traders focus on relevant zones while avoiding clutter from distant or less impactful areas.
Minimum Zone Width : The Minimum Zone Width setting defines the smallest size a supply or demand zone must have to be displayed on the chart. It uses the Average True Range (ATR) as a reference to ensure zones are proportionate to current market volatility.
Minimum Zone Length : The Minimum Zone Length setting determines the minimum number of bars a supply or demand zone must span to be displayed on the chart. This setting helps filter out short-lived or insignificant zones, ensuring only meaningful areas of supply or demand are highlighted.
2. Tickers
You can set, then enable or disable up to 8 tickers in this section to get informed about their latest supply or demand zone.
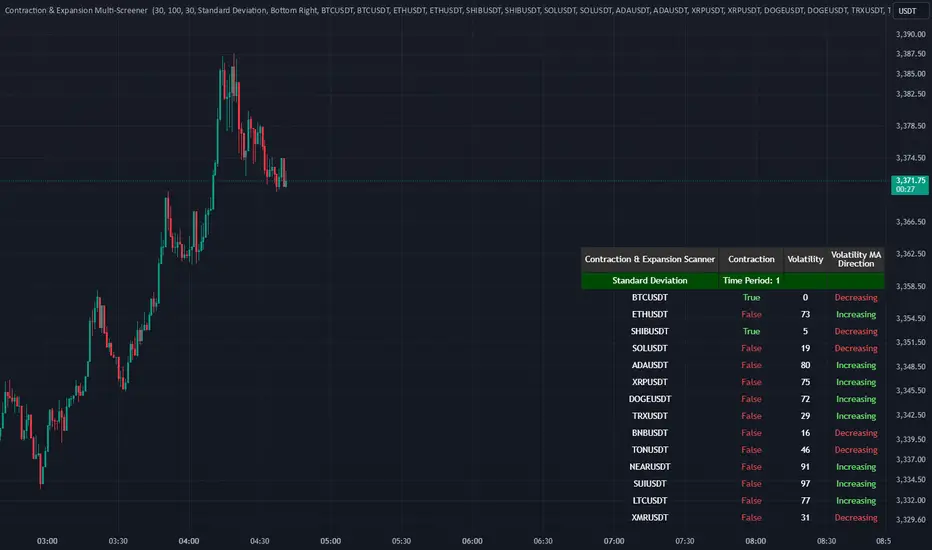
Contraction & Expansion Multi-Screener █ Overview:
The Contraction & Expansion Multi-Screener analyzes market volatility across many symbols. It provides insights into whether a market is contracting or expanding in volatility. With using a range of statistical models for modeling realized volatility, the script calculates, ranks, and monitors the degree of contraction or expansions in market volatility. The objective is to provide actionable insights into the current market phases by using historical data to model current volatility conditions.
This indicator accomplishes this by aggregating a variety of volatility measures, computing ranks, and applying threshold-based methods to identify transitions in market behavior. Volatility itself helps you understand if the market is moving a lot. High volatility or volatility that is increasing over time, means that the price is moving a lot. Volatility also mean reverts so if its extremely low, you can eventually expect it to return to its expected value, meaning there will be bigger price moves, and vice versa.
█ Features of the Indicator
This indicator allows the user to select up to 14 different symbols and retrieve their price data. There is five different types of volatility models that you can choose from in the settings of this indicator for how to use the screener.
Volatility Settings:
Standard Deviation
Relative Standard Deviation
Mean Absolute Deviation
Exponentially Weighted Moving Average (EWMA)
Average True Range (ATR)
Standard Deviation, Mean Absolute Deviation, and EWMA use returns to model the volatility, meanwhile Relative Standard Deviation uses price instead due to its geometric properties, and Average True Range for capturing the absolute movement in price. In this indicator the volatility is ranked, so if the volatility is at 0 or near 0 then it is contracting and the volatility is low. If the volatility is near 100 or at 100 then the volatility is at its maximum.
For traders that use the Forex Master Pattern Indicator 2 and want to use this indicator for that indicator, it is recommended to set your volatility type to Relative Standard Deviation.
Users can also modify the location of the screener to be on the top left, top right, bottom left, or bottom right. You also can disable sections of the screener and show a smaller list if you want to.
The Contraction & Expansion Screener shows you the following information:
Confirmation of whether or not there is a contraction or expansion
Percentage Rank of the volatility
Volatility MA direction: This screener uses moving averages on the volatility to determine if its increasing over time or decreasing over time.
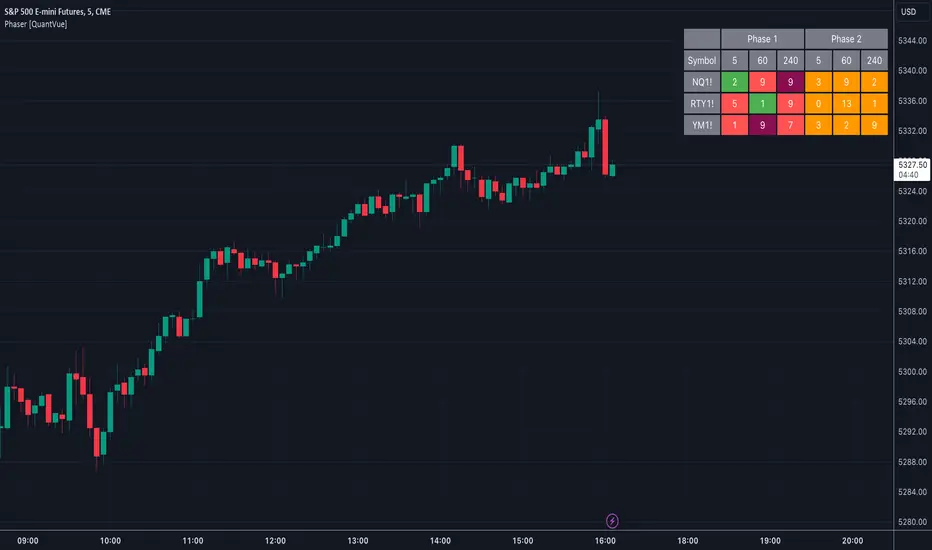
Phaser [QuantVue]The Phaser indicator is a tool to help identify inflection points by looking at price relative to past prices across multiple timeframes and assets.
Phase 1 looks for the price to be higher or lower than the closing price of the bar 4 bars earlier and is complete when 9 consecutive bars meet this criterion.
A completed Phase 1 is considered perfect when the highs (bearish) or lows (bullish) have been exceeded from bars 6 and 7 of the phase.
A bullish setup requires 9 consecutive closes less than the close 4 bars earlier.
A bearish setup requires 9 consecutive closes greater than the close 4 bars earlier.
Phase 2 begins once Phase 1 has been completed. Phase 2 compares the current price to the high or low of two bars earlier.
Unlike Phase 1, Phase 2 does not require the count to be consecutive.
Phase 2 is considered complete when 13 candles have met the criteria.
An important aspect to Phase 2 is the relationship between bar 13 and bar 8.
To ensure the end of Phase 2 is in line with the existing trend, the high or low of bar 13 is compared to the close of bar 8.
A bullish imperfect 13 occurs when the current price is less than the low of 2 bars earlier, but the current low is greater than the close of bar 8 in Phase 2.
A bearish imperfect 13 occurs when the current price is greater than the high of 2 bars earlier, but the current high is less than the close of bar 8 in Phase 2.
Phase 2 does not need to go until it is complete. A Phase 2 can be canceled if the price closes above or below the highest or lowest price from Phase 1.
Settings
3 Tickers
3 Timeframes
Show Phase 1
Show Phase 2
User-selected colors
RSI over screener (any tickers)█ OVERVIEW
This screener allow you to watch up to 240 any tickers you need to check RSI overbought and oversold using multiple periods, including the percentage of RSIs of different periods being overbought/oversold, as well as the average between these multiple RSIs.
█ THANKS
LuxAlgo for his RSI over multi length
I made function for this RSI and screener based on it.
allanster for his amazing idea how to split multiple symbols at once using a CSV list of ticker IDs
█ HOW TO USE
- hide chart:
- add 6 copies of screener
- change list number at settings from 1 to 6
- add you tickers
Screener shows signals when RSI was overbought or oversold and become to 0, this signal you may use to enter position(check other market condition before enter).
At settings you cam change Prefics, Appendix and put you tickers.
limitations are:
- max 40 tickers for one list
- max 4096 characters for one list
- tickers list should be separated by comma and may contains one space after the comma
By default it shows almost all BINANCE USD-M USDT tickers
Also you can adjust table for your screen by changing width of columns at settings.
If you have any questions or suggestions write comment or message.

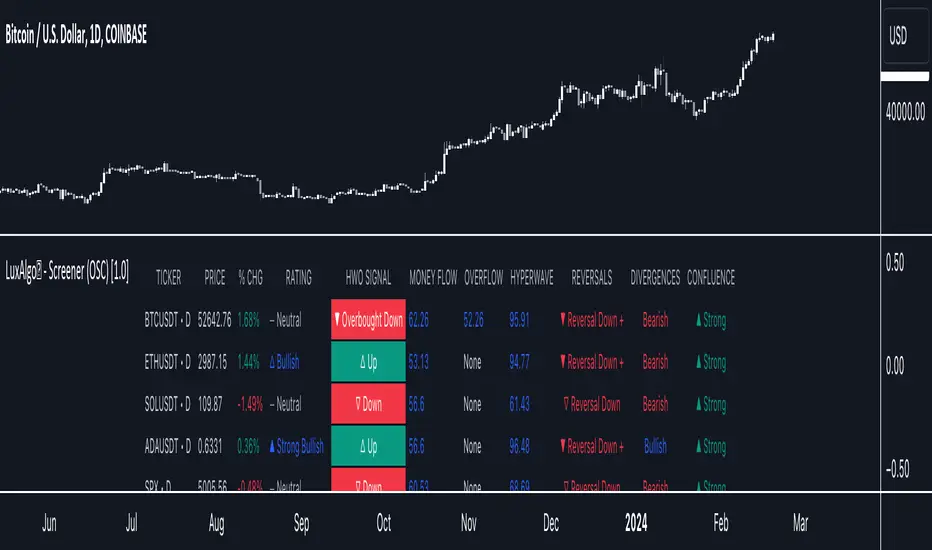
LuxAlgo® - Screener (OSC)The LuxAlgo® - Screener (OSC) is a complete tool allowing users to check returned information from the Oscillator Matrix™ toolkit's features for various user selected tickers and timeframes.
Users can customize the returned information by the screener, as well as filtering out displayed tickers based on custom user set rules.
🔶 FEATURES
Users can place the location of the screener everywhere they want, multiple locations are supported, you can even have it on your chart by drag and dropping the screener to your chart, allowing you to analyze them alongside your favorite indicators.
Keeping track of various tickers is crucial to have a deeper understanding of the overall market activity.
Our screener let you quickly access your preferred information in a convenient way thanks to the described features below:
Screening of the main Oscillator Matrix™ features on up to 10 user selected tickers and timeframes.
Ticker filtering based on custom user set rules.
Ticker sorting based on ascending/descending user selected data returned by the screener.
The LuxAlgo® - Screener (OSC) returns the following information:
Current price
Current volume
Current price percent change (% CHG)
Current price change (CHG)
Current rating
Most recent HyperWave signal
Current Money Flow value
Current Overflow value
Current HyperWave value
Most recent reversal signal
Most recent divergence
Current Confluence status
🔹 Rating
Users can quickly check the overall sentiment based on the screeners returned information by looking at the Rating column. Tickers can be rated as follows:
▲ Strong Bullish (more than 80% of the returned information is bullish)
△ Bullish (60% to 80% of the returned information is bullish)
― Neutral (40% to 60% of the returned information is bullish)
▽ Bearish (20% to 60% of the returned information is bullish)
▼ Strong Bearish (less than 20% of the returned information is bullish)
This can be a quick way to asses the confluence between all the returned information on the screener for a specific ticker.
🔹 Filtering
Thanks to the integrated filtering capabilities of the LuxAlgo® - Screener (OSC) you will be able to keep track of the information from tickers that return specific information you want to see.
For example do you want to only see the information from tickers with bullish money flow?
Nothing easier, all you need is to select the "Above" option in the Money Flow dropdown menu and set the value 50 in the input to the right.
However, you don't have to stop at 1 filtering condition, create more complex ones that fits your trading style for the tickers you truly want to look at!
🔹 Sorting
As traders we want to quickly spot the tickers with most volume, most volatility, with the strongest uptrend or downtrend.
The LuxAlgo® - Screener (OSC) lets you do that by sorting supported information in an ascending or descending order, letting you access the most relevant information faster.
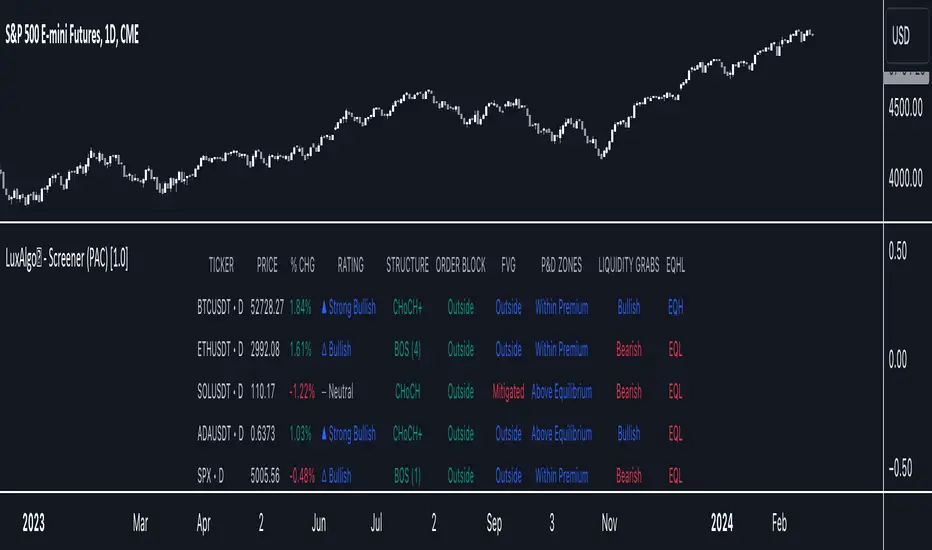
LuxAlgo® - Screener (PAC)The LuxAlgo® - Screener (PAC) is a complete tool allowing users to check returned information from the Price Action Concepts™ toolkit's features for various user selected tickers and timeframes.
Users can customize the returned information by the screener, as well as filtering out displayed tickers based on custom user set rules.
🔶 FEATURES
Users can place the location of the screener everywhere they want, multiple locations are supported, you can even have it on your chart by drag and dropping the screener to your chart, allowing you to analyze them alongside your favorite indicators.
Keeping track of various tickers is crucial to have a deeper understanding of the overall market activity.
Our screener let you quickly access your preferred information in a convenient way thanks to the described features below:
Screening of the main Price Action Concepts™ features on up to 10 user selected tickers and timeframes.
Ticker filtering based on custom user set rules.
Ticker sorting based on ascending/descending user selected data returned by the screener.
The LuxAlgo® - Screener (PAC) returns the following information:
Current price
Current volume
Current price percent change (% CHG)
Current price change (CHG)
Current rating
Most recent market structure
Most recent Order Block type and relative position to price
Order Block buy volume
Order Block sell volume
Order Block total volume
Most recent user set imbalance type status. Options include screening for FVG, Inverse FVG, Double FVG, Volume Imbalance and Opening Gap
Price position relative to Premium/Discount zones
Most recent liquidity grab
Most recent equal high/low
🔹 Rating
Users can quickly check the overall sentiment based on the screeners returned information by looking at the Rating column. Tickers can be rated as follows:
▲ Strong Bullish (more than 80% of the returned information is bullish)
△ Bullish (60% to 80% of the returned information is bullish)
― Neutral (40% to 60% of the returned information is bullish)
▽ Bearish (20% to 60% of the returned information is bullish)
▼ Strong Bearish (less than 20% of the returned information is bullish)
This can be a quick way to asses the confluence between all the returned information on the screener for a specific ticker.
🔹 Filtering
Thanks to the integrated filtering capabilities of the LuxAlgo® - Screener (PAC) you will be able to keep track of the information from tickers that return specific information you want to see.
For example do you want to only see the information from up trending tickers? Nothing easier, all you need is to select the up trending related options (▲ Strong Bullish or △ Bullish) in the rating dropdown menu.
However, you don't have to stop at 1 filtering condition, create more complex ones that fits your trading style for the tickers you truly want to look at!
🔹 Sorting
As traders we want to quickly spot the tickers with most volume, most volatility, with the strongest uptrend or downtrend.
The LuxAlgo® - Screener (PAC) lets you do that by sorting supported information in an ascending or descending order, letting you access the most relevant information faster.
LuxAlgo® - Screener (S&O)The LuxAlgo® - Screener (S&O) is a complete tool allowing users to check returned information from Signals & Overlays™ features for various user selected tickers and timeframes.
Users can customize the returned information by the screener, as well as filtering out displayed tickers based on custom user set rules.
🔶 FEATURES
Users can place the location of the screener everywhere they want, multiple locations are supported, you can even have it on your chart by drag and dropping the screener to your chart, allowing you to analyze them alongside your favorite indicators.
Keeping track of various tickers is crucial to have a deeper understanding of the overall market activity.
Our screener let you quickly access your preferred information in a convenient way thanks to the described features below:
Screening of the main Signals & Overlays™ features on up to 10 user selected tickers and timeframes.
Ticker filtering based on custom user set rules.
Ticker sorting based on ascending/descending user selected data returned by the screener.
The LuxAlgo® - Screener (S&O) returns the following information:
Current price
Current volume
Current price percent change (% CHG)
Current price change (CHG)
Current rating
Most recent signal
Number of Exits since most recent signals
Current Smart Trail status
Current Reversal Zones status
Current Trend Catcher status
Current Trend Tracer status
Current Neo Cloud status
Current Trend Strength value
Current Lux Volatility value
Current Squeeze Index value
Current Volume Sentiment value
🔹 Rating
Users can quickly check the overall sentiment based on the screeners returned information by looking at the Rating column. Tickers can be rated as follows:
▲ Strong Bullish (more than 80% of the returned information is bullish)
△ Bullish (60% to 80% of the returned information is bullish)
― Neutral (40% to 60% of the returned information is bullish)
▽ Bearish (20% to 60% of the returned information is bullish)
▼ Strong Bearish (less than 20% of the returned information is bullish)
This can be a quick way to asses the confluence between all the returned information on the screener for a specific ticker.
🔹 Filtering
Thanks to the integrated filtering capabilities of the LuxAlgo® - Screener (S&O) you will be able to keep track of the information from tickers that return specific information you want to see.
For example do you want to only see the information from up trending tickers? Nothing easier, all you need is to select the up trending related options (▲ Strong Bullish or △ Bullish) in the rating dropdown menu.
However you don't have to stop at 1 filtering condition, create more complex ones that fits your trading style for the tickers you truly want to look at!
🔹 Sorting
As traders we want to quickly spot the tickers with most volume, most volatility, with the strongest uptrend or downtrend.
The LuxAlgo® - Screener (S&O) lets you do that by sorting supported information in an ascending or descending order, letting you access the most relevant information faster.

How To Input CSV List Of Symbol Data Used For ScreenerExample of how to input multiple symbols at once using a CSV list of ticker IDs. The input list is extracted into individual ticker IDs which are then each used within an example screener function that calculates their rate of change. The results for each of the rate of changes are then plotted.
For code brevity this example only demonstrates using up to 4 symbols, but the logic is annotated to show how it can easily be expanded for use with up to 40 ticker IDs.
The CSV list used for input may contain spaces or no spaces after each comma separator, but whichever format (space or no space) is used must be used consistently throughout the list. If the list contains any invalid symbols the script will display a red exclamation mark that when clicked will display those invalid symbols.
If more than 4 ticker IDs are input then only the first 4 are used. If less than 4 ticker IDs are used then the unused screener calls will return `float(na)`. In the published chart the input list is using only 3 ticker IDs so there are only 3 plots shown instead of 4.
NOTICE: This is an example script and not meant to be used as an actual strategy. By using this script or any portion thereof, you acknowledge that you have read and understood that this is for research purposes only and I am not responsible for any financial losses you may incur by using this script!

Cobra's CryptoMarket VisualizerCobra's Crypto Market Screener is designed to provide a comprehensive overview of the top 40 marketcap cryptocurrencies in a table\heatmap format. This indicator incorporates essential metrics such as Beta, Alpha, Sharpe Ratio, Sortino Ratio, Omega Ratio, Z-Score, and Average Daily Range (ADR). The table utilizes cell coloring resembling a heatmap, allowing for quick visual analysis and comparison of multiple cryptocurrencies.
The indicator also includes a shortened explanation tooltip of each metric when hovering over it's respected cell. I shall elaborate on each here for anyone interested.
Metric Descriptions:
1. Beta: measures the sensitivity of an asset's returns to the overall market returns. It indicates how much the asset's price is likely to move in relation to a benchmark index. A beta of 1 suggests the asset moves in line with the market, while a beta greater than 1 implies the asset is more volatile, and a beta less than 1 suggests lower volatility.
2. Alpha: is a measure of the excess return generated by an investment compared to its expected return, given its risk (as indicated by its beta). It assesses the performance of an investment after adjusting for market risk. Positive alpha indicates outperformance, while negative alpha suggests underperformance.
3. Sharpe Ratio: measures the risk-adjusted return of an investment or portfolio. It evaluates the excess return earned per unit of risk taken. A higher Sharpe ratio indicates better risk-adjusted performance, as it reflects a higher return for each unit of volatility or risk.
4. Sortino Ratio: is a risk-adjusted measure similar to the Sharpe ratio but focuses only on downside risk. It considers the excess return per unit of downside volatility. The Sortino ratio emphasizes the risk associated with below-target returns and is particularly useful for assessing investments with asymmetric risk profiles.
5. Omega Ratio: measures the ratio of the cumulative average positive returns to the cumulative average negative returns. It assesses the reward-to-risk ratio by considering both upside and downside performance. A higher Omega ratio indicates a higher reward relative to the risk taken.
6. Z-Score: is a statistical measure that represents the number of standard deviations a data point is from the mean of a dataset. In finance, the Z-score is commonly used to assess the financial health or risk of a company. It quantifies the distance of a company's financial ratios from the average and provides insight into its relative position.
7. Average Daily Range: ADR represents the average range of price movement of an asset during a trading day. It measures the average difference between the high and low prices over a specific period. Traders use ADR to gauge the potential price range within which an asset might fluctuate during a typical trading session.
Utility:
Comprehensive Overview: The indicator allows for monitoring up to 40 cryptocurrencies simultaneously, providing a consolidated view of essential metrics in a single table.
Efficient Comparison: The heatmap-like coloring of the cells enables easy visual comparison of different cryptocurrencies, helping identify relative strengths and weaknesses.
Risk Assessment: Metrics such as Beta, Alpha, Sharpe Ratio, Sortino Ratio, and Omega Ratio offer insights into the risk associated with each cryptocurrency, aiding risk assessment and portfolio management decisions.
Performance Evaluation: The Alpha, Sharpe Ratio, and Sortino Ratio provide measures of a cryptocurrency's performance adjusted for risk. This helps assess investment performance over time and across different assets.
Market Analysis: By considering the Z-Score and Average Daily Range (ADR), traders can evaluate the financial health and potential price volatility of cryptocurrencies, aiding in trade selection and risk management.
Features:
Reference period optimization, alpha and ADR in particular
Source calculation
Table sizing and positioning options to fit the user's screen size.
Tooltips
Important Notes -
1. The Sharpe, Sortino and Omega ratios cell coloring threshold might be subjective, I did the best I can to gauge the median value of each to provide more accurate coloring sentiment, it may change in the future.
The median values are : Sharpe -1, Sortino - 1.5, Omega - 20.
2. Limitations - Some cryptos have a Z-Score value of NaN due to their short lifetime, I tried to overcome this issue as with the rest of the metrics as best I can. Moreover, it limits the time horizon for replay mode to somewhere around Q3 of 2021 and that's with using the split option of the top half, to remain with the older cryptos.
3. For the beginner Pine enthusiasts, I recommend scimming through the script as it serves as a prime example of using key features, to name a few : Arrays, User Defined Functions, User Defined Types, For loops, Switches and Tables.
4. Beta and Alpha's benchmark instrument is BTC, due to cryptos volatility I saw no reason to use SPY or any other asset for that matter.

BE - Pr_DayLowHigh_BreakoutScreener AlgoHerewith presenting the Screener based indicator which supports Algo trade on the NSE stocks. The idea behind this indicator is when the Current day stock breaks out of Yesterday's high or Low with promising volumes (Using MA's and POC of Volume Profile) along with formation of candle Pattern. Initiates the Trade entries.
Note: Indicator is designed to take an entry even before the candle is closed as soon as the entry level is crossed and it shall exit the trade as soon as the SL is hit even before candle is close.
How to Work with this Indicator.
You can map up to 15 Scripts in this indicator. However you may decide if you wish to load all 15 are few of them. if you wish to load only 10, below settings should help you ignore the rest 10 symbols from screening it for setups
Updating Symbol Script.
This is an important part is used for Algo trades. Read the tooltip for better understanding of the format. Acceptable format is Broker Name followed with : and space with Symbol mapping Name followed with / and Instrument token provided by broker if no token alloted for the script then you may keep 0 against symbol name followed with / and Qty in terms of absolute value or in terms of percentage.
Trade and Scan Settings
Symbol List Mapping
For Improvements in Results - Use Events and keep a track of it / use Nudges etc.

Ultimate Custom MTF ScreenerThis indicator will allow you to make your custom TradingView MTF screener without coding. Add it to the chart, select up to 10 instruments, 4 timeframes, and 4 indicators, and the screener will do the rest for you. The indicator will form a lovely table with all values and highlighted signals.
The screener is highly customizable, and you can choose its position on the chart, sorting, order of the columns, and colors for the tables. You can easily change parameters for all supported indicators and their signals.
Currently, there are 21 different custom indicators available. Current list of indicators:
Average Directional Index (ADX) - displaying the value of ADX and checking if it's higher than the threshold
Average True Range (ATR) - showing the value of ATR
Awesome Oscillator (AO) - displaying the value of AO and highlighting positive/negative values.
Bollinger Bands (BB) - showing if the price is above/below/in the channel.
Breakout Pivots - Displaying when the price is below/above the most recent pivot low/high.
Commodity Channel Index (CCI) - shows the last CCI value and highlights overbought/oversold values.
Directional Movement Index (DMI) - Up/Down signal (+DI above or below -DI)
Donchian Channel (DC) - showing if the price is above/below/in the channel.
Heikin Ashi Count (HAC) - What is the current Heikin Ashi candle color and for how long was this color?
Historical Volatility (HV) - Current value of Historical Volatility
Keltner Channel (KC) -showing if the price is above/below/in the channel.
Moving Average Convergence Divergence (MACD) - Up/Down signal (MACD above / below signal)
Moving Average Crossover (MA Cross) - Displaying MA crosses signals (SMA, EMA, WMA, HMA, VWMA, SMMA, DEMA, VWAP supported)
Moving Average Distance (MA DIST) - Displaying distance to the MA (SMA, EMA, WMA, HMA, VWMA, SMMA, DEMA, VWAP supported)
Parabolic Stop and Reverse (PSAR) - Up or Down
Relative Strength Index (RSI) - Displaying the last RSI value and highlighting overbought/oversold values.
Stochastic (STOCH) - Displaying the last Stochastic value and highlighting overbought/oversold values.
Stochastic RSI (STOCH RSI) - Displaying the last Stochastic RSI value and highlighting overbought/oversold values.
SuperTrend - Current state of the SuperTrend.
Trailing Stop-Loss (TSL) - Up or Down
True Strength Index (TSI) - Displaying the last TSI value and highlighting overbought/oversold values.
We're already working on adding a few more supported indicators. If you have any ideas about the indicators you want to see in our screener, contact us, and we'll consider them.
Disclaimer
Please remember that past performance may not be indicative of future results.
Due to various factors, including changing market conditions, the strategy may no longer perform as well as in historical backtesting.
This post and the script don’t provide any financial advice.

Custom Multi-Timeframe IndicatorIt's a pretty simple example of a nice custom screener you can run for multiple timeframes. This is an RSI screener, but you can easily change the function for your own Indicator.
Screener displays:
Last value of the instrument
RSI value for up to 10 instruments / 4 timeframes.
In Parameters you can change:
4 timeframes
10 instruments
Parameters for RSI
Styling parameters for table
If the selected timeframe will be lower than the current one you will receive a warning message in a table.
Thanks to @MUQWISHI to help me code it.
Disclaimer
Please remember that past performance may not be indicative of future results.
Due to various factors, including changing market conditions, the strategy may no longer perform as well as in historical backtesting.
This post and the script don’t provide any financial advice.

Screener for 40+ instrumentsAs you probably know in TradingView there is a limit of 40 instruments in one custom screener.
I created a script that will allow you to scan more symbols.
The idea of it is pretty simple. You have to add a screener a few times on your screen with a different set of symbols. Then select column width (as % of your chart width) and # of the screener right to left.
Script will plot #1 screener next to the right border. For #2 and all next tables, the script will compute the needed offset and will draw it on the left. This way it will look like one table and not a few separate indicators.
I created a script with an RSI screener, but you can create more complicated examples with it.
Off course, that's not a silver bullet solution but might work for some of you.
Disclaimer
Please remember that past performance may not be indicative of future results.
Due to various factors, including changing market conditions, the strategy may no longer perform as well as in historical backtesting.
This post and the script don’t provide any financial advice.
