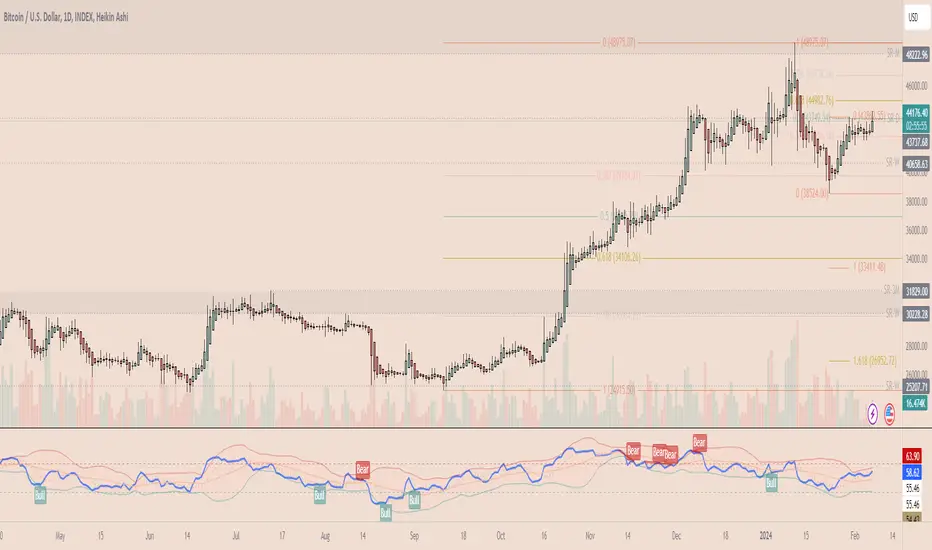
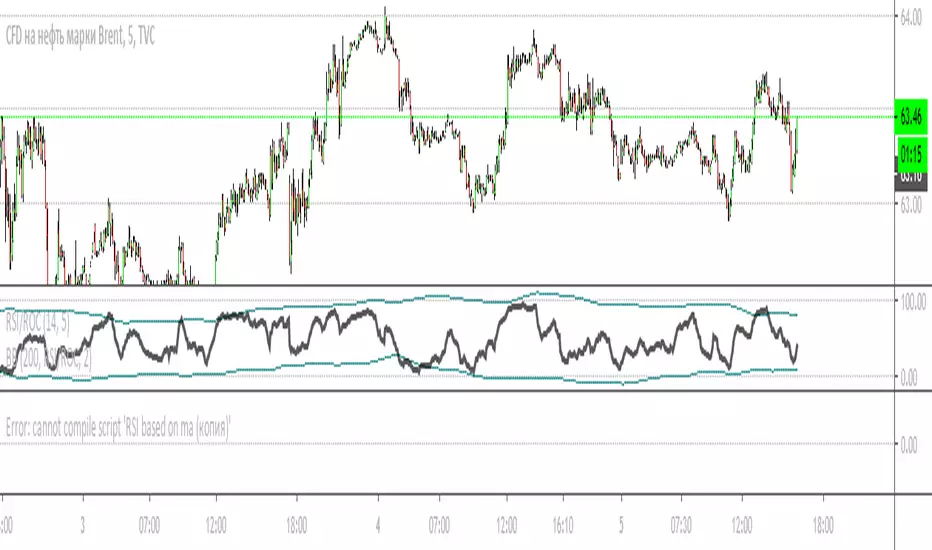
RSI BAR COLOR (KETT)RSI BAR COLOR
1) White - looking for a long
2) Orange - looking for a short
3) Gray - think
//-----------
1) Белый - ищем вход в LONG
2) Оранжевый - ищем вход в SHORT
3) Серый - думаем
Cari dalam skrip untuk "勺设股份的RSI指标分析"
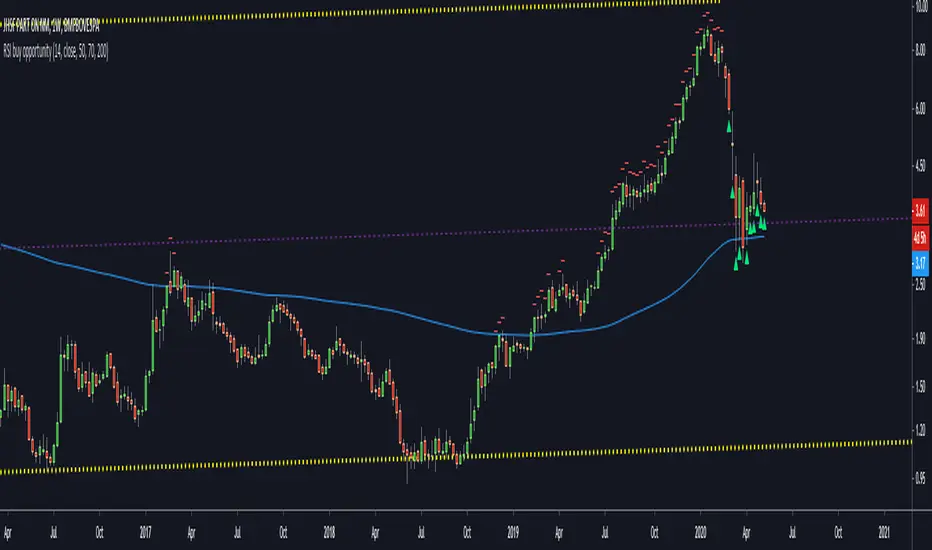
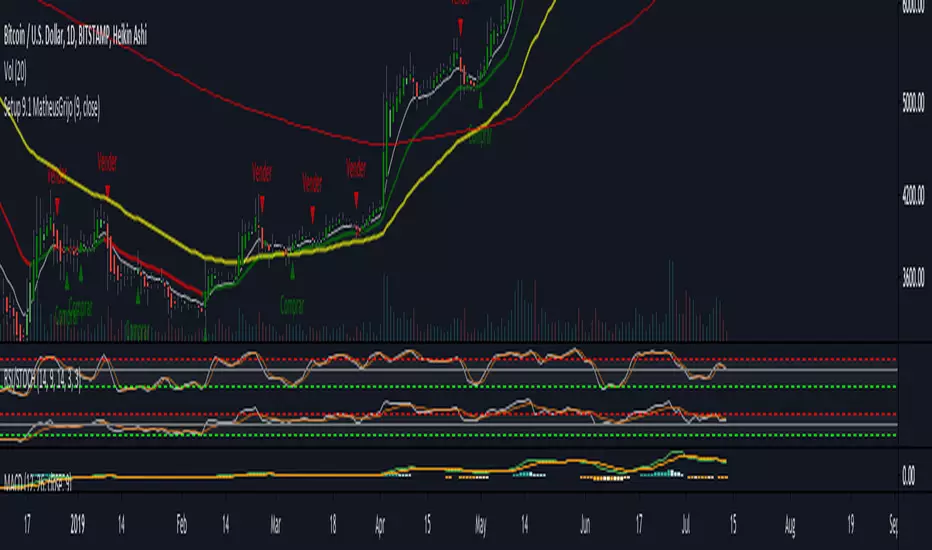
RSI buy opportunityRSI buy opportunity is an indicator to look for the best entries on weekly charts.
It depends on each stock and the values should change to optimize the entry.
Buy when green triangle shows up.
Never buy when red signal appears.


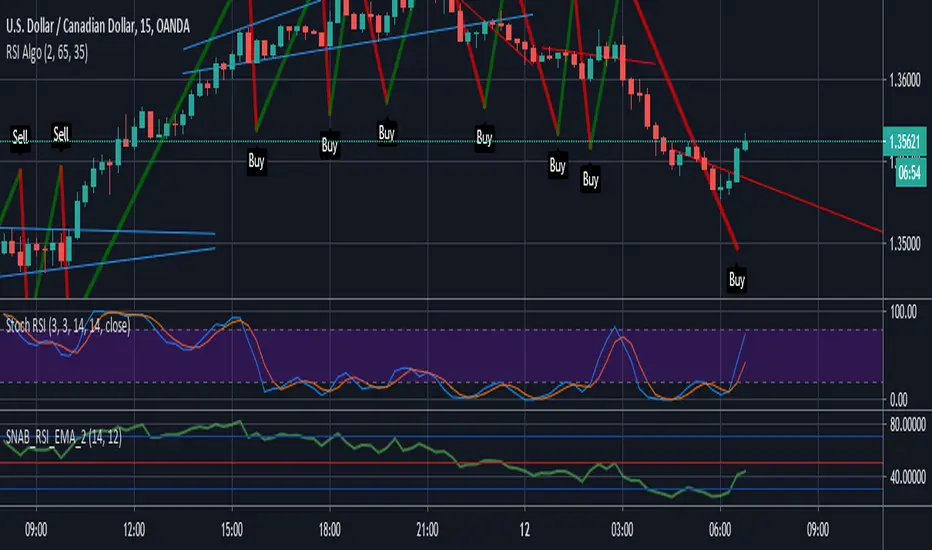
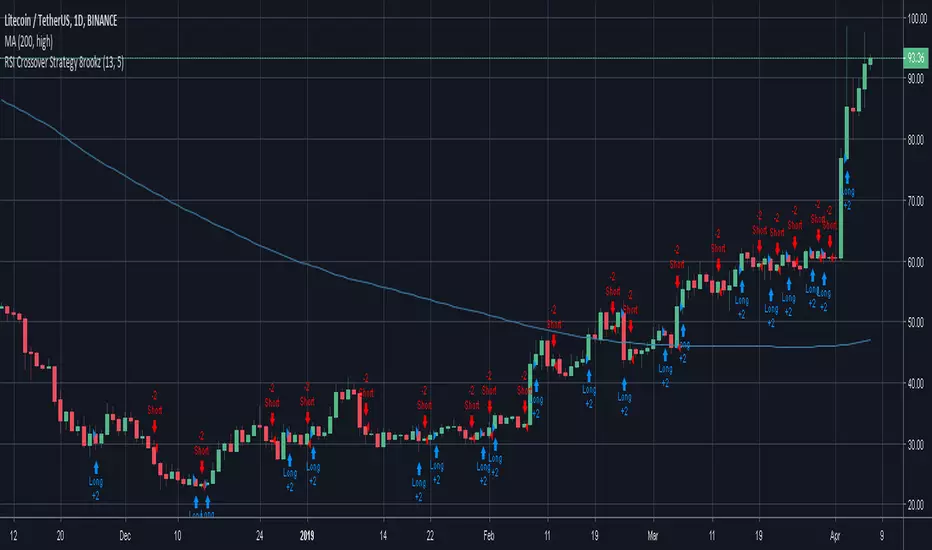
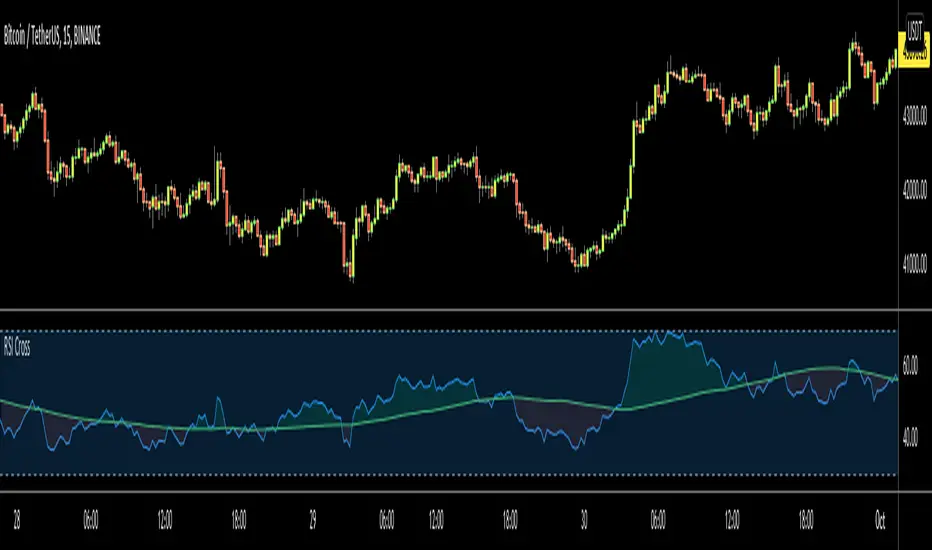
RSI Crossover Strategy 8rookzRSI Crossover Strategy
used to create entry points for increasing relative strength


RSI TRI With Mid Point and HighlightsRSI that has the 50 line plotted plus it highlights overbought and oversold conditions.