Reversal + Confirm ZonesThis script is written in Pine Script (version 5) for TradingView and creates an indicator called **"Reversal + Confirm Zones"**. It overlays visual zones on a price chart to identify potential reversal points and confirmation signals for trading. The indicator combines **Bollinger Bands** and **RSI** to detect overbought/oversold conditions (reversal zones) and uses **EMA crosses** and **MACD zero-line crosses** to confirm bullish or bearish trends. Below is a detailed explanation:
---
### **1. Purpose**
- The script highlights:
- **Reversal Zones**: Areas where the price might reverse due to being overbought (green) or oversold (red).
- **Confirmation Zones**: Areas where a trend reversal is confirmed using EMA and MACD signals (green for bullish, red for bearish).
- It provides visual backgrounds and alerts to assist traders in spotting potential trade setups.
---
### **2. Components**
The script is divided into two main parts: **Reversal Logic** and **Confirmation Logic**.
---
### **3. Reversal Logic (Red & Green Zones)**
#### **Bollinger Bands**
- **Parameters**:
- Length: 20 periods.
- Source: Closing price (`close`).
- Multiplier: 2.0 (standard deviations).
- **Calculation**:
- `basis`: 20-period Simple Moving Average (SMA).
- `dev`: 2 times the standard deviation of the price over 20 periods.
- `upper`: `basis + dev` (upper band).
- `lower`: `basis - dev` (lower band).
- **Purpose**: Identifies when the price moves outside the normal range (beyond 2 standard deviations).
#### **Relative Strength Index (RSI)**
- **Parameters**:
- Length: 14 periods.
- Low Threshold: 30 (oversold).
- High Threshold: 70 (overbought).
- **Calculation**: `rsiValue = ta.rsi(close, rsiLength)`.
- **Purpose**: Measures momentum to confirm overbought or oversold conditions.
#### **Zone Conditions**
- **Red Zone (Oversold)**:
- Condition: `close < lower` (price below lower Bollinger Band) AND `rsiValue < rsiLowThreshold` (RSI < 30).
- Visual: Light red background (`color.new(color.red, 80)`).
- Alert: "Deep Oversold Signal triggered!".
- **Green Zone (Overbought)**:
- Condition: `close > upper` (price above upper Bollinger Band) AND `rsiValue > rsiHighThreshold` (RSI > 70).
- Visual: Light green background (`color.new(color.green, 80)`).
- Alert: "Deep Overbought Signal triggered!".
#### **Interpretation**
- Red Zone: Suggests the price is oversold and may reverse upward.
- Green Zone: Suggests the price is overbought and may reverse downward.
---
### **4. Confirmation Logic (EMA and MACD Crosses)**
#### **Exponential Moving Averages (EMAs)**
- **Parameters**:
- Short EMA Length: 9 periods (user adjustable).
- Long EMA Length: 21 periods (user adjustable).
- **Calculation**:
- `emaShort = ta.ema(close, emaShortLength)`.
- `emaLong = ta.ema(close, emaLongLength)`.
- **Conditions**:
- **Bullish EMA Cross**: `emaCrossBullish = ta.crossover(emaShort, emaLong)` (9 EMA crosses above 21 EMA).
- **Bearish EMA Cross**: `emaCrossBearish = ta.crossunder(emaShort, emaLong)` (9 EMA crosses below 21 EMA).
#### **MACD**
- **Parameters**:
- Fast Length: 12 periods (user adjustable).
- Slow Length: 26 periods (user adjustable).
- Signal Smoothing: 9 periods (user adjustable).
- **Calculation**:
- ` = ta.macd(close, macdFastLength, macdSlowLength, macdSignalSmoothing)`.
- Only the MACD line and signal line are used; the histogram is ignored (`_`).
- **Conditions**:
- **Bullish MACD Cross**: `macdCrossBullish = ta.crossover(macdLine, 0)` (MACD crosses above zero).
- **Bearish MACD Cross**: `macdCrossBearish = ta.crossunder(macdLine, 0)` (MACD crosses below zero).
#### **Combined Confirmation Conditions**
- **Bullish Confirmation**:
- Condition: `bullishConfirmation = emaCrossBullish and macdCrossBullish`.
- Visual: Very light green background (`color.new(color.green, 90)`).
- Meaning: A bullish trend is confirmed when the 9 EMA crosses above the 21 EMA AND the MACD crosses above zero.
- **Bearish Confirmation**:
- Condition: `bearishConfirmation = emaCrossBearish and macdCrossBearish`.
- Visual: Very light red background (`color.new(color.red, 90)`).
- Meaning: A bearish trend is confirmed when the 9 EMA crosses below the 21 EMA AND the MACD crosses below zero.
---
### **5. Visual Outputs**
- **Reversal Zones**:
- Red background for oversold conditions.
- Green background for overbought conditions.
- **Confirmation Zones**:
- Light green background for bullish confirmation.
- Light red background for bearish confirmation.
- Note: The script does not plot the Bollinger Bands, EMAs, or MACD lines—only the background zones are visualized.
---
### **6. Alerts**
- **Deep Oversold Alert**: Triggers when the red zone condition is met.
- **Deep Overbought Alert**: Triggers when the green zone condition is met.
- No alerts are set for the confirmation zones (EMA/MACD crosses).
---
### **7. How It Works**
1. **Reversal Detection**:
- The script uses Bollinger Bands and RSI to flag extreme price levels (red for oversold, green for overbought).
- These zones suggest potential reversals but are not confirmed yet.
2. **Trend Confirmation**:
- EMA crosses (9/21) and MACD zero-line crosses provide confirmation of a trend direction.
- Bullish confirmation (green) occurs when both indicators align upward.
- Bearish confirmation (red) occurs when both indicators align downward.
3. **Trading Strategy**:
- Look for a red zone (oversold) followed by a bullish confirmation for a potential long entry.
- Look for a green zone (overbought) followed by a bearish confirmation for a potential short entry.
---
### **8. How to Use**
1. Add the script to TradingView.
2. Adjust inputs (EMA lengths, MACD settings) if desired.
3. Monitor the chart:
- Red zones indicate oversold conditions—watch for a potential upward reversal.
- Green zones indicate overbought conditions—watch for a potential downward reversal.
- Light green/red backgrounds confirm the trend direction after a reversal zone.
4. Set up alerts for oversold/overbought conditions to catch reversal signals early.
---
### **9. Key Features**
- **Dual Purpose**: Combines reversal detection (Bollinger Bands + RSI) with trend confirmation (EMA + MACD).
- **Visual Simplicity**: Uses background colors instead of plotting lines, keeping the chart clean.
- **Customizable**: Allows users to tweak EMA and MACD periods.
- **Alerts**: Notifies users of extreme conditions for timely action.
---
### **10. Limitations**
- No plotted indicators (e.g., Bollinger Bands, EMAs, MACD) for visual reference—relies entirely on background shading.
- Confirmation signals (EMA/MACD) may lag behind reversal zones, potentially missing fast reversals.
- No alerts for confirmation zones, limiting real-time notification of trend confirmation.
This script is ideal for traders who want a straightforward way to spot potential reversals and confirm them with trend-following indicators, all overlaid on the price chart.
Cari dalam skrip untuk "北京地铁3号线和12号线线路图"

Moving Average Convergence DivergenceThis script is written in Pine Script (version 6) for TradingView and implements the **Moving Average Convergence Divergence (MACD)** indicator. The MACD is a popular momentum oscillator used to identify trend direction, strength, and potential reversals. This version includes customizable inputs, visual enhancements (like crossover markers), and alerts for key events. Below is a detailed explanation of the script:
---
### **1. Purpose**
- The script calculates and displays the MACD line, signal line, and histogram.
- It highlights key events such as MACD/signal line crossovers and zero-line crosses with shapes and colors.
- It provides alerts for changes in the histogram's direction (rising to falling or vice versa).
---
### **2. User Inputs**
- **Fast Length**: Period for the fast moving average (default: 12).
- **Slow Length**: Period for the slow moving average (default: 26).
- **Source**: Data input for calculation (default: closing price, `close`).
- **Signal Smoothing**: Period for the signal line (default: 9, range: 1–50).
- **Oscillator MA Type**: Type of moving average for MACD calculation (options: SMA or EMA, default: EMA).
- **Signal Line MA Type**: Type of moving average for the signal line (options: SMA or EMA, default: EMA).
---
### **3. MACD Calculation**
The MACD is calculated in three parts:
1. **MACD Line**: Difference between the fast and slow moving averages.
- Fast MA: Either SMA or EMA of the source over `fast_length`.
- Slow MA: Either SMA or EMA of the source over `slow_length`.
- Formula: `macd = fast_ma - slow_ma`.
2. **Signal Line**: A moving average (SMA or EMA) of the MACD line over `signal_length`.
- Formula: `signal = sma_signal == "SMA" ? ta.sma(macd, signal_length) : ta.ema(macd, signal_length)`.
3. **Histogram**: Difference between the MACD line and the signal line.
- Formula: `hist = macd - signal`.
---
### **4. Key Events Detection**
#### **MACD/Signal Line Crossovers**
- **Bullish Cross**: MACD crosses above the signal line (`ta.crossover(macd, signal)`).
- **Bearish Cross**: MACD crosses below the signal line (`ta.crossunder(macd, signal)`).
#### **Zero Line Crosses**
- **Cross Above Zero**: MACD crosses above 0 (`ta.crossover(macd, 0)`).
- **Cross Below Zero**: MACD crosses below 0 (`ta.crossunder(macd, 0)`).
---
### **5. Colors**
- **MACD Line**: Green (#089981) if MACD > signal (bullish), red (#f23645) if MACD < signal (bearish).
- **Signal Line**: White (`color.white`).
- **Histogram**:
- Positive (MACD > signal): Light green (#B2DFDB) if decreasing, darker green (#26A69A) if increasing.
- Negative (MACD < signal): Light red (#FFCDD2) if increasing in magnitude, darker red (#FF5252) if decreasing in magnitude.
- **Zero Line**: Gray with 50% transparency (`color.new(#787B86, 50)`).
---
### **6. Visual Outputs**
#### **Plotted Lines**
- **MACD Line**: Plotted with dynamic coloring based on its position relative to the signal line.
- **Signal Line**: Plotted in white.
- **Histogram**: Displayed as columns, with colors indicating direction and momentum.
- **Zero Line**: Horizontal line at 0 for reference.
#### **Shapes for Key Events**
- **Bullish Cross Below Zero**: Green circle on the MACD line when MACD crosses above the signal line while still below zero.
- **Bearish Cross Above Zero**: Red circle on the MACD line when MACD crosses below the signal line while still above zero.
- **Cross Above Zero**: Green upward label at the zero line when MACD crosses above 0.
- **Cross Below Zero**: Red downward label at the zero line when MACD crosses below 0.
---
### **7. Alerts**
- **Rising to Falling**: Triggers when the histogram switches from positive (or zero) to negative.
- Condition: `hist >= 0 and hist < 0`.
- Message: "MACD histogram switched from rising to falling".
- **Falling to Rising**: Triggers when the histogram switches from negative (or zero) to positive.
- Condition: `hist <= 0 and hist > 0`.
- Message: "MACD histogram switched from falling to rising".
---
### **8. How It Works**
1. **Trend Direction**:
- MACD above signal line (green) suggests bullish momentum.
- MACD below signal line (red) suggests bearish momentum.
2. **Momentum Strength**:
- Histogram height shows the strength of the momentum (larger bars = stronger momentum).
- Histogram color changes indicate whether momentum is increasing or decreasing.
3. **Reversal Signals**:
- Crossovers between MACD and signal lines often signal potential trend changes.
- Zero-line crosses indicate shifts between bullish (above 0) and bearish (below 0) territory.
---
### **9. How to Use**
1. Add the script to TradingView.
2. Adjust inputs (e.g., fast/slow lengths, MA types) to suit your trading style.
3. Monitor the chart:
- Green MACD and upward histogram bars suggest bullish conditions.
- Red MACD and downward histogram bars suggest bearish conditions.
- Watch for circles (crossovers) and labels (zero-line crosses) for trade signals.
4. Set up alerts to notify you of histogram direction changes.
---
### **10. Key Features**
- **Customization**: Flexible MA types and periods.
- **Visual Clarity**: Dynamic colors and shapes highlight key events.
- **Alerts**: Notifies users of momentum shifts via histogram changes.
- **Intuitive**: Combines all MACD components (line, signal, histogram) in one indicator.
This script is ideal for traders who rely on MACD for momentum analysis and want clear visual cues and alerts for decision-making.

Composite Reversal IndicatorOverview
The "Composite Reversal Indicator" aggregates five technical signals to produce a composite score that ranges from -5 (strongly bearish) to +5 (strongly bullish). These signals come from:
Relative Strength Index (RSI)
Moving Average Convergence Divergence (MACD)
Accumulation/Distribution (A/D)
Volume relative to its moving average
Price proximity to support and resistance levels
Each signal contributes a value of +1 (bullish), -1 (bearish), or 0 (neutral) to the total score. The raw score is plotted as a histogram, and a smoothed version is plotted as a colored line to highlight trends.
Step-by-Step Explanation
1. Customizable Inputs
The indicator starts with user-defined inputs that allow traders to tweak its settings. These inputs include:
RSI: Length (e.g., 14), oversold level (e.g., 30), and overbought level (e.g., 70).
MACD: Fast length (e.g., 12), slow length (e.g., 26), and signal length (e.g., 9).
Volume: Moving average length (e.g., 20) and multipliers for high (e.g., 1.5) and low (e.g., 0.5) volume thresholds.
Price Levels: Period for support and resistance (e.g., 50) and proximity percentage (e.g., 2%).
Score Smoothing: Length for smoothing the score (e.g., 5).
These inputs make the indicator adaptable to different trading styles, assets, or timeframes.
2. Indicator Calculations
The script calculates five key indicators using the input parameters:
RSI: Measures momentum and identifies overbought or oversold conditions.
Formula: rsi = ta.rsi(close, rsi_length)
Example: With a length of 14, it analyzes the past 14 bars of closing prices.
MACD: Tracks trend and momentum using two exponential moving averages (EMAs).
Formula: = ta.macd(close, macd_fast, macd_slow, macd_signal)
Components: MACD line (fast EMA - slow EMA), signal line (EMA of MACD line).
Accumulation/Distribution (A/D): A volume-based indicator showing buying or selling pressure.
Formula: ad = ta.accdist
Reflects cumulative flow based on price and volume.
Volume Moving Average: A simple moving average (SMA) of trading volume.
Formula: vol_ma = ta.sma(volume, vol_ma_length)
Example: A 20-bar SMA smooths volume data.
Support and Resistance Levels: Key price levels based on historical lows and highs.
Formulas:
support = ta.lowest(low, price_level_period)
resistance = ta.highest(high, price_level_period)
Example: Over 50 bars, it finds the lowest low and highest high.
These calculations provide the raw data for generating signals.
3. Signal Generation
Each indicator produces a signal based on specific conditions:
RSI Signal:
+1: RSI < oversold level (e.g., < 30) → potential bullish reversal.
-1: RSI > overbought level (e.g., > 70) → potential bearish reversal.
0: Otherwise.
Logic: Extreme RSI values suggest price may reverse.
MACD Signal:
+1: MACD line > signal line → bullish momentum.
-1: MACD line < signal line → bearish momentum.
0: Equal.
Logic: Crossovers indicate trend shifts.
A/D Signal:
+1: Current A/D > previous A/D → accumulation (bullish).
-1: Current A/D < previous A/D → distribution (bearish).
0: Unchanged.
Logic: Rising A/D shows buying pressure.
Volume Signal:
+1: Volume > high threshold (e.g., 1.5 × volume MA) → strong activity (bullish).
-1: Volume < low threshold (e.g., 0.5 × volume MA) → weak activity (bearish).
0: Otherwise.
Logic: Volume spikes often confirm reversals.
Price Signal:
+1: Close near support (within proximity %, e.g., 2%) → potential bounce.
-1: Close near resistance (within proximity %) → potential rejection.
0: Otherwise.
Logic: Price near key levels signals reversal zones.
4. Composite Score
The raw composite score is the sum of the five signals:
Formula: score = rsi_signal + macd_signal + ad_signal + vol_signal + price_signal
Range: -5 (all signals bearish) to +5 (all signals bullish).
Purpose: Combines multiple perspectives into one number.
5. Smoothed Score
A smoothed version of the score reduces noise:
Formula: score_ma = ta.sma(score, score_ma_length)
Example: With a length of 5, it averages the score over 5 bars.
Purpose: Highlights the trend rather than short-term fluctuations.
6. Visualization
The indicator plots two elements:
Raw Score: A gray histogram showing the composite score per bar.
Style: plot.style_histogram
Color: Gray.
Smoothed Score: A line that changes color:
Green: Score > 0 (bullish).
Red: Score < 0 (bearish).
Gray: Score = 0 (neutral).
Style: plot.style_line, thicker line (e.g., linewidth=2).
These visuals make it easy to spot potential reversals.
How It Works Together
The indicator combines signals from:
RSI: Momentum extremes.
MACD: Trend shifts.
A/D: Buying/selling pressure.
Volume: Confirmation of moves.
Price Levels: Key reversal zones.
By summing these into a composite score, it filters out noise and provides a unified signal. A high positive score (e.g., +3 to +5) suggests a bullish reversal, while a low negative score (e.g., -3 to -5) suggests a bearish reversal. The smoothed score helps traders focus on the trend.
Practical Use
Bullish Reversal: Smoothed score is green and rising → look for buying opportunities.
Bearish Reversal: Smoothed score is red and falling → consider selling or shorting.
Neutral: Score near 0 → wait for clearer signals.
Traders can adjust inputs to suit their strategy, making it versatile for stocks, forex, or crypto.

Master Global Liquidity Shifted 75 DaysThe Global Liquidity Index is a Pine Script (version 5) technical indicator designed to measure and visualize global financial liquidity by aggregating data from various central bank balance sheets and money supply metrics. The indicator is plotted as an overlay on the price chart using the left scale, with the entire line shifted left by 75 days.
Key features:
Data Sources: Incorporates balance sheet data from major central banks including the Federal Reserve (FED), European Central Bank (ECB), People's Bank of China (PBC), Bank of Japan (BOJ), and other central banks, along with optional M2 money supply data from various countries.
Components: Includes options to toggle specific liquidity factors such as FED balance sheet, Treasury General Account (TGA), Reverse Repurchase Agreements (RRP), and regional M2 money supplies, all converted to USD.
75-Day Shift: The indicator's output is shifted left by 75 days on the chart, aligning historical liquidity data with earlier price action, with this shift period adjustable via the "Shift Days Left" input.
Calculations:
Computes a total liquidity value by summing enabled central bank and M2 data (adjusted for RRP and TGA as drains)
Scales the total by dividing by 1 trillion (10^12)
Applies a Simple Moving Average (SMA) and Rate of Change (ROC) with user-defined periods
Final output is either the SMA of ROC or SMA alone, depending on ROC length
Visualization: Plots the shifted result as a yellow line with a linewidth of 2.

True Open CalculationsIndicator Description: True Open Calculations
This custom Pine Script indicator calculates and plots key "True Open" levels based on specific time intervals and trading sessions. The True Open levels represent significant price points on the chart, helping traders identify key reference points tied to various market opening times. These levels are important for understanding price action in relation to market sessions and trading cycles. The indicator is designed to plot lines corresponding to different "True Opens" on the chart and display labels with the associated information.
Key Features:
True Year Open:
This represents the opening price on the first Monday of April each year. It serves as a reference point for the yearly price level.
Plot Color: Green.
True Month Open:
This represents the opening price on the second Monday of each month. It helps in identifying monthly trends and provides a key reference for monthly price movements.
Plot Color: Blue.
True Week Open:
This represents the opening price every Monday at 6:00 PM. It gives traders a level to track weekly opening movements and can be useful for weekly trend analysis.
Plot Color: Orange.
True Day Open:
This represents the opening price at 12:00 AM (midnight) each day. It serves as a daily benchmark for price action at the start of the trading day.
Plot Color: Red.
True New York Session Open:
This represents the opening price at 7:30 AM (New York session start time). This level is crucial for traders focused on the New York trading session.
Plot Color: Purple.
Additional Features:
Labels: The indicator displays labels to the right of each plotted line to describe which "True Open" it represents (e.g., "True Year Open," "True Month Open," etc.).
Dynamic Plotting: The lines are only plotted on the current candle, and the lines are dynamically updated for each time period based on the corresponding "True Open."
Visual Cues: The colors of the plotted lines (green, blue, orange, red, purple) help quickly distinguish between different "True Open" levels, making it easy for traders to track price action and make informed decisions.
Use Cases:
Yearly, Monthly, Weekly, Daily, and Session Benchmarking: This indicator provides traders with important price levels to use as benchmarks for the current year, month, week, and day, helping to identify trends and potential reversals.
Session Awareness: It is particularly useful for traders who want to track key market sessions, such as the New York session, and their impact on price movement.
Long-term Analysis: By including the yearly open, this indicator helps traders gain a broader perspective on market trends and provides context for analyzing shorter-term price movements.
Benefits:
Helps identify important reference points for longer-term trends (yearly, monthly) as well as shorter-term moves (daily, weekly, and session).
Visually intuitive with color-coded lines and labels, allowing quick and easy identification of key market open levels.
Dynamic and real-time: The indicator plots and updates the True Open levels dynamically as the market progresses.

Multi-Fibonacci Trend Average[FibonacciFlux]Multi-Fibonacci Trend Average (MFTA): An Institutional-Grade Trend Confluence Indicator for Discerning Market Participants
My original indicator/Strategy:
Engineered for the sophisticated demands of institutional and advanced traders, the Multi-Fibonacci Trend Average (MFTA) indicator represents a paradigm shift in technical analysis. This meticulously crafted tool is designed to furnish high-definition trend signals within the complexities of modern financial markets. Anchored in the rigorous principles of Fibonacci ratios and augmented by advanced averaging methodologies, MFTA delivers a granular perspective on trend dynamics. Its integration of Multi-Timeframe (MTF) filters provides unparalleled signal robustness, empowering strategic decision-making with a heightened degree of confidence.
MFTA indicator on BTCUSDT 15min chart with 1min RSI and MACD filters enabled. Note the refined signal generation with reduced noise.
MFTA indicator on BTCUSDT 15min chart without MTF filters. While capturing more potential trading opportunities, it also generates a higher frequency of signals, including potential false positives.
Core Innovation: Proprietary Fibonacci-Enhanced Supertrend Averaging Engine
The MFTA indicator’s core innovation lies in its proprietary implementation of Supertrend analysis, strategically fortified by Fibonacci ratios to construct a truly dynamic volatility envelope. Departing from conventional Supertrend methodologies, MFTA autonomously computes not one, but three distinct Supertrend lines. Each of these lines is uniquely parameterized by a specific Fibonacci factor: 0.618 (Weak), 1.618 (Medium/Golden Ratio), and 2.618 (Strong/Extended Fibonacci).
// Fibonacci-based factors for multiple Supertrend calculations
factor1 = input.float(0.618, 'Factor 1 (Weak/Fibonacci)', minval=0.01, step=0.01, tooltip='Factor 1 (Weak/Fibonacci)', group="Fibonacci Supertrend")
factor2 = input.float(1.618, 'Factor 2 (Medium/Golden Ratio)', minval=0.01, step=0.01, tooltip='Factor 2 (Medium/Golden Ratio)', group="Fibonacci Supertrend")
factor3 = input.float(2.618, 'Factor 3 (Strong/Extended Fib)', minval=0.01, step=0.01, tooltip='Factor 3 (Strong/Extended Fib)', group="Fibonacci Supertrend")
This multi-faceted architecture adeptly captures a spectrum of market volatility sensitivities, ensuring a comprehensive assessment of prevailing conditions. Subsequently, the indicator algorithmically synthesizes these disparate Supertrend lines through arithmetic averaging. To achieve optimal signal fidelity and mitigate inherent market noise, this composite average is further refined utilizing an Exponential Moving Average (EMA).
// Calculate average of the three supertends and a smoothed version
superlength = input.int(21, 'Smoothing Length', tooltip='Smoothing Length for Average Supertrend', group="Fibonacci Supertrend")
average_trend = (supertrend1 + supertrend2 + supertrend3) / 3
smoothed_trend = ta.ema(average_trend, superlength)
The resultant ‘Smoothed Trend’ line emerges as a remarkably responsive yet stable trend demarcation, offering demonstrably superior clarity and precision compared to singular Supertrend implementations, particularly within the turbulent dynamics of high-volatility markets.
Elevated Signal Confluence: Integrated Multi-Timeframe (MTF) Validation Suite
MFTA transcends the limitations of conventional trend indicators by incorporating an advanced suite of three independent MTF filters: RSI, MACD, and Volume. These filters function as sophisticated validation protocols, rigorously ensuring that only signals exhibiting a confluence of high-probability factors are brought to the forefront.
1. Granular Lower Timeframe RSI Momentum Filter
The Relative Strength Index (RSI) filter, computed from a user-defined lower timeframe, furnishes critical momentum-based signal validation. By meticulously monitoring RSI dynamics on an accelerated timeframe, traders gain the capacity to evaluate underlying momentum strength with precision, prior to committing to signal execution on the primary chart timeframe.
// --- Lower Timeframe RSI Filter ---
ltf_rsi_filter_enable = input.bool(false, title="Enable RSI Filter", group="MTF Filters", tooltip="Use RSI from lower timeframe as a filter")
ltf_rsi_timeframe = input.timeframe("1", title="RSI Timeframe", group="MTF Filters", tooltip="Timeframe for RSI calculation")
ltf_rsi_length = input.int(14, title="RSI Length", minval=1, group="MTF Filters", tooltip="Length for RSI calculation")
ltf_rsi_threshold = input.int(30, title="RSI Threshold", minval=0, maxval=100, group="MTF Filters", tooltip="RSI value threshold for filtering signals")
2. Convergent Lower Timeframe MACD Trend-Momentum Filter
The Moving Average Convergence Divergence (MACD) filter, also calculated on a lower timeframe basis, introduces a critical layer of trend-momentum convergence confirmation. The bullish signal configuration rigorously mandates that the MACD line be definitively positioned above the Signal line on the designated lower timeframe. This stringent condition ensures a robust indication of converging momentum that aligns synergistically with the prevailing trend identified on the primary timeframe.
// --- Lower Timeframe MACD Filter ---
ltf_macd_filter_enable = input.bool(false, title="Enable MACD Filter", group="MTF Filters", tooltip="Use MACD from lower timeframe as a filter")
ltf_macd_timeframe = input.timeframe("1", title="MACD Timeframe", group="MTF Filters", tooltip="Timeframe for MACD calculation")
ltf_macd_fast_length = input.int(12, title="MACD Fast Length", minval=1, group="MTF Filters", tooltip="Fast EMA length for MACD")
ltf_macd_slow_length = input.int(26, title="MACD Slow Length", minval=1, group="MTF Filters", tooltip="Slow EMA length for MACD")
ltf_macd_signal_length = input.int(9, title="MACD Signal Length", minval=1, group="MTF Filters", tooltip="Signal SMA length for MACD")
3. Definitive Volume Confirmation Filter
The Volume Filter functions as an indispensable arbiter of trade conviction. By establishing a dynamic volume threshold, defined as a percentage relative to the average volume over a user-specified lookback period, traders can effectively ensure that all generated signals are rigorously validated by demonstrably increased trading activity. This pivotal validation step signifies robust market participation, substantially diminishing the potential for spurious or false breakout signals.
// --- Volume Filter ---
volume_filter_enable = input.bool(false, title="Enable Volume Filter", group="MTF Filters", tooltip="Use volume level as a filter")
volume_threshold_percent = input.int(title="Volume Threshold (%)", defval=150, minval=100, group="MTF Filters", tooltip="Minimum volume percentage compared to average volume to allow signal (100% = average)")
These meticulously engineered filters operate in synergistic confluence, requiring all enabled filters to definitively satisfy their pre-defined conditions before a Buy or Sell signal is generated. This stringent multi-layered validation process drastically minimizes the incidence of false positive signals, thereby significantly enhancing entry precision and overall signal reliability.
Intuitive Visual Architecture & Actionable Intelligence
MFTA provides a demonstrably intuitive and visually rich charting environment, meticulously delineating trend direction and momentum through precisely color-coded plots:
Average Supertrend: Thin line, green/red for uptrend/downtrend, immediate directional bias.
Smoothed Supertrend: Bold line, teal/purple for uptrend/downtrend, cleaner, institutionally robust trend.
Dynamic Trend Fill: Green/red fill between Supertrends quantifies trend strength and momentum.
Adaptive Background Coloring: Light green/red background mirrors Smoothed Supertrend direction, holistic trend perspective.
Precision Buy/Sell Signals: ‘BUY’/‘SELL’ labels appear on chart when trend touch and MTF filter confluence are satisfied, facilitating high-conviction trade action.
MFTA indicator applied to BTCUSDT 4-hour chart, showcasing its effectiveness on higher timeframes. The Smoothed Length parameter is increased to 200 for enhanced smoothness on this timeframe, coupled with 1min RSI and Volume filters for signal refinement. This illustrates the indicator's adaptability across different timeframes and market conditions.
Strategic Applications for Institutional Mandates
MFTA’s sophisticated design provides distinct advantages for advanced trading operations and institutional investment mandates. Key strategic applications include:
High-Probability Trend Identification: Fibonacci-averaged Supertrend with MTF filters robustly identifies high-probability trend continuations and reversals, enhancing alpha generation.
Precision Entry/Exit Signals: Volume and momentum-filtered signals enable institutional-grade precision for optimized risk-adjusted returns.
Algorithmic Trading Integration: Clear signal logic facilitates seamless integration into automated trading systems for scalable strategy deployment.
Multi-Asset/Timeframe Versatility: Adaptable parameters ensure applicability across diverse asset classes and timeframes, catering to varied trading mandates.
Enhanced Risk Management: Superior signal fidelity from MTF filters inherently reduces false signals, supporting robust risk management protocols.
Granular Customization and Parameterized Control
MFTA offers unparalleled customization, empowering users to fine-tune parameters for precise alignment with specific trading styles and market conditions. Key adjustable parameters include:
Fibonacci Factors: Adjust Supertrend sensitivity to volatility regimes.
ATR Length: Control volatility responsiveness in Supertrend calculations.
Smoothing Length: Refine Smoothed Trend line responsiveness and noise reduction.
MTF Filter Parameters: Independently configure timeframes, lookback periods, and thresholds for RSI, MACD, and Volume filters for optimal signal filtering.
Disclaimer
MFTA is meticulously engineered for high-quality trend signals; however, no indicator guarantees profit. Market conditions are unpredictable, and trading involves substantial risk. Rigorous backtesting and forward testing across diverse datasets, alongside a comprehensive understanding of the indicator's logic, are essential before live deployment. Past performance is not indicative of future results. MFTA is for informational and analytical purposes only and is not financial or investment advice.

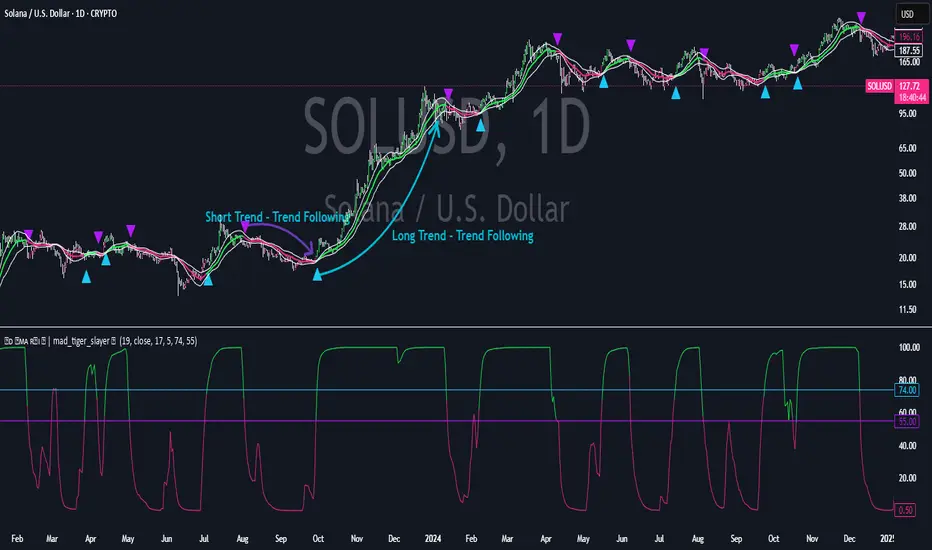
Standard Deviation SMA RSI | mad_tiger_slayerOverview of the Script
The Standard Deviation SMA RSI is a custom TradingView indicator that enhances the Relative Strength Index (RSI) by incorporating a Simple Moving Average (SMA) and Standard Deviation bands . This approach smooths RSI calculations while factoring in volatility to provide clearer trend signals . Additionally, the indicator includes overbought and oversold thresholds, trend-coded RSI signals , and dynamic volatility bands for improved market analysis. This indicator is designed for swing traders and long-term investors looking to capture high-probability trend shifts.
How Do Traders Use the Standard Deviation SMA RSI?
In the provided chart image, the indicator is displayed on a price chart. Each visual component serves a distinct function in identifying trend conditions and volatility levels .
INTENDED USES
⚠️ NOT INTENDED FOR SCALPING
With the smoothing nature of the SMA-based RSI , this indicator is not designed for low-timeframe scalping. It works best on timeframes above 1-hour , with optimal performance in 12-hour, daily, and higher timeframes.
📈 TREND-FOLLOWING & MEAN REVERSION
The Standard Deviation SMA RSI functions as both a trend-following and mean-reverting indicator:
Trend-Following: Identifies strong, sustained trends using RSI signals and SMA confirmation.
Mean Reversion: Detects overbought/oversold conditions based on standard deviation bands and RSI thresholds .
A VISUAL REPRESENTATION OF INTENDED USES
RSI Line (Green/Pink/Gray): The RSI line dynamically changes color based on trend conditions .
Green RSI → Strong uptrend, RSI above the uptrend threshold.
Pink RSI → Downtrend, RSI below the downtrend threshold.
Gray RSI → Neutral state or consolidation.
If the SMA of RSI is above Long Threshold , the market is in a bullish trend.
If it’s below Short Threshold, bearish conditions prevail.
Threshold Lines (Teal/Purple):
Green Line → Long Entry Threshold
Red Line → Short Entry Threshold
Standard Deviation Bands:
Upper Band → Measures bullish volatility expansion
Lower Band → Measures bearish volatility expansion
Colored Candles: Price candles adjust color based on RSI conditions , visually aligning price action with market trends.
Indicator's Primary Elements
Input Parameters
The script includes several configurable settings, allowing users to tailor the indicator to different market environments:
RSI Length: Controls the number of periods for RSI calculations.
SMA Length: Defines the period for the SMA applied to RSI , creating a smoothed trend line.
Standard Deviation Period: Determines the length for volatility calculations.
Overbought and Oversold Levels:
Can be adjusted to customize sensitivity.
Standard Deviation SMA RSI Calculation
The SMA-based RSI smooths fluctuations while the standard deviation bands measure price volatility.
Upper and Lower Bands: Calculated by adding/subtracting standard deviation to/from the SMA-based RSI.
Trend Signal Calculation:
RSI is compared to uptrend and downtrend thresholds to determine buy/sell conditions.
Long and Short Conditions
Buy and sell conditions are determined by RSI relative to key thresholds :
Bullish Signal: RSI above long threshold & SMA confirms trend .
Bearish Signal: RSI below short threshold & SMA confirms downtrend .
Reversals: RSI entering overbought/oversold areas suggests possible trend reversals.
Conclusion
The Standard Deviation SMA RSI is a powerful trend-following and mean-reverting tool , offering enhanced insights into RSI movements, volatility, and market strength . By combining SMA smoothing, standard deviation bands, and dynamic thresholds , traders can better identify trend confirmations, reversals, and overextended conditions .
✅ Customizable settings allow traders to optimize sensitivity.
✅ Works best on high timeframes (12H, Daily, Weekly).
✅ Ideal for swing traders and long-term investors.
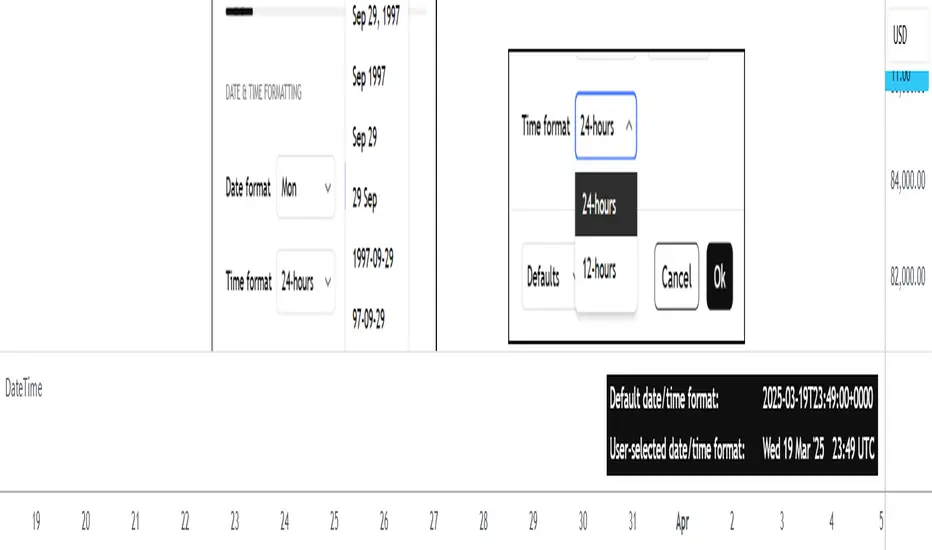
DateTimeLibrary with enums that can be used as script inputs to allow users to set their preferred date and/or time formats. The user-selected formats can be passed to the library functions (which use 𝚜𝚝𝚛.𝚏𝚘𝚛𝚖𝚊𝚝_𝚝𝚒𝚖𝚎() under the hood) to get formatted date and time strings from a UNIX time.
PREFACE
The target audience of this publication is users creating their own indicators/strategies.
Sometimes a date and/or time needs to be displayed to the user. As a Pine Coder, it is natural to focus our initial attention on the primary calculations or functions of a script, which can lead to the display format of dates and times being an afterthought. While it may not be crucial for the main use case of a script, increased customizability can help push indicators/strategies to the next level in the eyes of the user.
The purpose of this library is to provide an easy-to-use mechanism for allowing script users to choose the formats of dates and times that are displayed to them. Not only is this helpful for users from around the world who may be accustomed to different date/time formats, but it also makes it easier for the script author because it offloads the date/time formatting decision from the author to the user.
HOW TO USE
Step 1
Import the library. Replace with the latest available version number for this library.
//@version=6
indicator("Example")
import n00btraders/DateTime/ as dt
Step 2
Select a date format and/or time format enum to be used as an input.
dateFormatInput = input.enum(dt.DateFormat.FORMAT_3, "Date format")
timeFormatInput = input.enum(dt.TimeFormat.TWENTY_FOUR_HOURS, "Time hours format")
Step 3
Pass the user's selection as the `format` parameter in the formatting functions from this library. The `timestamp` & `timezone` parameters can be any value that would otherwise be used in 𝚜𝚝𝚛.𝚏𝚘𝚛𝚖𝚊𝚝_𝚝𝚒𝚖𝚎(𝚝𝚒𝚖𝚎, 𝚏𝚘𝚛𝚖𝚊𝚝, 𝚝𝚒𝚖𝚎𝚣𝚘𝚗𝚎).
string formattedDate = dt.formatDate(timestamp, dateFormatInput, timezone)
string formattedTime = dt.formatTime(timestamp, timeFormatInput, timezone)
LIMITATIONS
The library's ease-of-use comes at a few costs:
Fixed date/time formats.
Using the library's pre-defined date & time formats means that additional custom formats cannot be utilized. For example, this library does not include seconds or fractional seconds in formatted time strings. If a script's use case requires displaying the 'seconds' from a time of day, then 𝚜𝚝𝚛.𝚏𝚘𝚛𝚖𝚊𝚝_𝚝𝚒𝚖𝚎() must be used directly.
Fixed time zone offset format.
The `formatTime()` function of this library can optionally add the time zone offset at the end of the time string, but the format of the offset cannot be specified. Note: if the default format for time zone offset is not sufficient, the Timezone library can be imported directly to get the time zone offset string in a preferred format.
ADVANTAGES
There are benefits to utilizing this library instead of directly using 𝚜𝚝𝚛.𝚏𝚘𝚛𝚖𝚊𝚝_𝚝𝚒𝚖𝚎():
Easy to use from the user's perspective.
The date & time format enums provide a similar look and feel to the "Date format" and "Time hours format" options that already exist in the TradingView chart settings.
Easy to use from the author's perspective.
The exported functions from this library are modeled to behave similarly to the 𝚜𝚝𝚛.𝚏𝚘𝚛𝚖𝚊𝚝_𝚝𝚒𝚖𝚎(𝚝𝚒𝚖𝚎, 𝚏𝚘𝚛𝚖𝚊𝚝, 𝚝𝚒𝚖𝚎𝚣𝚘𝚗𝚎) built-in function from Pine Script.
Format quarter of the year.
The date formatting function from this library can display a fiscal quarter if it's included in the user-selected format. This is currently not possible with the built-in 𝚜𝚝𝚛.𝚏𝚘𝚛𝚖𝚊𝚝_𝚝𝚒𝚖𝚎().
EXPORTED ENUM TYPES
This section will list the available date/time formats that can be used as a script input. Each enum type has a detailed //@𝚏𝚞𝚗𝚌𝚝𝚒𝚘𝚗 description in the source code to help determine the best choice for your scripts.
Date Format Enums:
𝙳𝚊𝚝𝚎𝙵𝚘𝚛𝚖𝚊𝚝
𝙳𝚊𝚝𝚎𝙵𝚘𝚛𝚖𝚊𝚝𝙳𝚊𝚢𝙾𝚏𝚆𝚎𝚎𝚔𝙰𝚋𝚋𝚛
𝙳𝚊𝚝𝚎𝙵𝚘𝚛𝚖𝚊𝚝𝙳𝚊𝚢𝙾𝚏𝚆𝚎𝚎𝚔𝙵𝚞𝚕𝚕
𝙲𝚞𝚜𝚝𝚘𝚖𝙳𝚊𝚝𝚎𝙵𝚘𝚛𝚖𝚊𝚝
Supporting Date Enums:
𝙳𝚊𝚝𝚎𝙿𝚛𝚎𝚏𝚒𝚡
Time Format Enums:
𝚃𝚒𝚖𝚎𝙵𝚘𝚛𝚖𝚊𝚝
Supporting Time Enums:
𝚃𝚒𝚖𝚎𝙰𝚋𝚋𝚛𝚎𝚟𝚒𝚊𝚝𝚒𝚘𝚗
𝚃𝚒𝚖𝚎𝚂𝚎𝚙𝚊𝚛𝚊𝚝𝚘𝚛
𝚃𝚒𝚖𝚎𝙿𝚘𝚜𝚝𝚏𝚒𝚡
Note: all exported enums have custom titles for each field. This means that the supporting enums could also be exposed to the end-user as script inputs if necessary. The supporting enums are used as optional parameters in this library's formatting functions to allow further customizability.
EXPORTED FUNCTIONS
formatDate(timestamp, format, timezone, prefix, trim)
Converts a UNIX time into a date string formatted according to the selected `format`.
Parameters:
timestamp (series int) : A UNIX time.
format (series DateFormat) : A date format.
timezone (series string) : A UTC/GMT offset or IANA time zone identifier.
prefix (series DatePrefix) : Optional day of week prefix.
trim (series bool) : Optional truncation of numeric month / day.
Returns: Calendar date string using the selected format.
⸻⸻⸻⸻⸻⸻⸻⸻
Required parameters: `timestamp`, `format`.
Note: there is a version of this function for each Date Format enum type. The only difference is the type of the `format` parameter.
Tip: hover over the `formatDate()` function in the Pine Editor to display useful details:
Function description
Parameter descriptions + default values
Example function usage
formatTime(timestamp, format, timezone, trim, separator, postfix, space, offset)
Converts a UNIX time into a formatted time string using the 24-hour clock or 12-hour clock.
Parameters:
timestamp (series int) : A UNIX time.
format (series TimeFormat) : A time format.
timezone (series string) : A UTC/GMT offset or IANA time zone identifier.
trim (series TimeAbbreviation) : Optional truncation of the hour and minute portion.
separator (series TimeSeparator) : Optional time separator.
postfix (series TimePostfix) : Optional format for the AM/PM postfix.
space (series bool) : Optional space between the time and the postfix.
offset (series bool) : Optional UTC offset as a suffix.
Returns: Time of day string using the selected format.
⸻⸻⸻⸻⸻⸻⸻⸻
Required parameters: `timestamp`, `format`.
Note: the `trim`, `postfix`, and `space` optional parameters are not applicable and will be ignored when using the 24-hour clock (`format` = TimeFormat.TWENTY_FOUR_HOURS).
Tip: hover over the `formatTime()` function in the Pine Editor to display useful details:
Function description
Parameter descriptions + default values
Example function usage
Example outputs for combinations of TimeFormat.* enum values & optional parameters
NOTES
This library can be used in conjunction with the Timezone library to increase the usability of scripts that can benefit from allowing the user to input their preferred time zone.
Credits to HoanGhetti for publishing an informative Markdown resource which I referenced to create the formatted function descriptions that pop up when hovering over `formatDate()` and `formatTime()` function calls in the Pine Editor.
Air Gap MTF with alert settingsWhat it shows:
This indicator will show a horizontal line at a price where each EMAs are on on different time frames, which will remove the effort of having to flick through different time frames or look at different chart.
The lines itself will move in real time as price moves and therefore as the EMA values changes so no need to manually adjustment the lines.
How to use it:
The price gap between each of the lines are known as "air gaps", which are essentially zones price can move with less resistance. Therefore bigger the airgap there is more likely more movement in price.
In other words, where lines are can be a resistance (or support) and can expect price stagnation or rejection.
On the chart it is clear to see lines are acting as resistances/supports.
Key settings:
The time frame are fixed to: 30min, 1hr and 4hr. This cannot be changed as of now.
EMA values for each time frame are user changeable in the settings, and up to 4 different values can be chosen for each time frame. Default is 5,12,34 and 50 for each timeframe.
Line colour, thickness and style can be user adjusted. Start point for where line will be drawn can be changed in the settings, either: start of day, user defined start or across the chart. In case of user defined scenario user can input a number that specifies a offset from current candle.
Label colour, font, alignment, text size and text itself can be user adjusted in the settings. Price can be also displayed if user chooses to do so. Position of label (offset from current candle) is user specified and can be adjusted by the user.
Both the lines and labels can be turned off (both and individually), for each lines.
Alert Settings:
Manually, user can set alerts for when price crosses a specific line.
This can be done by:
right click on any of line
choose first option (add alert on...)
On the second option under condition, use the dropdown menu to choose the desired EMA/timeframe to set alert for.
Hit "create" at bottom right of option
----------------------------------------------------------------------
If anything is not clear please let me know!

Multi-Faceted Analysis ToolHere’s a detailed description for the **Multi-Faceted Analysis Tool** TradingView indicator:
---
## Multi-Faceted Analysis Tool
### Overview
The **Multi-Faceted Analysis Tool** is a powerful TradingView indicator designed to enhance your technical analysis by combining several popular indicators: Simple Moving Average (SMA), Relative Strength Index (RSI), and Moving Average Convergence Divergence (MACD). This indicator provides traders with insightful market signals that can be tailored to fit various trading strategies and timeframes.
### Key Features
1. **Simple Moving Average (SMA)**:
- Plots a customizable SMA on the price chart. The length of the SMA can be adjusted to suit your analysis needs (default is set to 50). The SMA helps identify the overall trend direction.
2. **Relative Strength Index (RSI)**:
- Calculates and plots RSI values, providing insights into potential overbought or oversold market conditions. The user can customize the length of the RSI calculation (default is 14).
- Overbought (70) and oversold (30) levels are visually marked, helping traders identify potential reversal points.
3. **MACD**:
- Computes MACD values with customizable parameters for fast length, slow length, and signal length (defaults are 12, 26, and 9 respectively).
- The MACD histogram is displayed, highlighting the difference between the MACD line and the signal line, which can help traders visualize momentum shifts.
4. **Buy and Sell Signals**:
- Generates clear buy and sell signals based on RSI crossover with established thresholds (buy when RSI crosses above 30, sell when RSI crosses below 70). These signals are visually represented on the chart for easy decision-making.
5. **User-Friendly Customization**:
- All parameters are adjustable, allowing traders to set their preferred values based on individual strategies or market conditions. This flexibility ensures that the tool can cater to a wide range of trading styles.

[F.B]_ZLEMA MACD ZLEMA MACD – A Zero-Lag Variant of the Classic MACD
Introduction & Motivation
The Moving Average Convergence Divergence (MACD) is a standard indicator for measuring trend strength and momentum. However, it suffers from the latency of traditional Exponential Moving Averages (EMAs).
This variant replaces EMAs with Zero Lag Exponential Moving Averages (ZLEMA), reducing delay and increasing the indicator’s responsiveness. This can potentially lead to earlier trend change detection, especially in highly volatile markets.
Calculation Methodology
2.1 Zero-Lag Exponential Moving Average (ZLEMA)
The classic EMA formula is extended with a correction factor:
ZLEMA_t = EMA(2 * P_t - EMA(P_t, L), L)
where:
P_t is the closing price,
L is the smoothing period length.
2.2 MACD Calculation Using ZLEMA
MACD_t = ZLEMA_short,t - ZLEMA_long,t
with standard parameters of 12 and 26 periods.
2.3 Signal Line with Adaptive Methodology
The signal line can be calculated using ZLEMA, EMA, or SMA:
Signal_t = f(MACD, S)
where f is the chosen smoothing function and S is the period length.
2.4 Histogram as a Measure of Momentum Changes
Histogram_t = MACD_t - Signal_t
An increasing histogram indicates a relative acceleration in trend strength.
Potential Applications in Data Analysis
Since the indicator is based solely on price time series, its effectiveness as a standalone trading signal is limited. However, in quantitative models, it can be used as a feature for trend quantification or for filtering market phases with strong trend dynamics.
Potential use cases include:
Trend Classification: Segmenting market phases into "trend" vs. "mean reversion."
Momentum Regime Identification: Analyzing histogram dynamics to detect increasing or decreasing trend strength.
Signal Smoothing: An alternative to classic EMA smoothing in more complex multi-factor models.
Important: Using this as a standalone trading indicator without additional confirmation mechanisms is not recommended, as it does not demonstrate statistical superiority over other momentum indicators.
Evaluation & Limitations
✅ Advantages:
Reduced lag compared to the classic MACD.
Customizable signal line smoothing for different applications.
Easy integration into existing analytical pipelines.
⚠️ Limitations:
Not a standalone trading system: Like any moving average, this indicator is susceptible to noise and false signals in sideways markets.
Parameter sensitivity: Small changes in period lengths can lead to significant signal deviations, requiring robust optimization.
Conclusion
The ZLEMA MACD is a variant of the classic MACD with reduced latency, making it particularly useful for analytical purposes where faster adaptation to price movements is required.
Its application in trading strategies should be limited to multi-factor models with rigorous evaluation. Backtests and out-of-sample analyses are essential to avoid overfitting to past market data.
Disclaimer: This indicator is provided for informational and educational purposes only and does not constitute financial advice. The author assumes no responsibility for any trading decisions made based on this indicator. Trading involves significant risk, and past performance is not indicative of future results.

Market Trend Levels Non-Repainting [BigBeluga X PineIndicators]This strategy is based on the Market Trend Levels Detector developed by BigBeluga. Full credit for the concept and original indicator goes to BigBeluga.
The Market Trend Levels Detector Strategy is a non-repainting trend-following strategy that identifies market trend shifts using two Exponential Moving Averages (EMA). It also detects key price levels and allows traders to apply multiple filters to refine trade entries and exits.
This strategy is designed for trend trading and enables traders to:
Identify trend direction based on EMA crossovers.
Detect significant market levels using labeled trend lines.
Use multiple filter conditions to improve trade accuracy.
Avoid false signals through non-repainting calculations.
How the Market Trend Levels Detector Strategy Works
1. Core Trend Detection Using EMA Crossovers
The strategy detects trend shifts using two EMAs:
Fast EMA (default: 12 periods) – Reacts quickly to price movements.
Slow EMA (default: 25 periods) – Provides a smoother trend confirmation.
A bullish crossover (Fast EMA crosses above Slow EMA) signals an uptrend , while a bearish crossover (Fast EMA crosses below Slow EMA) signals a downtrend .
2. Market Level Detection & Visualization
Each time an EMA crossover occurs, a trend level line is drawn:
Bullish crossover → A green line is drawn at the low of the crossover candle.
Bearish crossover → A purple line is drawn at the high of the crossover candle.
Lines can be extended to act as support and resistance zones for future price action.
Additionally, a small label (●) appears at each crossover to mark the event on the chart.
3. Trade Entry & Exit Conditions
The strategy allows users to choose between three trading modes:
Long Only – Only enters long trades.
Short Only – Only enters short trades.
Long & Short – Trades in both directions.
Entry Conditions
Long Entry:
A bullish EMA crossover occurs.
The trade direction setting allows long trades.
Filter conditions (if enabled) confirm a valid long signal.
Short Entry:
A bearish EMA crossover occurs.
The trade direction setting allows short trades.
Filter conditions (if enabled) confirm a valid short signal.
Exit Conditions
Long Exit:
A bearish EMA crossover occurs.
Exit filters (if enabled) indicate an invalid long position.
Short Exit:
A bullish EMA crossover occurs.
Exit filters (if enabled) indicate an invalid short position.
Additional Trade Filters
To improve trade accuracy, the strategy allows traders to apply up to 7 additional filters:
RSI Filter: Only trades when RSI confirms a valid trend.
MACD Filter: Ensures MACD histogram supports the trade direction.
Stochastic Filter: Requires %K line to be above/below threshold values.
Bollinger Bands Filter: Confirms price position relative to the middle BB line.
ADX Filter: Ensures the trend strength is above a set threshold.
CCI Filter: Requires CCI to indicate momentum in the right direction.
Williams %R Filter: Ensures price momentum supports the trade.
Filters can be enabled or disabled individually based on trader preference.
Dynamic Level Extension Feature
The strategy provides an optional feature to extend trend lines until price interacts with them again:
Bullish support lines extend until price revisits them.
Bearish resistance lines extend until price revisits them.
If price breaks a line, the line turns into a dotted style , indicating it has been breached.
This helps traders identify key levels where trend shifts previously occurred, providing useful support and resistance insights.
Customization Options
The strategy includes several adjustable settings :
Trade Direction: Choose between Long Only, Short Only, or Long & Short.
Trend Lengths: Adjust the Fast & Slow EMA lengths.
Market Level Extension: Decide whether to extend support/resistance lines.
Filters for Trade Confirmation: Enable/disable individual filters.
Color Settings: Customize line colors for bullish and bearish trend shifts.
Maximum Displayed Lines: Limit the number of drawn support/resistance lines.
Considerations & Limitations
Trend Lag: As with any EMA-based strategy, signals may be slightly delayed compared to price action.
Sideways Markets: This strategy works best in trending conditions; frequent crossovers in sideways markets can produce false signals.
Filter Usage: Enabling multiple filters may reduce trade frequency, but can also improve trade quality.
Line Overlap: If many crossovers occur in a short period, the chart may become cluttered with multiple trend levels. Adjusting the "Display Last" setting can help.
Conclusion
The Market Trend Levels Detector Strategy is a non-repainting trend-following system that combines EMA crossovers, market level detection, and customizable filters to improve trade accuracy.
By identifying trend shifts and key price levels, this strategy can be used for:
Trend Confirmation – Using EMA crossovers and filters to confirm trend direction.
Support & Resistance Trading – Identifying dynamic levels where price reacts.
Momentum-Based Trading – Combining EMA crossovers with additional momentum filters.
This strategy is fully customizable and can be adapted to different trading styles, timeframes, and market conditions.
Full credit for the original concept and indicator goes to BigBeluga.

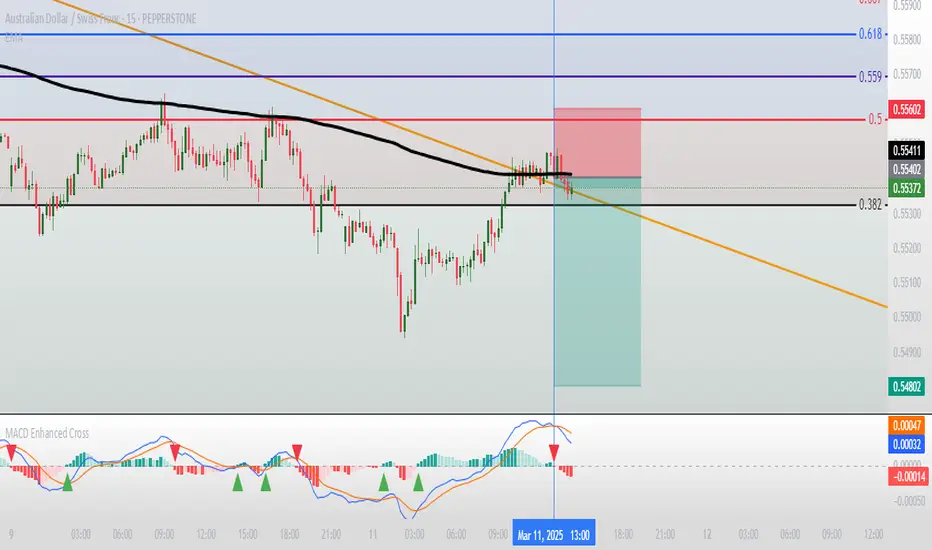
Moving Average Convergence Divergence with Enhanced Cross Alerts
Overview of Features and Settings
- Customizable Parameters:
- Fast and Slow Periods: Users can set the duration for both the fast (default 12) and slow (default 26) moving averages.
- Source Selection: The indicator uses the closing price (close) by default, though this can be modified to any other data source.
- Signal Smoothing: The smoothing period for the signal line is adjustable (default 9), and you can choose whether to use SMA or EMA for both the oscillator and the signal line calculations.
Calculation Logic
1. Calculation of Moving Averages:
- The fast and slow moving averages are computed based on the chosen moving average type (SMA or EMA) over the specified periods.
- The MACD line is then determined as the difference between these two moving averages.
2. Signal Line and Histogram:
- Signal Line: Created by smoothing the MACD line, with the option to choose between SMA and EMA.
- Histogram: Represents the difference between the MACD line and the signal line, visually indicating the divergence between the two.
Detection of Cross Events
The script identifies two specific cross events with additional filtering conditions:
- Bullish Cross:
- The MACD line **crosses above** the signal line.
- The previous value of the histogram is negative, and both the MACD and the signal line are below zero.
- This condition suggests that a cross occurring in the negative territory might indicate a potential upward trend reversal.
- **Bearish Cross:**
- The MACD line **crosses below** the signal line.
- The previous value of the histogram is positive, and both the MACD and the signal line are above zero.
- This condition indicates that a cross in the positive territory may signal a potential downward trend reversal.
For each event, there are dedicated alert conditions defined that trigger notifications when the criteria are met.
Visualization
- Displayed Elements:
- Histogram: Rendered as a column chart with colors that change based on the rate of change. For instance, a rising positive histogram uses a stronger green, whereas a declining positive histogram uses a lighter shade.
- MACD and Signal Lines: Displayed as separate lines with distinct colors to differentiate them.
- Zero Line: A horizontal line is drawn to help visually pinpoint the zero level.
- Crossing Signals:
- Optional markers in the form of arrows appear on the chart:
- **Bullish Cross: A green, upward-pointing triangle at the bottom.
- **Bearish Cross: A red, downward-pointing triangle at the top.
Summary
This indicator not only incorporates the traditional MACD components but also offers the following additional benefits:
- **Enhanced Accuracy:** Extra conditions (such as checking the previous histogram value and the position of the lines relative to zero) improve the identification of significant cross events.
- **Customization:** Users can personalize the moving average types and periods, making the indicator adaptable to different trading strategies.
- **Visual Assistance:** The combination of histogram columns, lines, and markers helps quickly pinpoint potential trend reversals, thereby aiding trading decisions.
This comprehensive description is intended to clearly demonstrate to users how the indicator works, outlining its calculations, filtering conditions, and its role in identifying cross events within technical analysis.
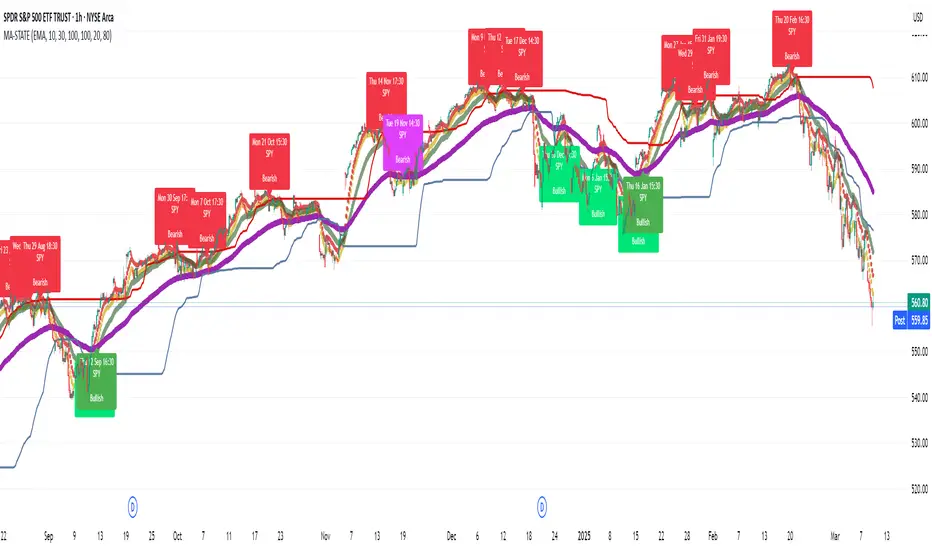
TestMA-STATEOverview:
This Pine Script (version 6) is designed to generate trading events based on moving average (MA) behavior and dynamically calculated percentiles. It leverages a custom state machine library (version 7) from decrypt_capital to track and manage state transitions related to MA conditions, and it triggers alerts (and optionally, chart labels) when specific state transitions occur.
Key Components:
License & Metadata:
The script is distributed under the Mozilla Public License 2.0.
It carries copyright by decrypt_capital.
The title ("TestMA-STATE") and short title ("MA-STATE") are defined, and the script runs on an overlay with extended backtracking and drawing limits.
State Machine Integration:
The script imports the lib_statemachine_modified library (version 7) using the alias modSM.
A persistent state machine instance (MovingAverageDirection_SM) is created to manage various MA-related states.
Several state constants are defined to represent different market conditions, such as:
MA_SHORT_ABOVE_OVERBOUGHT: When the short MA low is above the overbought threshold.
MA_SHORT_CROSSUNDER_MID & MA_SHORT_CROSSUNDER_BIG: Conditions for bearish crossunders.
MA_SHORT_BELOW_OVERSOLD: When the short MA high is below the oversold threshold.
MA_SHORT_CROSSOVER_MID & MA_SHORT_CROSSOVER_BIG: Conditions for bullish crossovers.
Inputs & MA Calculation:
Users can choose the type of moving average (EMA, SMA, WMA, VWMA) and adjust lengths for short, mid, and big MAs.
Additional inputs include lookback length for percentile calculations and percentile thresholds for determining overbought and oversold boundaries.
The script computes:
Short MA Low and High: Based on the low and high series.
Mid MA and Big MA: Based on the average price (ohlc4).
Dynamic Percentile Boundaries:
Two functions (f_getPercentile() and f_getPercentileArr()) calculate dynamic percentile values from the MA data.
These functions determine the oversold and overbought boundaries used in the state transition conditions.
Timestamp & Alert Header Formatting:
A helper function (f_formatTimestamp()) formats timestamps into a human-readable form (e.g., "Tue 12 Mar 16:30").
This formatted time, along with ticker information and other details, is used to build an alert header.
State Transitions & Alerts:
The script calls the state machine’s step() method multiple times with conditions based on the relationship between MA values and the percentile boundaries.
For example:
A bullish condition is triggered when the short MA low moves above the overbought threshold.
A bearish condition is triggered when the short MA high falls below the oversold boundary.
Transitions are further refined by checking if the MA is rising or falling.
When specific state transitions occur (e.g., MA_SHORT_CROSSOVER_MID after MA_SHORT_BELOW_OVERSOLD), the script:
Checks that the transition is recent (using the barsSinceState() method).
Optionally creates a label on the chart.
Triggers an alert with a descriptive message.
Chart Plotting:
The script plots the calculated moving averages (short, mid, and optionally big) on the chart.
It also plots the dynamic percentile boundaries for visual reference.
Purpose & Usage:
Trading Signal Generation:
The primary goal is to monitor key MA conditions and trigger alerts when significant crossovers or crossunders occur. These events—such as bullish crossovers when the market recovers from oversold conditions or bearish crossunders when the market retracts from overbought conditions—can be used as trading signals.
Visualization:
Users have options to display the various moving averages and percentile boundaries directly on the chart, as well as optional labels that mark when an alert is generated.
Alerting:
When specific state transitions are detected, the script constructs and sends an alert message with a timestamp, ticker, and descriptive text, aiding traders in making timely decisions.
MACD Crossover Strategy MACD Crossover Strategy:
This strategy is based on the Moving Average Convergence Divergence (MACD) indicator, a popular tool used in technical analysis to identify potential trend changes and momentum in price movements. The strategy focuses on MACD crossovers within a specific "important zone" to generate trading signals.
Key Components:
1. MACD Calculation: The strategy uses customizable parameters for fast length (default 12), slow length (default 26), and signal length (default 9) to calculate the MACD line and signal line.
2. Important Zone: Defined by upper and lower thresholds (default 0.5 and -0.5), this zone helps filter out potentially less significant crossovers.
3. Entry Conditions:
- Long (Buy) Entry: When the MACD line crosses above the signal line within the important zone.
- Short (Sell) Entry: When the MACD line crosses below the signal line within the important zone.
4. Exit Conditions: The strategy closes positions on opposite crossover signals. Long positions are closed on bearish crossovers, and short positions on bullish crossovers.
5. Visualization:
- MACD line (blue) and signal line (orange) are plotted.
- The zero line, upper threshold, and lower threshold are displayed for reference.
- Buy signals are represented by green triangles at the bottom of the chart.
- Sell signals are shown as red triangles at the top of the chart.
This strategy aims to capture trend changes while filtering out potentially false signals that occur when the MACD is at extreme values. By focusing on crossovers within the important zone, the strategy attempts to identify more reliable trading opportunities.
Traders can adjust the MACD parameters and the important zone thresholds to fine-tune the strategy for different assets or timeframes. As with any trading strategy, it's crucial to thoroughly backtest and consider risk management before using it in live trading.

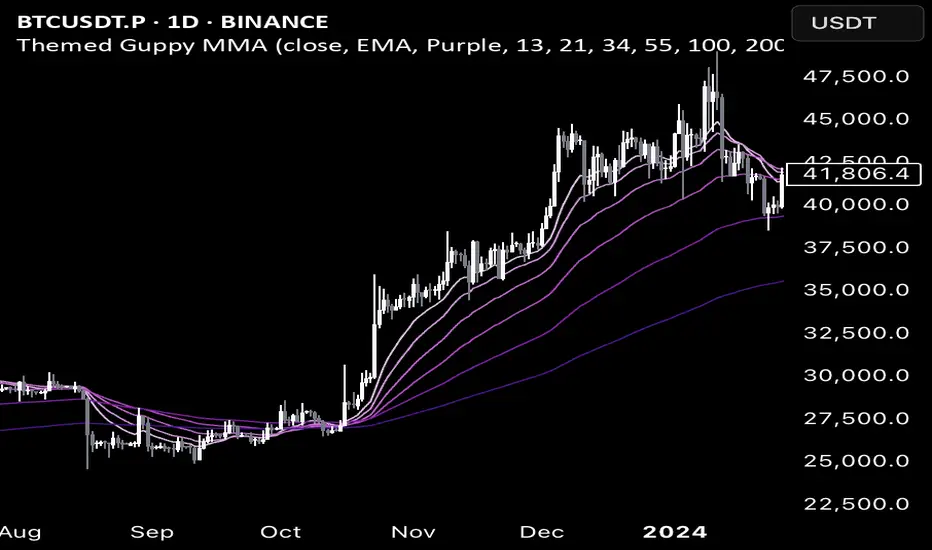
Color Themed Guppy Multiple Moving Average
========== TLDR ==========
The "Color Themed Guppy Multiple Moving Average" plots a group of 6 Moving Averages on your chart with a selection of color themes to automatically style the different length Moving Average lines. As someone who struggles with screens and colors on a busy chart, this indicator has helped me a lot in quickly identifying which Moving Average price is respecting the most - giving me better signals for trade entries and trend loss.
========== Key Features and Advantages ==========
- Show different length Moving Averages with a single indicator
- quickly make your chart more readable with 12 different color themes
- The themes will color the Moving Averages with a gradient (light - dark), with a lighter color indicating a shorter length or 'faster' Moving Average
- Select the type of Moving Average you would like to use
========== Use Cases ==========
Identify Specific Length Moving Averages That are Acting as Support or Resistance:
Having each Moving Average coloured by a theme makes it easier to track each individual line with your eyes, making it easier to quickly find the Moving Averages that price is respecting the most for a given asset and/or trend.
Get Bias Quickly:
When all 6 of the Moving Averages are 'stacked' on top of each other in order, and all are angled either up or down, it can provide a useful bias for the market on your timeframe.
For example, If the fastest (smallest length) Moving Averages are angled up and sitting above the slower (largest length) Moving Averages, it may indicate that a 'long' bias would be preferable for any trades.
Having a color gradient from the themes makes it much easier to see when the Moving Average lines are "stacked" in order.
Identify Turning Points:
When the faster (smallest length) Moving Averages start to cross over the slower (largest length) Moving Averages, it may indicate a potential price/trend reversal.
Again, having a color gradient from the themes makes it much easier to spot this
========== Theme Options ==========
- Red
- Orange
- Yellow
- Green
- Teal
- Light Blue
- Blue
- Violet
- Purple
- Pink
- Rainbow - Solid
- Rainbow - Light
If you'd like other themes added feel free to request them in the comments and I can try to add more.
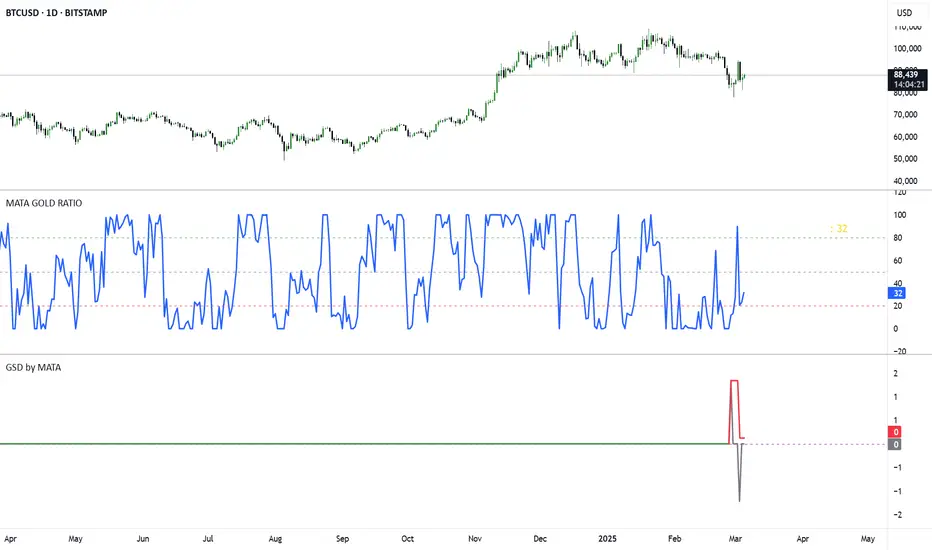
GSD by MATAGSD by MATA - Gold-Sensitive Divergence Indicator
Overview:
The GSD by MATA indicator is designed to analyze the inverse correlation between an instrument’s price movement and gold (XAU/USD) over a selected time period. It helps traders identify whether the instrument tends to move in the opposite direction of gold, providing insights into potential hedging opportunities or market sentiment shifts.
How It Works:
User-Defined Time Period:
The user selects a time frame for comparison (1 Day, 1 Week, 1 Month, 3 Months, 6 Months, or 12 Months).
The indicator calculates the percentage change in both the instrument’s price and gold price over this period.
Inverse Movement Calculation:
If gold increases and the instrument decreases, the indicator registers a negative inverse change.
If gold decreases and the instrument increases, the indicator registers a positive inverse change.
If both move in the same direction, no inverse movement is recorded.
Cumulative Tracking:
The Reverse Change line shows the instant inverse movement.
The Total Change line accumulates the inverse movements over time, helping traders spot trends and long-term divergences.
How to Use:
A rising Total Change line (green) suggests that the instrument frequently moves in the opposite direction of gold, indicating a possible hedge effect.
A falling Total Change line (red) means the instrument has been moving in sync with gold rather than diverging.
The 0 reference line helps identify whether the cumulative effect is positive or negative over time.
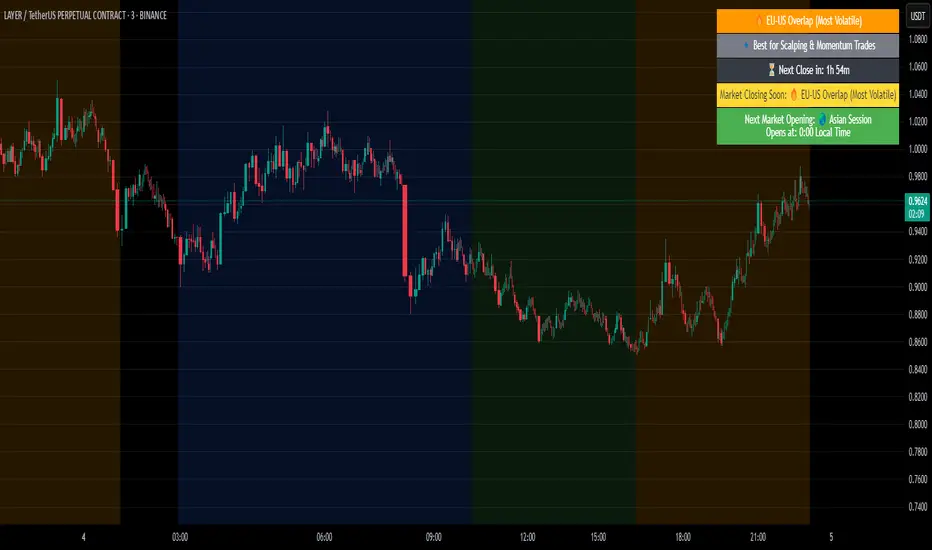
Crypto Market Session Guide with Local TimeMaster the Markets with the Ultimate Trading Session Indicator
Timing is everything in trading. Knowing when liquidity is at its peak and when market sessions overlap can make all the difference in your strategy. This Market Session Guide Indicator helps you navigate the trading day with real-time session tracking, countdown timers, and local time adjustments—giving you a clear edge in the market.
Key Features
Live Session Tracking – Instantly see which trading session is active: Asian, European, US, or the high-volatility EU-US overlap.
Automatic Local Time Conversion – No need to convert UTC manually—session times adjust automatically based on your TradingView exchange settings.
Daylight Saving Time Adjustments – The US market opening and closing times are automatically adjusted for summer and winter shifts.
Countdown Timer for Session Close – Know exactly when the current session will end so you can time your trades effectively.
Next Market Opening Display – Always be prepared by knowing which market opens next and at what exact time in your local timezone.
Clear Visual Guide – A structured table in the top-right of your chart provides all essential session details without cluttering your screen.
How It Works
This indicator tracks the three main trading sessions:
Asian Session (Tokyo, Sydney): 00:00 - 09:00 UTC
European Session (London, Frankfurt): 07:00 - 16:00 UTC
US Session (New York, Chicago): 13:30 - 22:00 UTC (adjusts automatically for Daylight Saving Time)
EU-US Overlap: 12:00 - 16:00 UTC, the most volatile period of the trading day
It also highlights when a session is about to close and when the next one will begin, ensuring you are always aware of liquidity shifts in the market.
Why You Need This Indicator
Optimized for Forex, Crypto, and Indices – Helps traders align their strategies with the most active market hours.
Ideal for Scalping and Day Trading – Enter trades during peak volatility to maximize opportunities.
Eliminates Guesswork – Stop manually tracking time zones and market schedules—everything updates dynamically for you.
Upgrade Your Trading Strategy Today
This indicator simplifies market timing, ensuring you're always trading when liquidity and volatility are at their highest. Whether you're trading Forex, Crypto, or Stocks, knowing when markets open and close is essential for making informed decisions.
Try it out, and if you find it useful, consider sharing it with other traders. Your feedback is always welcome!
NFP High/Low Levels PlusNFP High/Low Levels Plus
Description:
This indicator stores the 12 most recent NFP (Non-Farm-Payroll) days and their values.
Values are captured from 0830 (NFP Release) until close of market
The High and Low values for each NFP month are drawn on the chart with horizontal lines.
- Labels indicating the month's high or low line are placed after the line
- Optionally the high/low price can be displayed additionally
Support and Resistance boxes can be drawn at the closest NFP level above and below the
current price.
- Boxes will automatically update as prices cross the NFP value
Macro Indicator
- This option displays a small table in the top right corner that says "Up" or " Down"
- The Macro Indicator can be used to judge the potential direction for the current month
- Macro direction is calculated by the following:
- UP: If two consecutive days both open and close above the most recent NFP High level
- DOWN: If two consecutive days both open and close below the most recent NFP Low level
Micro Indicator
- This option displays a small table in the top right corner that says "Up" or " Down"
- The Micro Indicator can be used to judge the potential direction for low timeframes 1H or
lower
- Micro direction is calculated by the following:
- UP: If two consecutive 10m candles close above the 20EMA
- DOWN: If two consecutive 10m candles close below the 20EMA
NFP Session Bars
- This feature draws an arrow at the bottom of the chart for each candle that falls within the
NFP session day
- This is useful for identifying NFP Days
Support / Resistance Table
- This displays a table bottom center showing the nearest high and low NFP line level
What is an NFP Day and why is it useful to add to my chart?
- NFP Days are one of the most important data releases monthly
- NFP (Non-Farm-Payroll) is the official release of 80% of the US workforce employed in
manufacturing, construction, and goods
- It does not include those who work on farms, private households, non-profit and
government workers
- Historically these high/low levels for the day create strong support and resistance levels
- Having them displayed on the chart can help identify potential strong levels and pivot points
Full Indicator with all options enabled and identified
Easily update NFP Release Days in the indicator settings
Modify various options: Show/Hide lines, labels, directional indicator tables, values tables
Adjust line width, offsets, colors, font sizes, box widths
Enable individual Directional Indicators and modify colors
Example of full indicator enabled
You can find a list of the NFP Release Schedule on the official US Bureau of Labor Statistics website. This is useful for updating the indicator settings with the correct dates
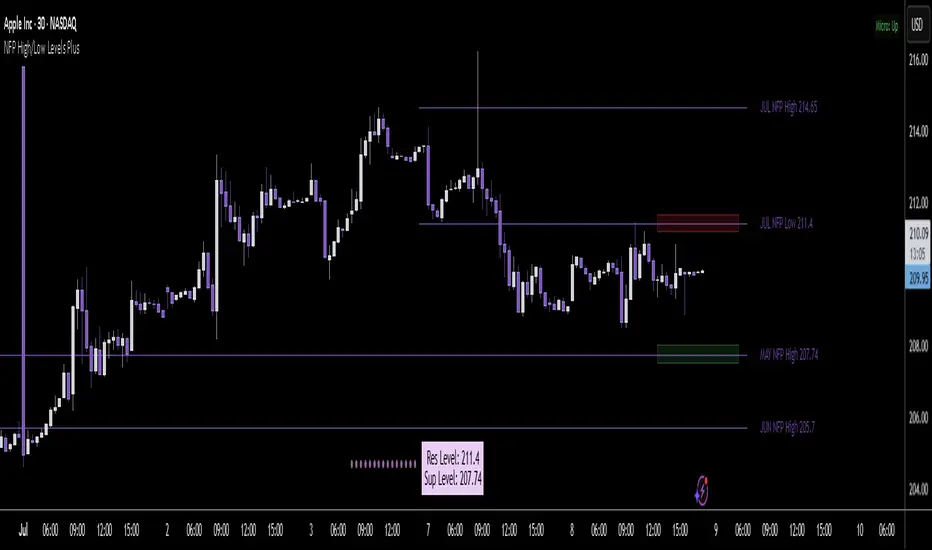
RSI & EMA IndicatorMulti-Timeframe EMA & RSI Analysis with Trend Merging Detection
Overview
This script provides traders with a multi-timeframe analysis tool that simplifies trend detection, momentum confirmation, and potential trend shifts. It integrates Exponential Moving Averages (EMAs) and the Relative Strength Index (RSI) across Daily, Weekly, and Monthly timeframes, helping traders assess both long-term and short-term market conditions at a glance.
This script is a simplification and modification of the EMA Cheatsheet by MarketMoves, reducing chart clutter while adding EMA merging detection to highlight potential trend reversals or breakouts.
Originality and Usefulness
Unlike traditional indicators, which focus on a single timeframe, this script combines multiple timeframes in a single view to offer a comprehensive market outlook.
What Makes This Indicator Unique?
This Indicator to Combine RSI and EMA Clouds for Multiple Timeframes
Multi-Timeframe Trend Analysis in One Visual Tool
EMA Merging Detection to Spot Trend Shifts Early
Momentum Validation Using RSI Across Daily, Weekly, and Monthly Timeframes
Reduces Chart Clutter While Providing Actionable Trade Signals
I couldn't find a TradingView indicator that displayed RSI and EMA clouds together across Daily, Weekly, and Monthly timeframes. This tool bridges that gap, allowing traders to see trend strength and momentum shifts across key timeframes without switching charts.
How the Script Works
1. Trend Direction via EMAs
The script tracks Short-term (5 & 12-period), Medium-term (34 & 50-period), and Long-term (72 & 89-period) EMAs across Daily, Weekly, and Monthly timeframes.
Bullish trend: When faster EMAs are above slower EMAs.
Bearish trend: When faster EMAs are below slower EMAs.
A visual table simplifies trend recognition with:
Green cells for bullish alignment.
Red cells for bearish alignment.
This color-coded system allows traders to quickly assess market momentum across different timeframes without excessive manual analysis.
2. Momentum Confirmation with RSI
The RSI(14) values for Daily, Weekly, and Monthly timeframes are displayed alongside the EMAs.
RSI above 70 suggests overbought conditions.
RSI below 30 suggests oversold conditions.
By combining RSI with EMA trends, traders can confirm whether momentum supports the trend direction or if the market is losing strength.
3. Trend Shift Detection (EMA Merging Mechanism)
A unique feature of this script is EMA merging detection, which occurs when:
The short, medium, and long-term EMAs come within 0.5% of the price.
This often signals trend reversals, breakouts, or consolidations.
When this condition is met, a warning signal appears, alerting traders to potential market shifts.
Who This Indicator Is For?
This script is designed for traders who want to track trends across multiple timeframes while keeping a clean and simplified chart.
Swing & Position Traders – Identify strong trends and potential momentum shifts for longer-term trades.
Trend Followers – Stay aligned with major market trends and avoid trading against momentum.
Day Traders – Use the Daily timeframe for entries while referencing higher timeframes for confirmation.
How to Use the Indicator
Add the indicator to any chart.
Check the trend table in the top-right corner:
Green cells indicate a bullish trend.
Red cells indicate a bearish trend.
Look at RSI values to confirm momentum:
RSI above 70 = Overbought.
RSI below 30 = Oversold.
Watch for the "Merge" alert to spot potential reversals or consolidations.
Combine signals from multiple timeframes for stronger trade decisions.
Why This Indicator is Unique on TradingView?
Before this script, no TradingView indicator displayed RSI and EMA clouds together across multiple timeframes (Daily, Weekly, Monthly).
This tool eliminates the need to:
Manually check multiple timeframes for trend alignment.
Add multiple EMA and RSI indicators to the same chart, creating clutter.
Constantly switch between different timeframes to confirm momentum and trend direction.
With this indicator, traders can see trend strength and momentum shifts instantly, improving their decision-making process.
Chart Guidelines
The script is designed for use on a clean chart to maximize clarity.
The trend alignment table is displayed in a non-intrusive manner so traders can focus on price action.
No additional indicators are required, but users may combine this script with volume-based indicators for further confirmation.
The script name and timeframe should always be visible on published charts to help traders understand the analysis.
Final Notes
This script is a simplification and modification of the EMA Cheatsheet by MarketMoves, improving trend detection, momentum confirmation, and EMA merging detection.
It is designed to help traders quickly identify trend direction, confirm momentum, and detect potential trend shifts, reducing the need for excessive manual analysis.
Disclaimer: This indicator is for educational purposes only and does not constitute financial advice. Trading involves risk; always use proper risk management when applying this tool in live markets.

Enhanced KLSE Banker Flow Oscillator# Enhanced KLSE Banker Flow Oscillator
## Description
The Enhanced KLSE Banker Flow Oscillator is a sophisticated technical analysis tool designed specifically for the Malaysian stock market (KLSE). This indicator analyzes price and volume relationships to identify potential smart money movements, providing early signals for market reversals and continuation patterns.
The oscillator measures the buying and selling pressure in the market with a focus on detecting institutional activity. By combining money flow calculations with volume filters and price action analysis, it helps traders identify high-probability trading opportunities with reduced noise.
## Key Features
- Dual-Timeframe Analysis: Combines long-term money flow trends with short-term momentum shifts for more accurate signals
- Adaptive Volume Filtering: Automatically adjusts volume thresholds based on recent market conditions
- Advanced Divergence Detection: Identifies potential trend reversals through price-flow divergences
- Early Signal Detection: Provides anticipatory signals before major price movements occur
- Multiple Signal Types: Offers both early alerts and strong confirmation signals with clear visual markers
- Volatility Adjustment: Adapts sensitivity based on current market volatility for more reliable signals
- Comprehensive Visual Feedback: Color-coded oscillator, signal markers, and optional text labels
- Customizable Display Options: Toggle momentum histogram, early signals, and zone fills
- Organized Settings Interface: Logically grouped parameters for easier configuration
## Indicator Components
1. Main Oscillator Line: The primary banker flow line that fluctuates above and below zero
2. Early Signal Line: Secondary indicator showing potential emerging signals
3. Momentum Histogram: Visual representation of flow momentum changes
4. Zone Fills: Color-coded background highlighting positive and negative zones
5. Signal Markers: Visual indicators for entry and exit points
6. Reference Lines: Key levels for strong and early signals
7. Signal Labels: Optional text annotations for significant signals
## Signal Types
1. Strong Buy Signal (Green Arrow): Major bullish signal with high probability of success
2. Strong Sell Signal (Red Arrow): Major bearish signal with high probability of success
3. Early Buy Signal (Blue Circle): First indication of potential bullish trend
4. Early Sell Signal (Red Circle): First indication of potential bearish trend
5. Bullish Divergence (Yellow Triangle Up): Price making lower lows while flow makes higher lows
6. Bearish Divergence (Yellow Triangle Down): Price making higher highs while flow makes lower highs
## Parameters Explained
### Core Settings
- MFI Base Length (14): Primary calculation period for money flow index
- Short-term Flow Length (5): Calculation period for early signals
- KLSE Sensitivity (1.8): Multiplier for flow calculations, higher = more sensitive
- Smoothing Length (5): Smoothing period for the main oscillator line
### Volume Filter Settings
- Volume Filter % (65): Minimum volume threshold as percentage of average
- Use Adaptive Volume Filter (true): Dynamically adjusts volume thresholds
### Signal Levels
- Strong Signal Level (15): Threshold for strong buy/sell signals
- Early Signal Level (10): Threshold for early buy/sell signals
- Early Signal Threshold (0.75): Sensitivity factor for early signals
### Advanced Settings
- Divergence Lookback (34): Period for checking price-flow divergences
- Show Signal Labels (true): Toggle text labels for signals
### Visual Settings
- Show Momentum Histogram (true): Toggle the momentum histogram display
- Show Early Signal (true): Toggle the early signal line display
- Show Zone Fills (true): Toggle background color fills
## How to Use This Indicator
### Installation
1. Add the indicator to your TradingView chart
2. Default settings are optimized for KLSE stocks
3. Customize parameters if needed for specific stocks
### Basic Interpretation
- Oscillator Above Zero: Bullish bias, buying pressure dominates
- Oscillator Below Zero: Bearish bias, selling pressure dominates
- Crossing Zero Line: Potential shift in market sentiment
- Extreme Readings: Possible overbought/oversold conditions
### Advanced Interpretation
- Divergences: Early warning of trend exhaustion
- Signal Confluences: Multiple signal types appearing together increase reliability
- Volume Confirmation: Signals with higher volume are more significant
- Momentum Alignment: Histogram should confirm direction of main oscillator
### Trading Strategies
#### Trend Following Strategy
1. Identify market trend direction
2. Wait for pullbacks shown by oscillator moving against trend
3. Enter when oscillator reverses back in trend direction with a Strong signal
4. Place stop loss below/above recent swing low/high
5. Take profit at previous resistance/support levels
#### Counter-Trend Strategy
1. Look for oscillator reaching extreme levels
2. Identify divergence between price and oscillator
3. Wait for oscillator to cross Early signal threshold
4. Enter position against prevailing trend
5. Use tight stop loss (1 ATR from entry)
6. Take profit at first resistance/support level
#### Breakout Confirmation Strategy
1. Identify stock consolidating in a range
2. Wait for price to break out of range
3. Confirm breakout with oscillator crossing zero line in breakout direction
4. Enter position in breakout direction
5. Place stop loss below/above the breakout level
6. Trail stop as price advances
### Signal Hierarchy and Reliability
From highest to lowest reliability:
1. Strong Buy/Sell signals with divergence and high volume
2. Strong Buy/Sell signals with high volume
3. Divergence signals followed by Early signals
4. Strong Buy/Sell signals with normal volume
5. Early Buy/Sell signals with high volume
6. Early Buy/Sell signals with normal volume
## Complete Trading Plan Example
### KLSE Market Trading System
#### Pre-Trading Preparation
1. Review overall market sentiment (bullish, bearish, or neutral)
2. Scan for stocks showing significant banker flow signals
3. Note key support/resistance levels for watchlist stocks
4. Prioritize trade candidates based on signal strength and volume
#### Entry Rules for Long Positions
1. Banker Flow Oscillator above zero line (positive flow environment)
2. One or more of the following signals present:
- Strong Buy signal (green arrow)
- Bullish Divergence signal (yellow triangle up)
- Early Buy signal (blue circle) with confirming price action
3. Entry confirmation requirements:
- Volume above 65% of 20-day average
- Price above short-term moving average (e.g., 20 EMA)
- No immediate resistance within 3% of entry price
4. Entry on the next candle open after signal confirmation
#### Entry Rules for Short Positions
1. Banker Flow Oscillator below zero line (negative flow environment)
2. One or more of the following signals present:
- Strong Sell signal (red arrow)
- Bearish Divergence signal (yellow triangle down)
- Early Sell signal (red circle) with confirming price action
3. Entry confirmation requirements:
- Volume above 65% of 20-day average
- Price below short-term moving average (e.g., 20 EMA)
- No immediate support within 3% of entry price
4. Entry on the next candle open after signal confirmation
#### Position Sizing Rules
1. Base risk per trade: 1% of trading capital
2. Position size calculation: Capital × Risk% ÷ Stop Loss Distance
3. Position size adjustments:
- Increase by 20% for Strong signals with above-average volume
- Decrease by 20% for Early signals without confirming price action
- Standard size for all other valid signals
#### Stop Loss Placement
1. For Long Positions:
- Place stop below the most recent swing low
- Minimum distance: 1.5 × ATR(14)
- Maximum risk: 1% of trading capital
2. For Short Positions:
- Place stop above the most recent swing high
- Minimum distance: 1.5 × ATR(14)
- Maximum risk: 1% of trading capital
#### Take Profit Strategy
1. First Target (33% of position):
- 1.5:1 reward-to-risk ratio
- Move stop to breakeven after reaching first target
2. Second Target (33% of position):
- 2.5:1 reward-to-risk ratio
- Trail stop at previous day's low/high
3. Final Target (34% of position):
- 4:1 reward-to-risk ratio or
- Exit when opposing signal appears (e.g., Strong Sell for long positions)
#### Trade Management Rules
1. After reaching first target:
- Move stop to breakeven
- Consider adding to position if new confirming signal appears
2. After reaching second target:
- Trail stop using banker flow signals
- Exit remaining position when:
- Oscillator crosses zero line in opposite direction
- Opposing signal appears
- Price closes below/above trailing stop level
3. Maximum holding period:
- 20 trading days for trend-following trades
- 10 trading days for counter-trend trades
- Re-evaluate if targets not reached within timeframe
#### Risk Management Safeguards
1. Maximum open positions: 5 trades
2. Maximum sector exposure: 40% of trading capital
3. Maximum daily drawdown limit: 3% of trading capital
4. Mandatory stop trading rules:
- After three consecutive losing trades
- After reaching 5% account drawdown
- Resume after two-day cooling period and strategy review
#### Performance Tracking
1. Track for each trade:
- Signal type that triggered entry
- Oscillator reading at entry and exit
- Volume relative to average
- Price action confirmation patterns
- Holding period
- Reward-to-risk achieved
2. Review performance metrics weekly:
- Win rate by signal type
- Average reward-to-risk ratio
- Profit factor
- Maximum drawdown
3. Adjust strategy parameters based on performance:
- Increase position size for highest performing signals
- Decrease or eliminate trades based on underperforming signals
## Advanced Usage Tips
1. Combine with Support/Resistance:
- Signals are more reliable when they occur at key support/resistance levels
- Look for banker flow divergence at major price levels
2. Multiple Timeframe Analysis:
- Use the oscillator on both daily and weekly timeframes
- Stronger signals when both timeframes align
- Enter on shorter timeframe when confirmed by longer timeframe
3. Sector Rotation Strategy:
- Compare banker flow across different sectors
- Rotate capital to sectors showing strongest positive flow
- Avoid sectors with persistent negative flow
4. Volatility Adjustments:
- During high volatility periods, wait for Strong signals only
- During low volatility periods, Early signals can be more actionable
5. Optimizing Parameters:
- For more volatile stocks: Increase Smoothing Length (6-8)
- For less volatile stocks: Decrease KLSE Sensitivity (1.2-1.5)
- For intraday trading: Reduce all length parameters by 30-50%
## Fine-Tuning for Different Markets
While optimized for KLSE, the indicator can be adapted for other markets:
1. For US Stocks:
- Reduce KLSE Sensitivity to 1.5
- Increase Volume Filter to 75%
- Adjust Strong Signal Level to 18
2. For Forex:
- Increase Smoothing Length to 8
- Reduce Early Signal Threshold to 0.6
- Focus more on divergence signals than crossovers
3. For Cryptocurrencies:
- Increase KLSE Sensitivity to 2.2
- Reduce Signal Levels (Strong: 12, Early: 8)
- Use higher Volume Filter (80%)
By thoroughly understanding and properly implementing the Enhanced KLSE Banker Flow Oscillator, traders can gain a significant edge in identifying institutional money flow and making more informed trading decisions, particularly in the Malaysian stock market.

Shavarie's MCV IndicatorShavarie's MCV Indicator (MACD + CCI + Volume Delta) is a custom-built trend-following and volume-based indicator that helps traders confirm market direction with high accuracy. It combines the MACD (Moving Average Convergence Divergence), CCI (Commodity Channel Index), and Volume Delta, ensuring that all three indicators align before making a trading decision. The goal is to filter out false signals and provide high-probability trade setups.
History & Development
Shavarie's MCV Indicator was developed by Shavarie Gordon, an experienced swing trader, to improve trend confirmation on Gold (XAUUSD) and other markets. After testing various indicators, Shavarie discovered that MACD, CCI, and Volume Delta together provide the best combination of trend strength, momentum, and real-time volume flow. This indicator was designed to eliminate lagging signals, improve win rates, and enhance market timing for both swing and scalping strategies.
How It Works & Calculations
MACD (Moving Average Convergence Divergence)
Measures momentum and trend strength using the difference between a 12-period EMA and a 26-period EMA.
The MACD line and Signal line crossover confirms buy/sell signals.
A rising MACD histogram confirms bullish strength, while a falling histogram confirms bearish strength.
CCI (Commodity Channel Index)
Measures how far the price is from its statistical average.
Above +100 → Overbought (strong trend continuation or reversal).
Below -100 → Oversold (strong trend continuation or reversal).
When CCI aligns with MACD, it confirms momentum strength.
Volume Delta
Measures the difference between buying and selling volume in real time.
A positive delta means more aggressive buying (bullish).
A negative delta means more aggressive selling (bearish).
Helps confirm MACD and CCI trends by showing real volume strength.
Key Takeaways & Features
✅ No false signals: All three indicators must align before entering a trade.
✅ Trend confirmation: Ensures momentum and volume agree before trading.
✅ Works on multiple timeframes: Designed for swing trading on the daily and scalping on 45 min + 5 min.
✅ Great for Gold & Metals: Optimized for XAUUSD, XAUJPY, XAU/AUD, and possibly Palladium (XPDUSD).
✅ Custom-built by a professional trader: Developed by Shavarie Gordon after extensive testing.
Summary
Shavarie’s MCV Indicator is a powerful and reliable trading tool that combines momentum, trend, and volume analysis. By ensuring that MACD, CCI, and Volume Delta align, it eliminates false signals and increases trade accuracy. Whether used for swing trading or scalping, this indicator helps traders enter high-probability trades with confidence.

Neon Momentum Waves StrategyIntroduction
The Neon Momentum Waves Strategy is a momentum-based indicator designed to help traders visualize potential shifts in market direction. It builds upon a MACD-style calculation while incorporating an enhanced visual representation of momentum waves. This approach may assist traders in identifying areas of increasing or decreasing momentum, potentially aligning with market trends or reversals.
How It Works
This strategy is based on a modified MACD (Moving Average Convergence Divergence) method, calculating the difference between two Exponential Moving Averages (EMAs). The momentum wave represents this difference, while an additional smoothing line (signal line) helps highlight potential momentum shifts.
Key Components:
Momentum Calculation:
Uses a fast EMA (12-period) and a slow EMA (26-period) to measure short-term and long-term momentum.
A signal line (20-period EMA of the MACD difference) smooths fluctuations.
The histogram (momentum wave) represents the divergence between the MACD value and the signal line.
Interpreting Momentum Changes:
Momentum Increasing: When the histogram rises above the zero line, it may indicate strengthening upward movement.
Momentum Decreasing: When the histogram moves below the zero line, it may signal a weakening trend or downward momentum.
Potential Exhaustion Points: Users can define custom threshold levels (default: ±10) to highlight when momentum is significantly strong or weak.
Visual Enhancements:
The neon glow effect is created by layering multiple plots with decreasing opacity, enhancing the clarity of momentum shifts.
Aqua-colored waves highlight upward momentum, while purple waves represent downward momentum.
Horizontal reference lines mark the zero line and user-defined thresholds to improve interpretability.
How It Differs from Traditional Indicators
Improved Visualization: Unlike standard MACD histograms, this approach provides clearer visual cues using a neon-style wave format.
Customizable Thresholds: Rather than relying solely on MACD crossovers, users can adjust sensitivity settings to better suit their trading style.
Momentum-Based Approach: The strategy is focused on visualizing shifts in momentum strength, rather than predicting price movements.
Potential Use Cases
Momentum Trend Awareness: Helps traders identify periods where momentum appears to be strengthening or fading.
Market Structure Analysis: May complement other indicators to assess whether price action aligns with momentum changes.
Flexible Timeframe Application: Can be used across different timeframes, depending on the trader’s strategy.
Important Considerations
This strategy is purely momentum-based and does not incorporate volume, fundamental factors, or price action confirmation.
Momentum shifts do not guarantee price direction changes—they should be considered alongside broader market context.
The strategy may perform differently in trending vs. ranging markets, so adjustments in sensitivity may be needed.
Risk management is essential—traders should apply proper stop-losses and position sizing techniques in line with their risk tolerance.
Conclusion
The Neon Momentum Waves Strategy provides a visually enhanced method of tracking momentum, allowing traders to observe potential changes in market strength. While not a predictive tool, it serves as a complementary indicator that may help traders in momentum-based decision-making. As with any technical tool, it should be used as part of a broader strategy that considers multiple factors in market analysis.
